- Elastic Cloud Serverless
- Elasticsearch
- Elastic Observability
- Get started
- Observability overview
- Elastic Observability Serverless billing dimensions
- Create an Observability project
- Quickstart: Monitor hosts with Elastic Agent
- Quickstart: Monitor your Kubernetes cluster with Elastic Agent
- Quickstart: Monitor hosts with OpenTelemetry
- Quickstart: Unified Kubernetes Observability with Elastic Distributions of OpenTelemetry (EDOT)
- Quickstart: Collect data with AWS Firehose
- Quickstart: Send data to the Elastic Cloud Managed OTLP Endpoint
- Get started with dashboards
- Applications and services
- Application performance monitoring (APM)
- Get started with traces and APM
- Learn about data types
- Collect application data
- View and analyze data
- Act on data
- Use APM securely
- Reduce storage
- Managed intake service event API
- Troubleshooting
- Synthetic monitoring
- Get started
- Scripting browser monitors
- Configure lightweight monitors
- Manage monitors
- Work with params and secrets
- Analyze monitor data
- Monitor resources on private networks
- Use the CLI
- Configure a Synthetics project
- Multifactor Authentication for browser monitors
- Configure Synthetics settings
- Grant users access to secured resources
- Manage data retention
- Scale and architect a deployment
- Synthetics Encryption and Security
- Troubleshooting
- Visualize OTLP data
- Application performance monitoring (APM)
- Infrastructure and hosts
- Logs
- Inventory
- Incident management
- Data set quality
- Observability AI Assistant
- Machine learning
- Reference
- Get started
- Elastic Security
- Elastic Security overview
- Security billing dimensions
- Create a Security project
- Elastic Security requirements
- Elastic Security UI
- AI for Security
- Ingest data
- Configure endpoint protection with Elastic Defend
- Manage Elastic Defend
- Endpoints
- Policies
- Trusted applications
- Event filters
- Host isolation exceptions
- Blocklist
- Optimize Elastic Defend
- Event capture and Elastic Defend
- Endpoint protection rules
- Identify antivirus software on your hosts
- Allowlist Elastic Endpoint in third-party antivirus apps
- Elastic Endpoint self-protection features
- Elastic Endpoint command reference
- Endpoint response actions
- Cloud Security
- Explore your data
- Dashboards
- Detection engine overview
- Rules
- Alerts
- Advanced Entity Analytics
- Investigation tools
- Asset management
- Manage settings
- Troubleshooting
- Manage your project
- Changelog
Quickstart: Monitor hosts with Elastic Agent
editQuickstart: Monitor hosts with Elastic Agent
editIn this quickstart guide, you’ll learn how to scan your host to detect and collect logs and metrics, then navigate to dashboards to further analyze and explore your observability data. You’ll also learn how to get value out of your observability data.
To scan your host, you’ll run an auto-detection script that downloads and installs Elastic Agent, which is used to collect observability data from the host and send it to Elastic.
The script also generates an Elastic Agent configuration file that you can use with your existing Infrastructure-as-Code tooling.
Prerequisites
edit- An Elastic Observability Serverless project. To learn more, refer to Create an Observability project.
- A user with the Admin role or higher—required to onboard system logs and metrics. To learn more, refer to Assign user roles and privileges.
- Root privileges on the host—required to run the auto-detection script used in this quickstart.
Limitations
edit-
The auto-detection script works on Linux and MacOS only. Support for the
lsofcommand is also required if you want to detect custom log files. - If you’ve installed Apache or Nginx in a non-standard location, you’ll need to specify log file paths manually when you run the scan.
- Because Docker Desktop runs in a VM, its logs are not auto-detected.
Collect your data
edit- Create a new Elastic Observability Serverless project, or open an existing one.
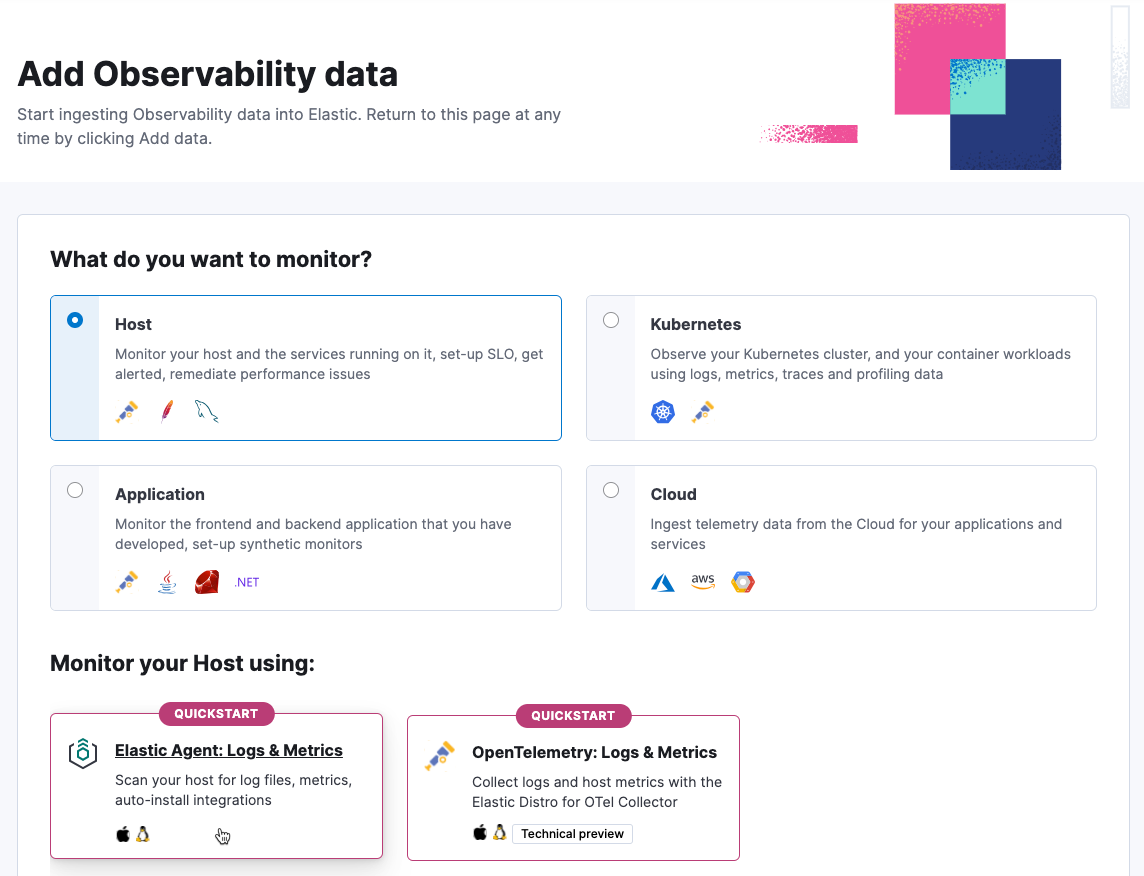
- In your Elastic Observability Serverless project, go to Add Data.
-
Under What do you want to monitor? select Host, and then select Elastic Agent: Logs & Metrics.

-
Copy the install command.
You’ll run this command to download the auto-detection script, scan your system for observability data, and install Elastic Agent.
- Open a terminal on the host you want to scan, and run the command.
-
Review the list of log files:
-
Enter
Yto ingest all the log files listed. -
Enter
nto either exclude log files or specify additional log paths. EnterYto confirm your selections.
-
Enter
When the script is done, you’ll see a message like "Elastic Agent is configured and running."
There might be a slight delay before logs and other data are ingested.
Need to scan your host again?
The auto-detection script (auto_detect.sh) is downloaded to the directory where you ran the installation command.
You can re-run the script on the same host to detect additional logs.
The script will scan the host and reconfigure Elastic Agent with any additional logs that are found.
If the script misses any custom logs, you can add them manually by entering n after the script has finished scanning the host.
Visualize your data
editAfter installation is complete and all relevant data is flowing into Elastic, the Visualize your data section will show links to assets you can use to analyze your data. Depending on what type of observability data was collected, the page may link to the following integration assets:
| Integration asset | Description |
|---|---|
Apache |
Prebuilt dashboard for monitoring Apache HTTP server health using error and access log data. |
Custom .log files |
Logs Explorer for analyzing custom logs. |
Docker |
Prebuilt dashboard for monitoring the status and health of Docker containers. |
MySQL |
Prebuilt dashboard for monitoring MySQl server health using error and access log data. |
Nginx |
Prebuilt dashboard for monitoring Nginx server health using error and access log data. |
System |
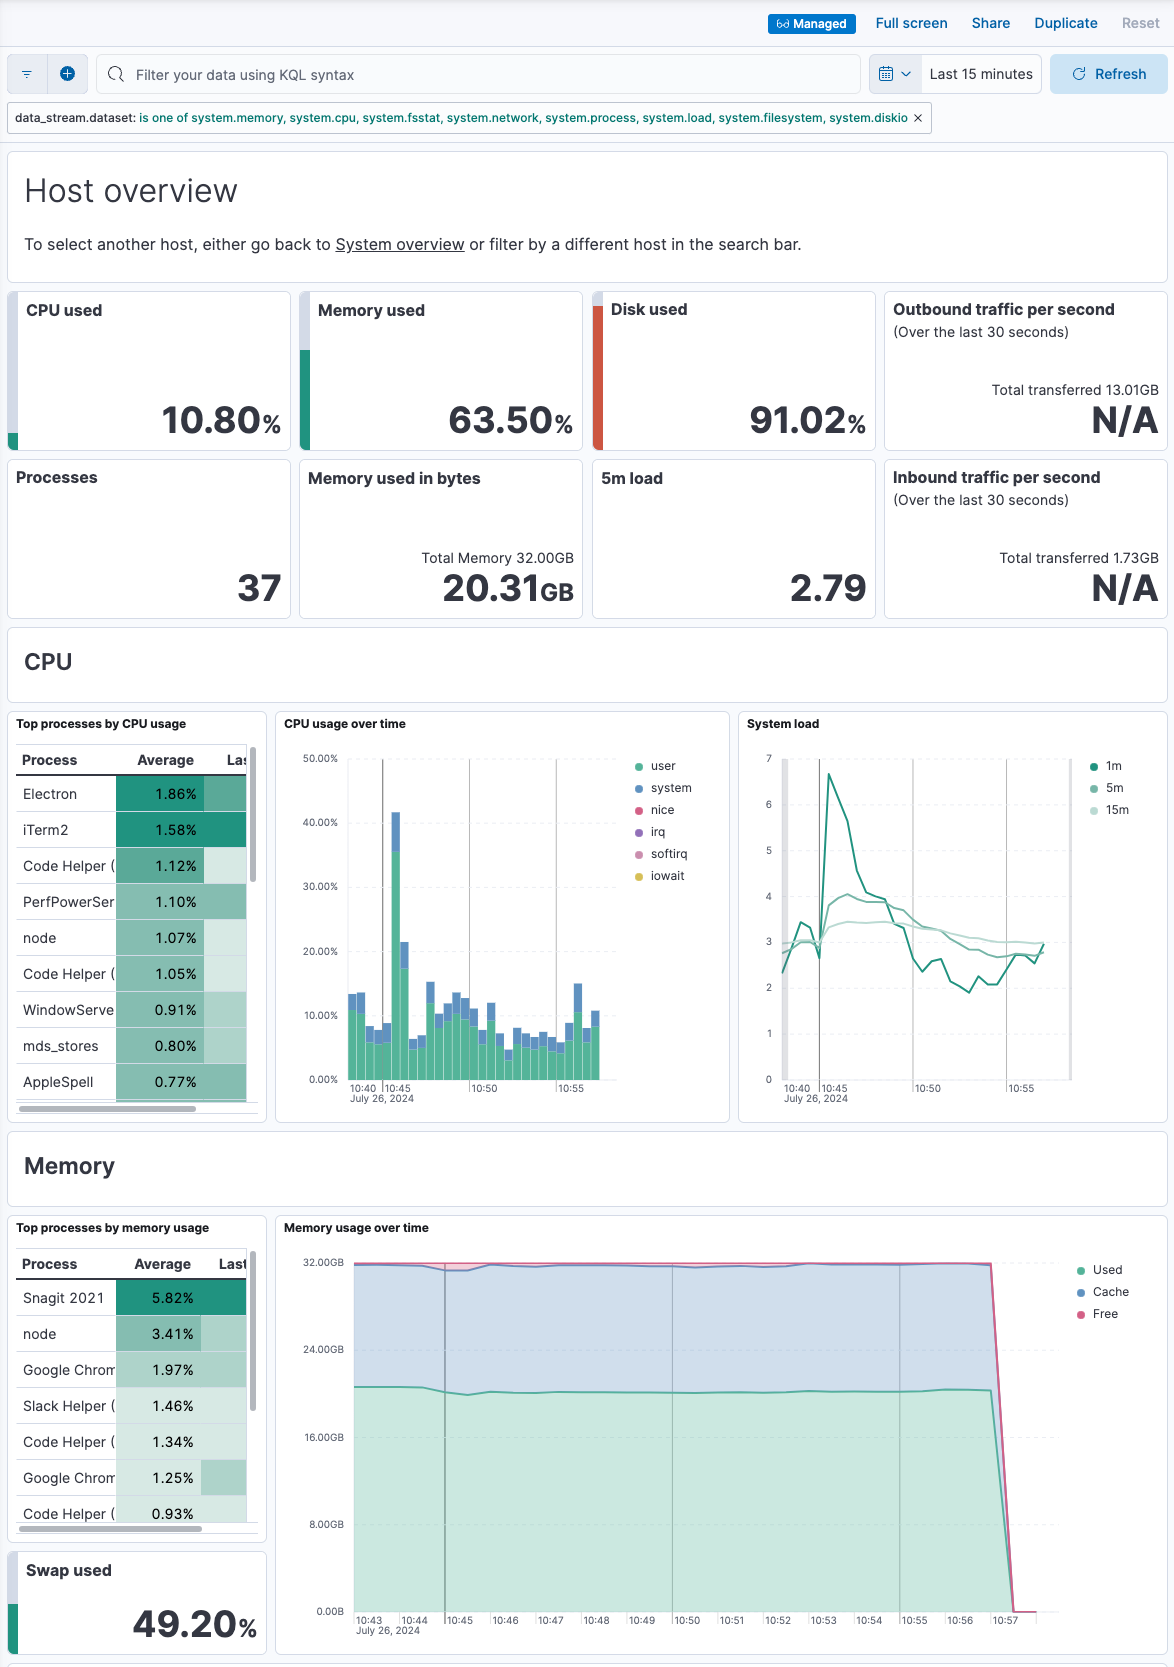
Prebuilt dashboard for monitoring host status and health using system metrics. |
Other prebuilt dashboards |
Prebuilt dashboards are also available for systems and services not described here, including PostgreSQL, Redis, HAProxy, Kafka, RabbitMQ, Prometheus, Apache Tomcat, and MongoDB. |
For example, you can navigate the Host overview dashboard to explore detailed metrics about system usage and throughput. Metrics that indicate a possible problem are highlighted in red.

Get value out of your data
editAfter using the dashboards to examine your data and confirm you’ve ingested all the host logs and metrics you want to monitor, you can use Elastic Observability Serverless to gain deeper insight into your data.
For host monitoring, the following capabilities and features are recommended:
-
In the Infrastructure UI, analyze and compare data collected from your hosts. You can also:
- Detect anomalies for memory usage and network traffic on hosts.
- Create alerts that notify you when an anomaly is detected or a metric exceeds a given value.
-
In the Logs Explorer, search and filter your log data, get information about the structure of log fields, and display your findings in a visualization. You can also:
- Monitor log data set quality to find degraded documents.
- Run a pattern analysis to find patterns in unstructured log messages.
- Create alerts that notify you when an Observability data type reaches or exceeds a given value.
-
Use machine learning and AIOps features to apply predictive analytics and machine learning to your data:
- Detect anomalies by comparing real-time and historical data from different sources to look for unusual, problematic patterns.
- Analyze log spikes and drops.
- Detect change points in your time series data.
Refer to Observability overview for a description of other useful features.