- Elastic Cloud Serverless
- Elasticsearch
- Get started
- Connect to your endpoint
- Client libraries
- Get started with the Elasticsearch Go client
- Get started with the Java client
- Get started with the serverless .NET client
- Get started with the serverless Node.js client
- Get started with the serverless PHP client
- Get started with the Elasticsearch Python client
- Get started with the serverless Ruby client
- REST APIs
- Developer tools
- Ingest your data
- Search your data
- Explore your data
- Playground
- Serverless differences
- Elasticsearch billing dimensions
- Elastic Observability
- Get started
- Observability overview
- Elastic Observability Serverless billing dimensions
- Create an Observability project
- Quickstart: Monitor hosts with Elastic Agent
- Quickstart: Monitor your Kubernetes cluster with Elastic Agent
- Quickstart: Unified Kubernetes Observability with Elastic Distributions of OpenTelemetry (EDOT)
- Quickstart: Collect data with AWS Firehose
- Get started with dashboards
- Applications and services
- Application performance monitoring (APM)
- Get started with traces and APM
- Learn about data types
- Collect application data
- View and analyze data
- Act on data
- Use APM securely
- Reduce storage
- Managed intake service event API
- Troubleshooting
- Synthetic monitoring
- Get started
- Scripting browser monitors
- Configure lightweight monitors
- Manage monitors
- Work with params and secrets
- Analyze monitor data
- Monitor resources on private networks
- Use the CLI
- Configure a Synthetics project
- Multifactor Authentication for browser monitors
- Configure Synthetics settings
- Grant users access to secured resources
- Manage data retention
- Scale and architect a deployment
- Synthetics Encryption and Security
- Troubleshooting
- Application performance monitoring (APM)
- Infrastructure and hosts
- Logs
- Inventory
- Incident management
- Data set quality
- Observability AI Assistant
- Machine learning
- Reference
- Limitations
- Get started
- Elastic Security
- Elastic Security overview
- Security billing dimensions
- Create a Security project
- Elastic Security requirements
- Elastic Security UI
- AI for Security
- Ingest data
- Configure endpoint protection with Elastic Defend
- Manage Elastic Defend
- Endpoints
- Policies
- Trusted applications
- Event filters
- Host isolation exceptions
- Blocklist
- Optimize Elastic Defend
- Event capture and Elastic Defend
- Endpoint protection rules
- Allowlist Elastic Endpoint in third-party antivirus apps
- Elastic Endpoint self-protection features
- Elastic Endpoint command reference
- Endpoint response actions
- Cloud Security
- Explore your data
- Dashboards
- Detection engine overview
- Rules
- Alerts
- Advanced Entity Analytics
- Investigation tools
- Asset management
- Manage settings
- Troubleshooting
- Manage your project
- Changelog
Cloud Native Vulnerability Management Dashboard
editCloud Native Vulnerability Management Dashboard
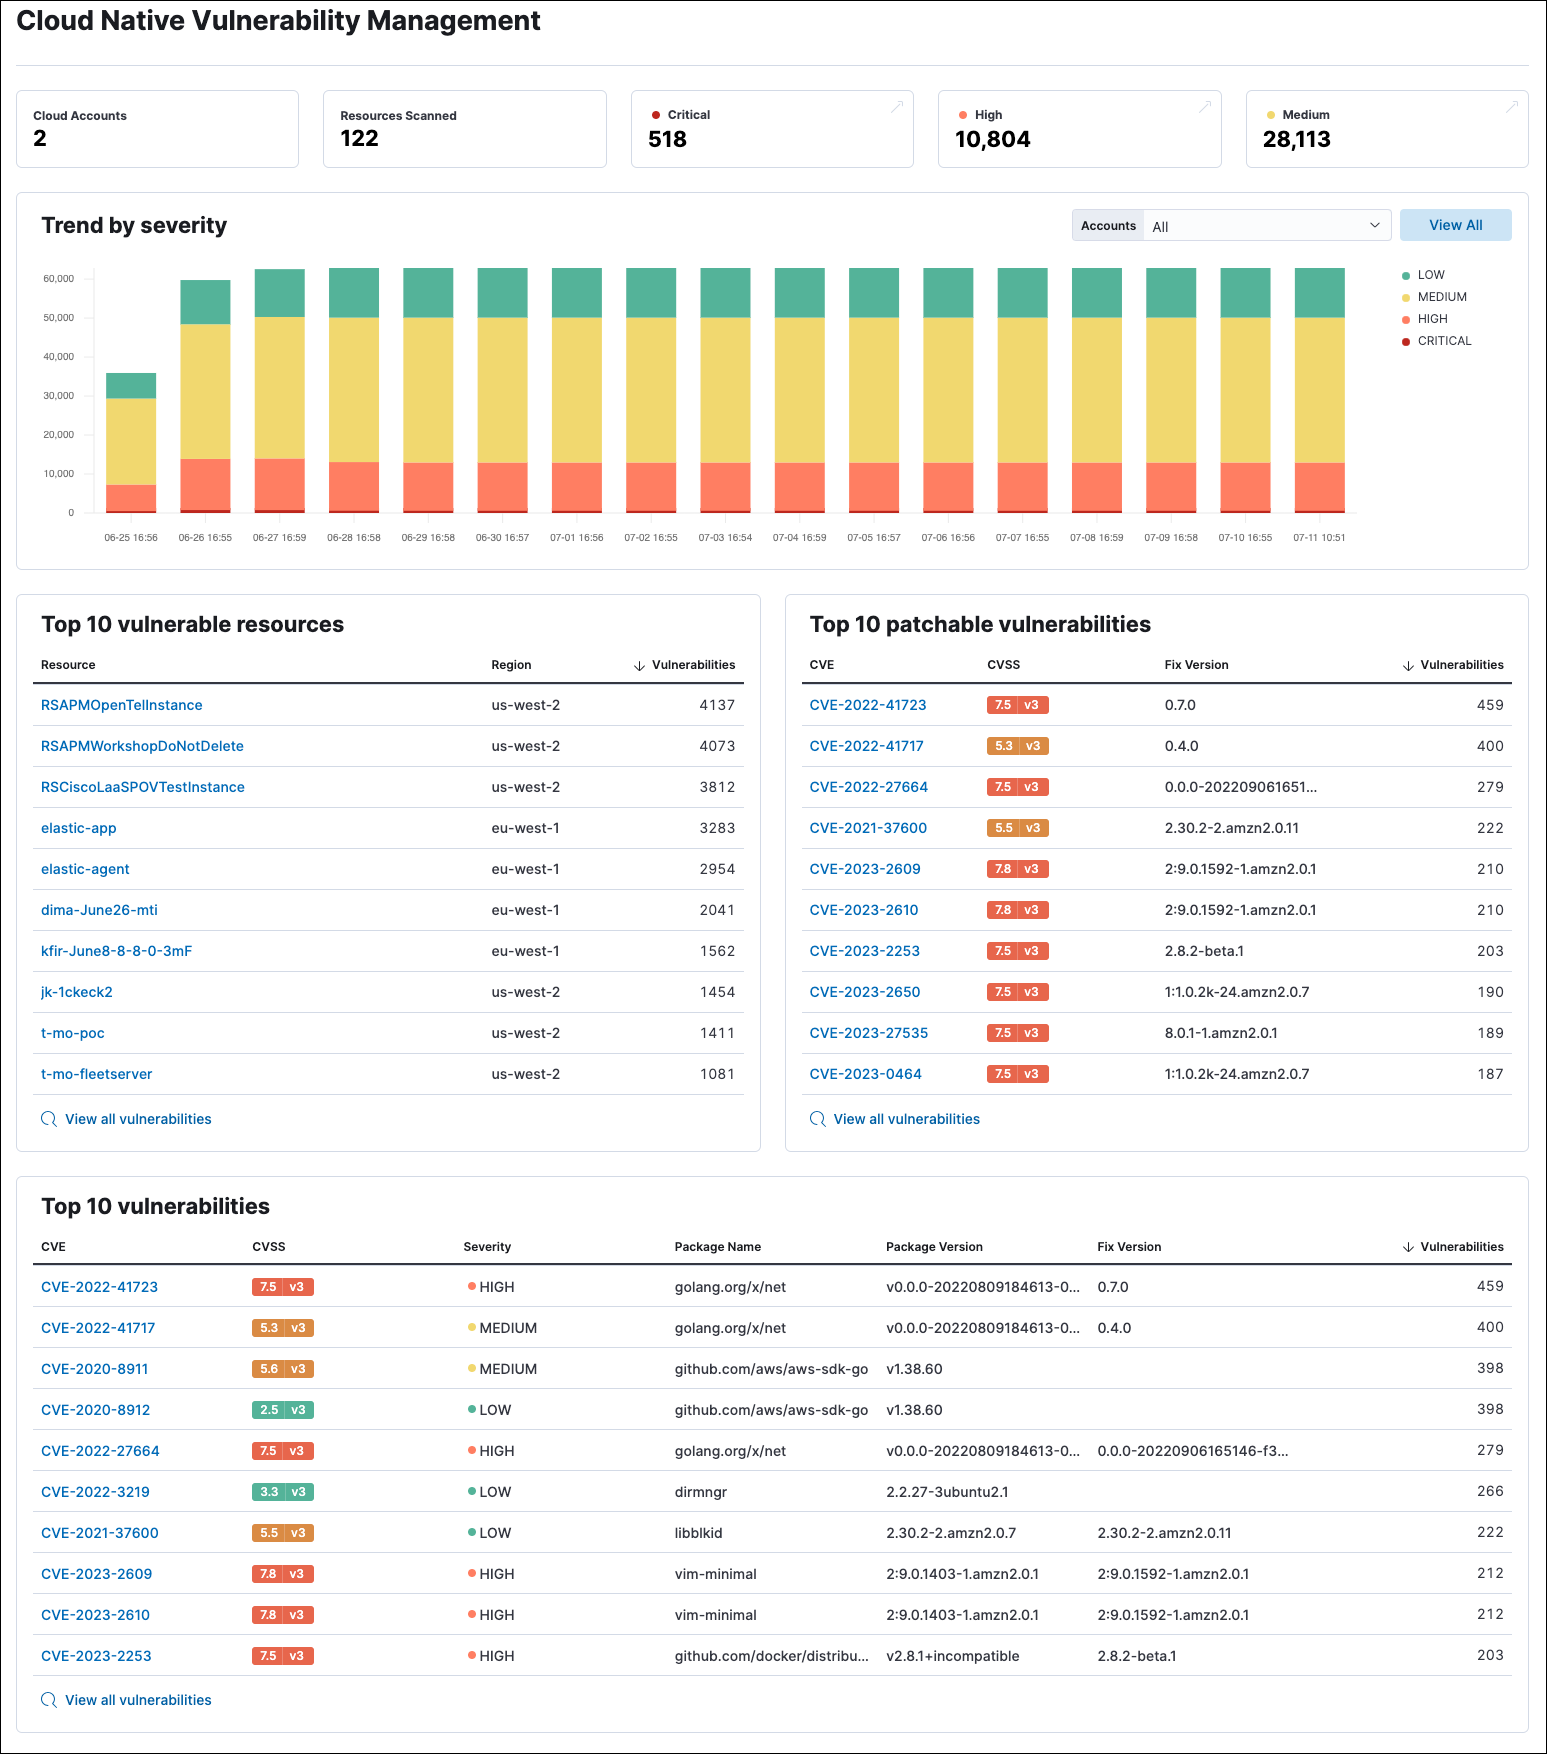
editThe Cloud Native Vulnerability Management (CNVM) dashboard gives you an overview of vulnerabilities detected in your cloud infrastructure.
Requirements
- To collect this data, install the Cloud Native Vulnerability Management integration.
CNVM dashboard UI
editThe summary cards at the top of the dashboard display the number of monitored cloud accounts, scanned virtual machines (VMs), and vulnerabilities (grouped by severity).
The Trend by severity bar graph complements the summary cards by displaying the number of vulnerabilities found on your infrastructure over time, sorted by severity. It has a maximum time scale of 30 days.
Graph tips
- Click the severity levels legend on its right to hide/show each severity level.
- To display data from specific cloud accounts, select the account names from the Accounts drop-down menu.
The page also includes three tables:
- Top 10 vulnerable resources shows your VMs with the highest number of vulnerabilities.
- Top 10 patchable vulnerabilities shows the most common vulnerabilities in your environment that can be fixed by a software update.
- Top 10 vulnerabilities shows the most common vulnerabilities in your environment, with additional details.
Click View all vulnerabilities at the bottom of a table to open the Vulnerabilities Findings page, where you can view additional details.
On this page