Detections and alerts
Elastic Stack Serverless Security
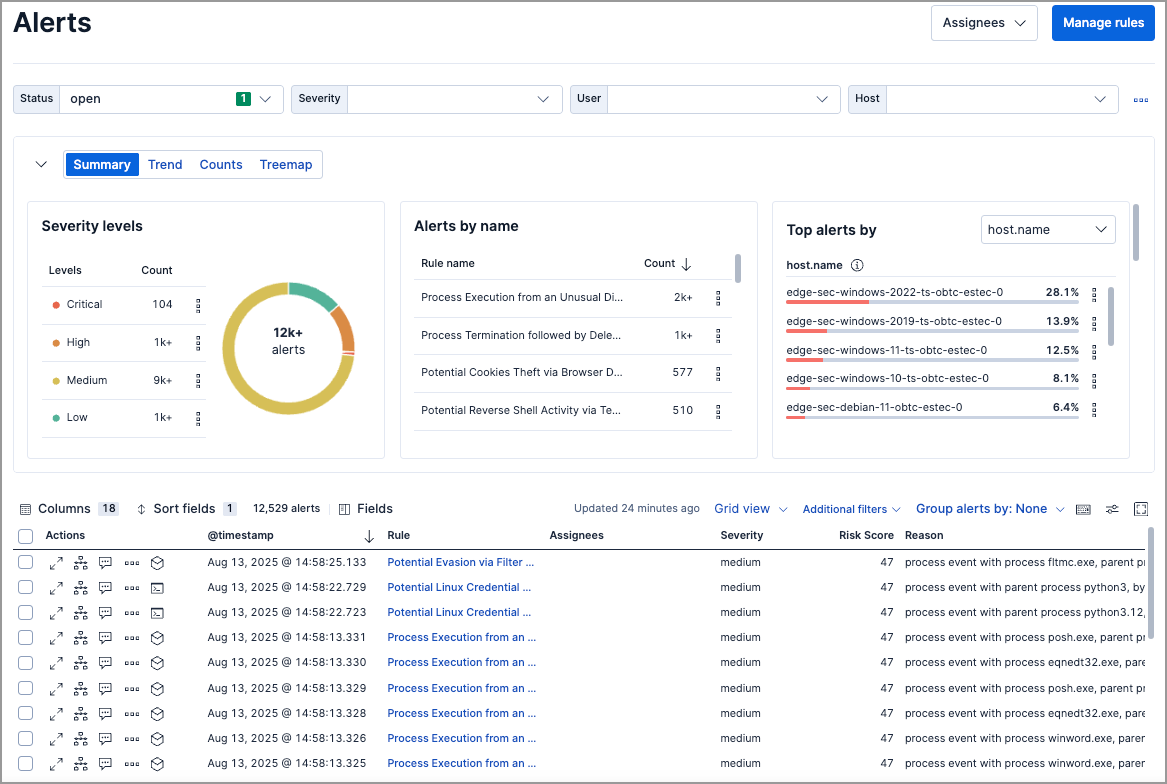
Use the detection engine to create and manage rules and view the alerts these rules create. Rules periodically search indices (such as logs-* and filebeat-*) for suspicious source events and create alerts when a rule’s conditions are met. When an alert is created, its status is Open. To help track investigations, an alert’s status can be set as Open, Acknowledged, or Closed.
In addition to creating your own rules, enable Elastic prebuilt rules to immediately start detecting suspicious activity. For detailed information on all the prebuilt rules, see the Prebuilt rule reference section. Once the prebuilt rules are loaded and running, Tune detection rules and Add and manage exceptions explain how to modify the rules to reduce false positives and get a better set of actionable alerts. You can also use exceptions and value lists when creating or modifying your own rules.
There are several special prebuilt rules you need to know about:
- Endpoint protection rules: Automatically create alerts based on Elastic Defend's threat monitoring and prevention.
- External Alerts: Automatically creates an alert for all incoming third-party system alerts (for example, Suricata alerts).
If you want to receive notifications via external systems, such as Slack or email, when alerts are created, use the Kibana Alerting and Actions framework.
To use Kibana Alerting for detection alert notifications in the Elastic Stack, you need the appropriate license.
After rules have started running, you can monitor their executions to verify they are functioning correctly, as well as view, manage, and troubleshoot alerts (see Manage detection alerts and Monitor and troubleshoot rule executions).
You can create and manage rules and alerts via the UI or the Detections API.
To make sure you can access Detections and manage rules, see Detections requirements.
Elastic Stack
Cold data tiers store time series data that's accessed infrequently and rarely updated, while frozen data tiers hold time series data that's accessed even less frequently and never updated. If you're automating searches across different data tiers using rules, consider the following best practices and limitations.
- Retention in hot tier: We recommend keeping data in the hot tier (Index lifecycle management hot phase) for at least 24 hours. Index lifecycle management policies that move ingested data from the hot phase to another phase (for example, cold or frozen) in less than 24 hours may cause performance issues and/or rule execution errors.
- Replicas for mission-critical data: Your data should have replicas if it must be highly available. Since frozen tiers don't support replicas, shard unavailability can cause partial rule run failures. Shard unavailability may be also encountered during or after Elastic Stack upgrades. If this happens, you can manually rerun rules over the affected time period once the shards are available.
Data tiers are a powerful and useful tool. When using them, keep the following in mind:
- To avoid rule failures, do not modify index lifecycle management policies for {elastic-sec}-controlled indices, such as alert and list indices.
- Source data must have an index lifecycle management policy that keeps it in the hot or warm tiers for at least 24 hours before moving to cold or frozen tiers.
Indicator match rules provide a powerful capability to search your security data; however, their queries can consume significant deployment resources. When creating an indicator match rule, we recommend limiting the time range of the indicator index query to the minimum period necessary for the desired rule coverage. For example, the default indicator index query @timestamp > "now-30d/d" searches specified indicator indices for indicators ingested during the past 30 days and rounds the query start time down to the nearest day (resolves to UTC 00:00:00). Without this limitation, the rule will include all of the indicators in your indicator indices, which may extend the time it takes for the indicator index query to complete.
In addition, the following support restrictions are in place:
- Indicator match rules don’t support cold or frozen data. Cold or frozen data in indices queried by indicator match rules must be older than the time range queried by the rule. If your data’s timestamps are unreliable, you can exclude cold and frozen tier data using a Query DSL filter.
- Indicator match rules with an additional look-back time value greater than 24 hours are not supported.
Detections requirements provides detailed information on all the permissions required to initiate and use the Detections feature.
Depending on your privileges and whether detection system indices have already been created for the Kibana space, you might get one of these error messages when you open the Alerts or Rules page:
Let’s set up your detection engineIf you get this message, a user with specific privileges must visit the Alerts or Rules page before you can view detection alerts and rules. Refer to Enable and access detections for a list of all the requirements.
NoteFor self-managed Elastic Stack deployments only, this message may be displayed when the
xpack.encryptedSavedObjects.encryptionKeysetting has not been added to thekibana.ymlfile. For more information, refer to Configure self-managed Elastic Stack deployments.Detection engine permissions requiredIf you get this message, you do not have the required privileges to view the Detections feature, and you should contact your Kibana administrator.
NoteFor self-managed Elastic Stack deployments only, this message may be displayed when the
xpack.security.enabledsetting is not enabled in theelasticsearch.ymlfile. For more information, refer to Configure self-managed Elastic Stack deployments.
To learn how your rules and alerts are affected by using the logsdb index mode, refer to Using logsdb index mode with Elastic Security.
Utilize the Detection-as-Code (DaC) principles to externally manage your detection rules.
The Elastic Security Labs team uses the detection-rules repo to develop, test, and release Elastic Security's prebuilt rules. The repo provides DaC features and allows you to customize settings to simplify the setup for managing user rules with the DaC pipeline.
To get started, refer to the DaC documentation.