Entity Analytics dashboard
Elastic Stack Serverless Security
The Entity Analytics dashboard provides a centralized view of emerging insider threats - including host risk, user risk, and anomalies from within your network. Use it to triage, investigate, and respond to these emerging threats.
In Elastic Stack, a Platinum subscription or higher is required.
The dashboard includes the following sections:
- Entity KPIs (key performance indicators)
- User Risk Scores
- Host Risk Scores
- Service Risk Scores
- Entities
- Anomalies
Displays the total number of critical hosts, critical users, and anomalies. Select a link to jump to the Hosts page, Users page, or Anomalies table.
To display user risk scores, you must turn on the risk scoring engine.
Displays user risk score data for your environment, including the total number of users, and the five most recently recorded user risk scores, with their associated user names, risk data, and number of detection alerts. Like host risk scores, user risk scores are calculated using a weighted sum on a scale of 0 (lowest) to 100 (highest).
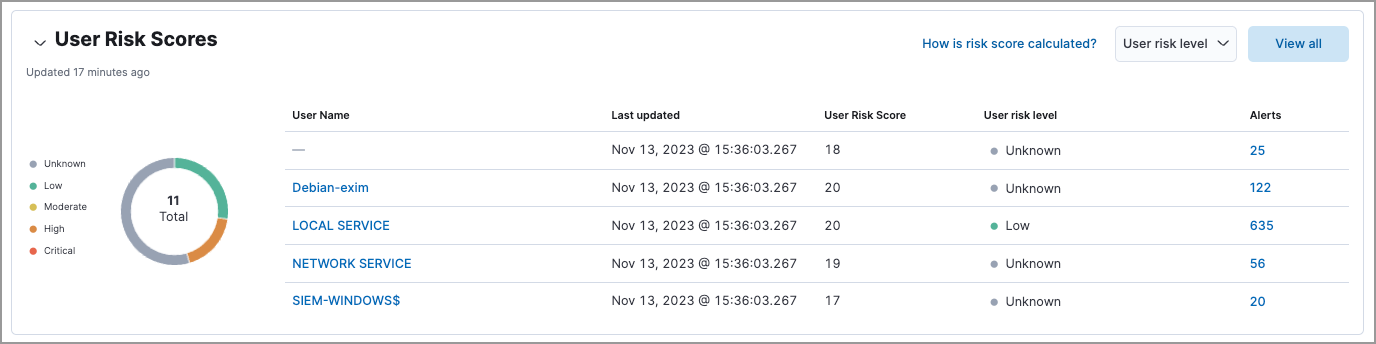
Interact with the table to filter data, view more details, and take action:
- Select the User risk level menu to filter the chart by the selected level.
- Click a user name link to open the entity details flyout.
- Hover over a user name link to display inline actions: Add to timeline, which adds the selected value to Timeline, and Copy to Clipboard, which copies the user name value for you to paste later.
- Click View all in the upper-right to display all user risk information on the Users page.
- Click the number link in the Alerts column to view the alerts on the Alerts page. Hover over the number and select Investigate in timeline (
 ) to launch Timeline with a query that includes the associated user name value.
For more information about user risk scores, refer to Entity risk scoring.
To display host risk scores, you must turn on the risk scoring engine.
Displays host risk score data for your environment, including the total number of hosts, and the five most recently recorded host risk scores, with their associated host names, risk data, and number of detection alerts. Host risk scores are calculated using a weighted sum on a scale of 0 (lowest) to 100 (highest).
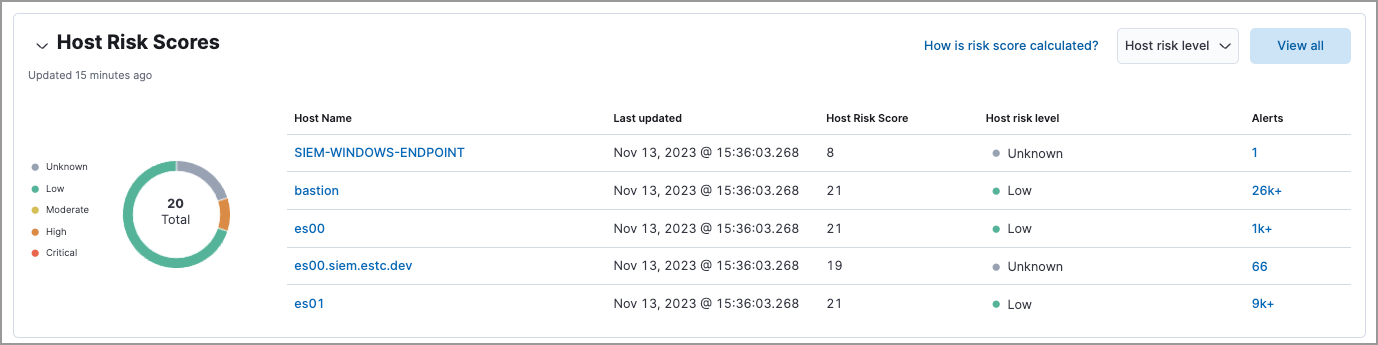
Interact with the table to filter data, view more details, and take action:
- Select the Host risk level menu to filter the chart by the selected level.
- Click a host name link to open the entity details flyout.
- Hover over a host name link to display inline actions: Add to timeline, which adds the selected value to Timeline, and Copy to Clipboard, which copies the host name value for you to paste later.
- Click View all in the upper-right to display all host risk information on the Hosts page.
- Click the number link in the Alerts column to view the alerts on the Alerts page. Hover over the number and select Investigate in timeline () to launch Timeline with a query that includes the associated host name value.
For more information about host risk scores, refer to Entity risk scoring.
To display service risk scores, you must turn on the risk scoring engine.
Displays service risk score data for your environment, including the total number of services, and the five most recently recorded service risk scores, with their associated service names, risk data, and number of detection alerts. Service risk scores are calculated using a weighted sum on a scale of 0 (lowest) to 100 (highest).
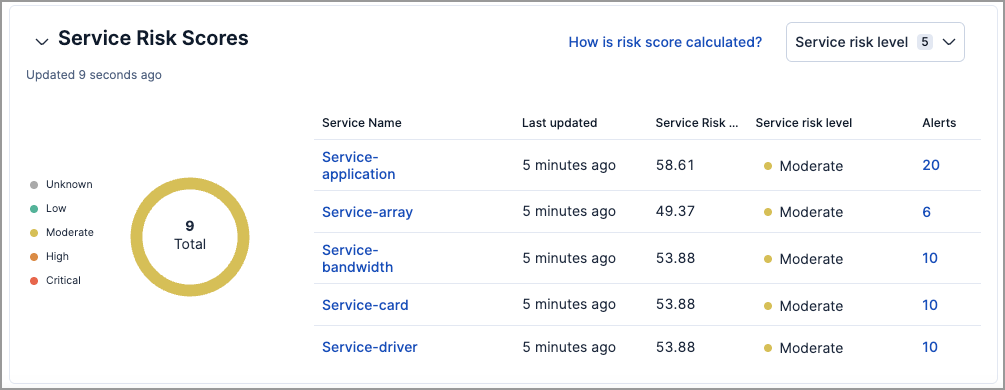
Interact with the table to filter data, view more details, and take action:
- Select the Service risk level menu to filter the chart by the selected level.
- Click a service name link to open the service details flyout.
- Hover over a service name link to display inline actions: Add to timeline, which adds the selected value to Timeline, and Copy to Clipboard, which copies the service name value for you to paste later.
- Click the number link in the Alerts column to view the alerts on the Alerts page. Hover over the number and select Investigate in timeline () to launch Timeline with a query that includes the associated service name value.
For more information about service risk scores, refer to Entity risk scoring.
To display the Entities section, you must enable the entity store.
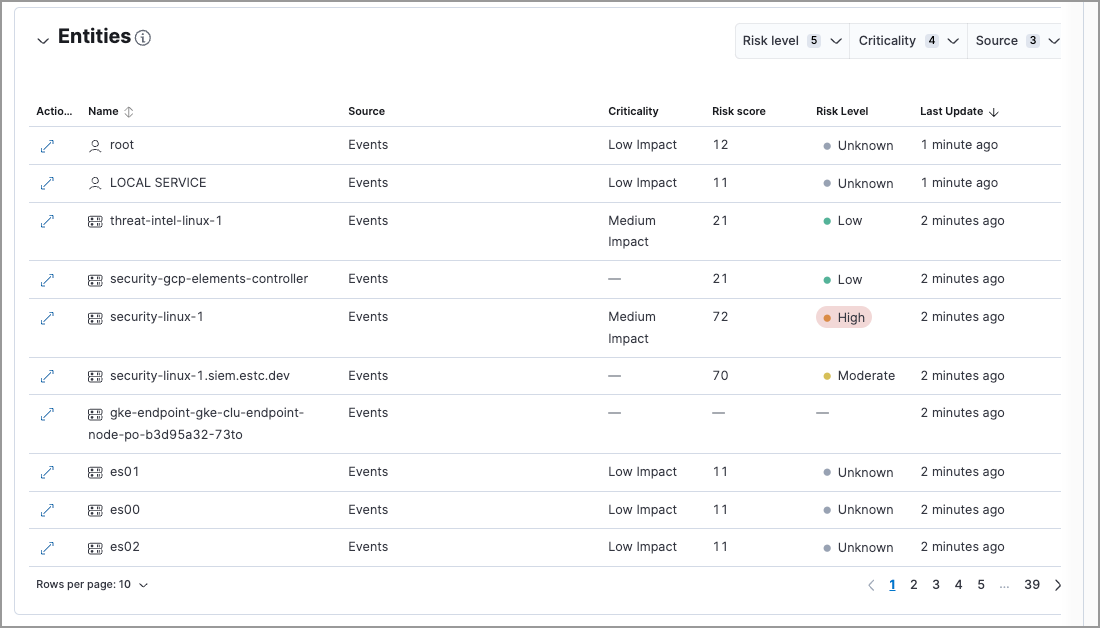
The Entities section provides a centralized view of all hosts, users, and services in your environment. It displays entities from the entity store, which meet any of the following criteria:
- Have been observed by Elastic Security
- Have an asset criticality assignment
- Have been added to Elastic Security through an integration, such Active Directory or Okta
The Entities table only shows a subset of the data available for each entity. You can query the .entities.v1.latest.security_user_<space-id>, .entities.v1.latest.security_host_<space-id>, and .entities.v1.latest.security_service_<space-id> indices to see all the fields for each entity in the entity store.
Entity data from different sources appears in the Entities section based on the following timelines:
- When you first enable the entity store, only data stored in the last 24 hours is processed. After that, data is processed continuously.
- Observed events from the Elastic Security default data view are processed in near real-time.
- Entity Analytics data, such as entity risk scores and asset criticality (including bulk asset criticality upload), is also processed in near real-time.
- The availability of entities extracted from Entity Analytics integrations depends on the specific integration. Refer to Active Directory Entity Analytics, Microsoft Entra ID Entity Analytics, and Okta Entity Analytics for more details.
Interact with the table to filter data and view more details:
- Select the Risk level dropdown to filter the table by the selected user, host, or service risk level.
- Select the Criticality dropdown to filter the table by the selected asset criticality level.
- Select the Source dropdown to filter the table by the data source.
- Click the View details icon (
 ) to open the entity details flyout.
Anomaly detection jobs identify suspicious or irregular behavior patterns. The Anomalies table displays the total number of anomalies identified by these prebuilt machine learning jobs (named in the Anomaly name column).
To display anomaly results, you must install and run one or more prebuilt anomaly detection jobs. You cannot add custom anomaly detection jobs to the Entity Analytics dashboard.

Interact with the table to view more details:
- Click View all host anomalies to go to the Anomalies table on the Hosts page.
- Click View all user anomalies to go to the Anomalies table on the Users page.
- Click View all to display and manage all machine learning jobs on the Anomaly Detection Jobs page.
To learn more about machine learning, refer to What is Elastic machine learning?