Dashboards
Elastic Stack Serverless Security
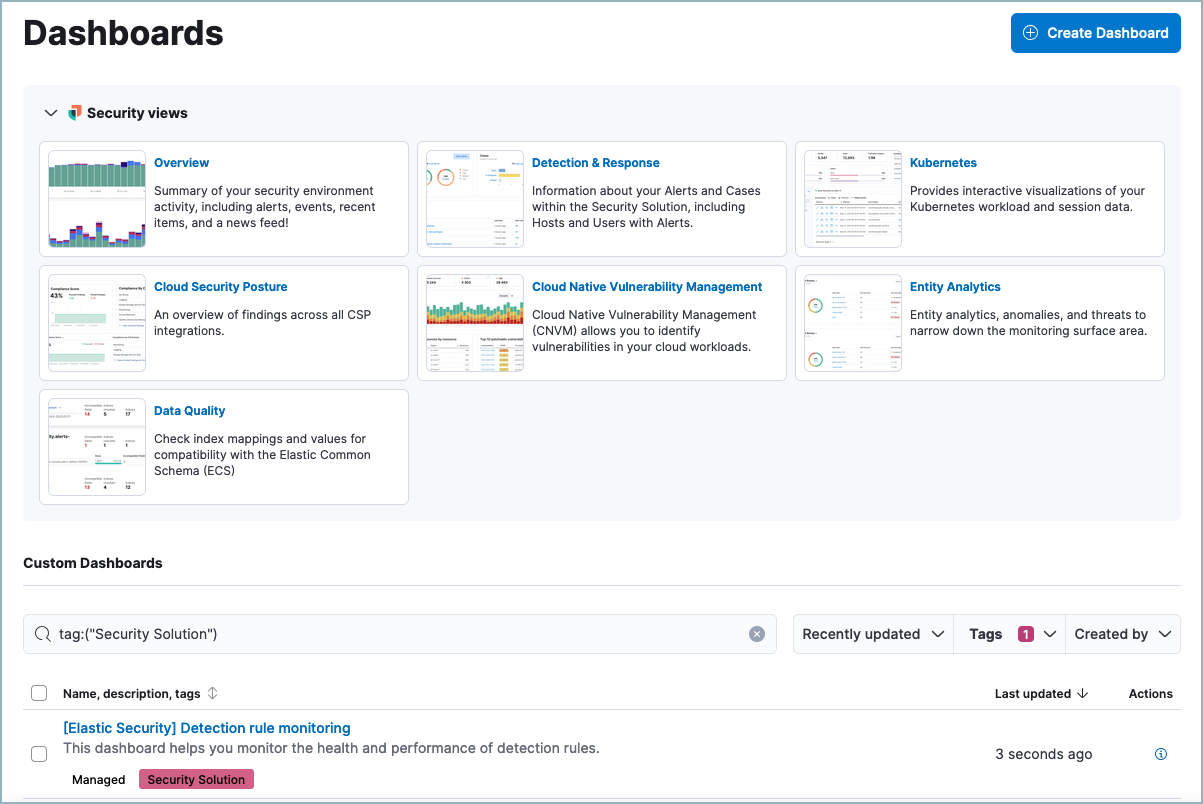
The Elastic Security app's default dashboards provide useful visualizations of your security environment. To view them in Elastic Security, select Dashboards from the navigation menu. From the Dashboards page, you can access the default dashboards, as well as create and access custom dashboards.
To create a new custom dashboard, click Create Dashboard. You can control which custom dashboards appear in the table:
- Use the text search field to filter by name or description.
- Use the Tags menu to filter by tag.
- Click a custom dashboard’s tags to toggle filtering for each tag.
To create a new tag or edit existing tags, open the Tags menu and click Manage tags.
Refer to documentation for the other Elastic Security dashboards to learn more about them. For more information about creating custom dashboards, refer to Create your first Kibana dashboard.