- Elastic Cloud Serverless
- Elasticsearch
- Elastic Observability
- Get started
- Observability overview
- Elastic Observability Serverless billing dimensions
- Create an Observability project
- Quickstart: Monitor hosts with Elastic Agent
- Quickstart: Monitor your Kubernetes cluster with Elastic Agent
- Quickstart: Monitor hosts with OpenTelemetry
- Quickstart: Unified Kubernetes Observability with Elastic Distributions of OpenTelemetry (EDOT)
- Quickstart: Collect data with AWS Firehose
- Quickstart: Send data to the Elastic Cloud Managed OTLP Endpoint
- Get started with dashboards
- Applications and services
- Application performance monitoring (APM)
- Get started with traces and APM
- Learn about data types
- Collect application data
- View and analyze data
- Act on data
- Use APM securely
- Reduce storage
- Managed intake service event API
- Troubleshooting
- Synthetic monitoring
- Get started
- Scripting browser monitors
- Configure lightweight monitors
- Manage monitors
- Work with params and secrets
- Analyze monitor data
- Monitor resources on private networks
- Use the CLI
- Configure a Synthetics project
- Multifactor Authentication for browser monitors
- Configure Synthetics settings
- Grant users access to secured resources
- Manage data retention
- Scale and architect a deployment
- Synthetics Encryption and Security
- Troubleshooting
- Visualize OTLP data
- Application performance monitoring (APM)
- Infrastructure and hosts
- Logs
- Inventory
- Incident management
- Data set quality
- Observability AI Assistant
- Machine learning
- Reference
- Get started
- Elastic Security
- Elastic Security overview
- Security billing dimensions
- Create a Security project
- Elastic Security requirements
- Elastic Security UI
- AI for Security
- Ingest data
- Configure endpoint protection with Elastic Defend
- Manage Elastic Defend
- Endpoints
- Policies
- Trusted applications
- Event filters
- Host isolation exceptions
- Blocklist
- Optimize Elastic Defend
- Event capture and Elastic Defend
- Endpoint protection rules
- Identify antivirus software on your hosts
- Allowlist Elastic Endpoint in third-party antivirus apps
- Elastic Endpoint self-protection features
- Elastic Endpoint command reference
- Endpoint response actions
- Cloud Security
- Explore your data
- Dashboards
- Detection engine overview
- Rules
- Alerts
- Advanced Entity Analytics
- Investigation tools
- Asset management
- Manage settings
- Troubleshooting
- Manage your project
- Changelog
Detect metric anomalies
editDetect metric anomalies
editRequired role
The Editor role or higher is required to create machine learning jobs. To learn more, refer to Assign user roles and privileges.
You can create machine learning jobs to detect and inspect memory usage and network traffic anomalies for hosts and Kubernetes pods.
You can model system memory usage, along with inbound and outbound network traffic across hosts or pods. You can detect unusual increases in memory usage and unusually high inbound or outbound traffic across hosts or pods.
Enable machine learning jobs for hosts or Kubernetes pods
editCreate a machine learning job to detect anomalous memory usage and network traffic automatically.
After creating machine learning jobs, you cannot change the settings. You can recreate these jobs later. However, you will remove any previously detected anomalies.
- In your Elastic Observability Serverless project, go to Infrastructure → Infrastructure inventory and click the Anomaly detection link at the top of the page.
- Under Hosts or Kubernetes Pods, click Enable to create a machine learning job.
- Choose a start date for the machine learning analysis. Machine learning jobs analyze the last four weeks of data and continue to run indefinitely.
- Select a partition field. Partitions allow you to create independent models for different groups of data that share similar behavior. For example, you may want to build separate models for machine type or cloud availability zone so that anomalies are not weighted equally across groups.
- By default, machine learning jobs analyze all of your metric data. You can filter this list to view only the jobs or metrics that you are interested in. For example, you can filter by job name and node name to view specific anomaly detection jobs for that host.
- Click Enable jobs.
- You’re now ready to explore your metric anomalies. Click Anomalies.
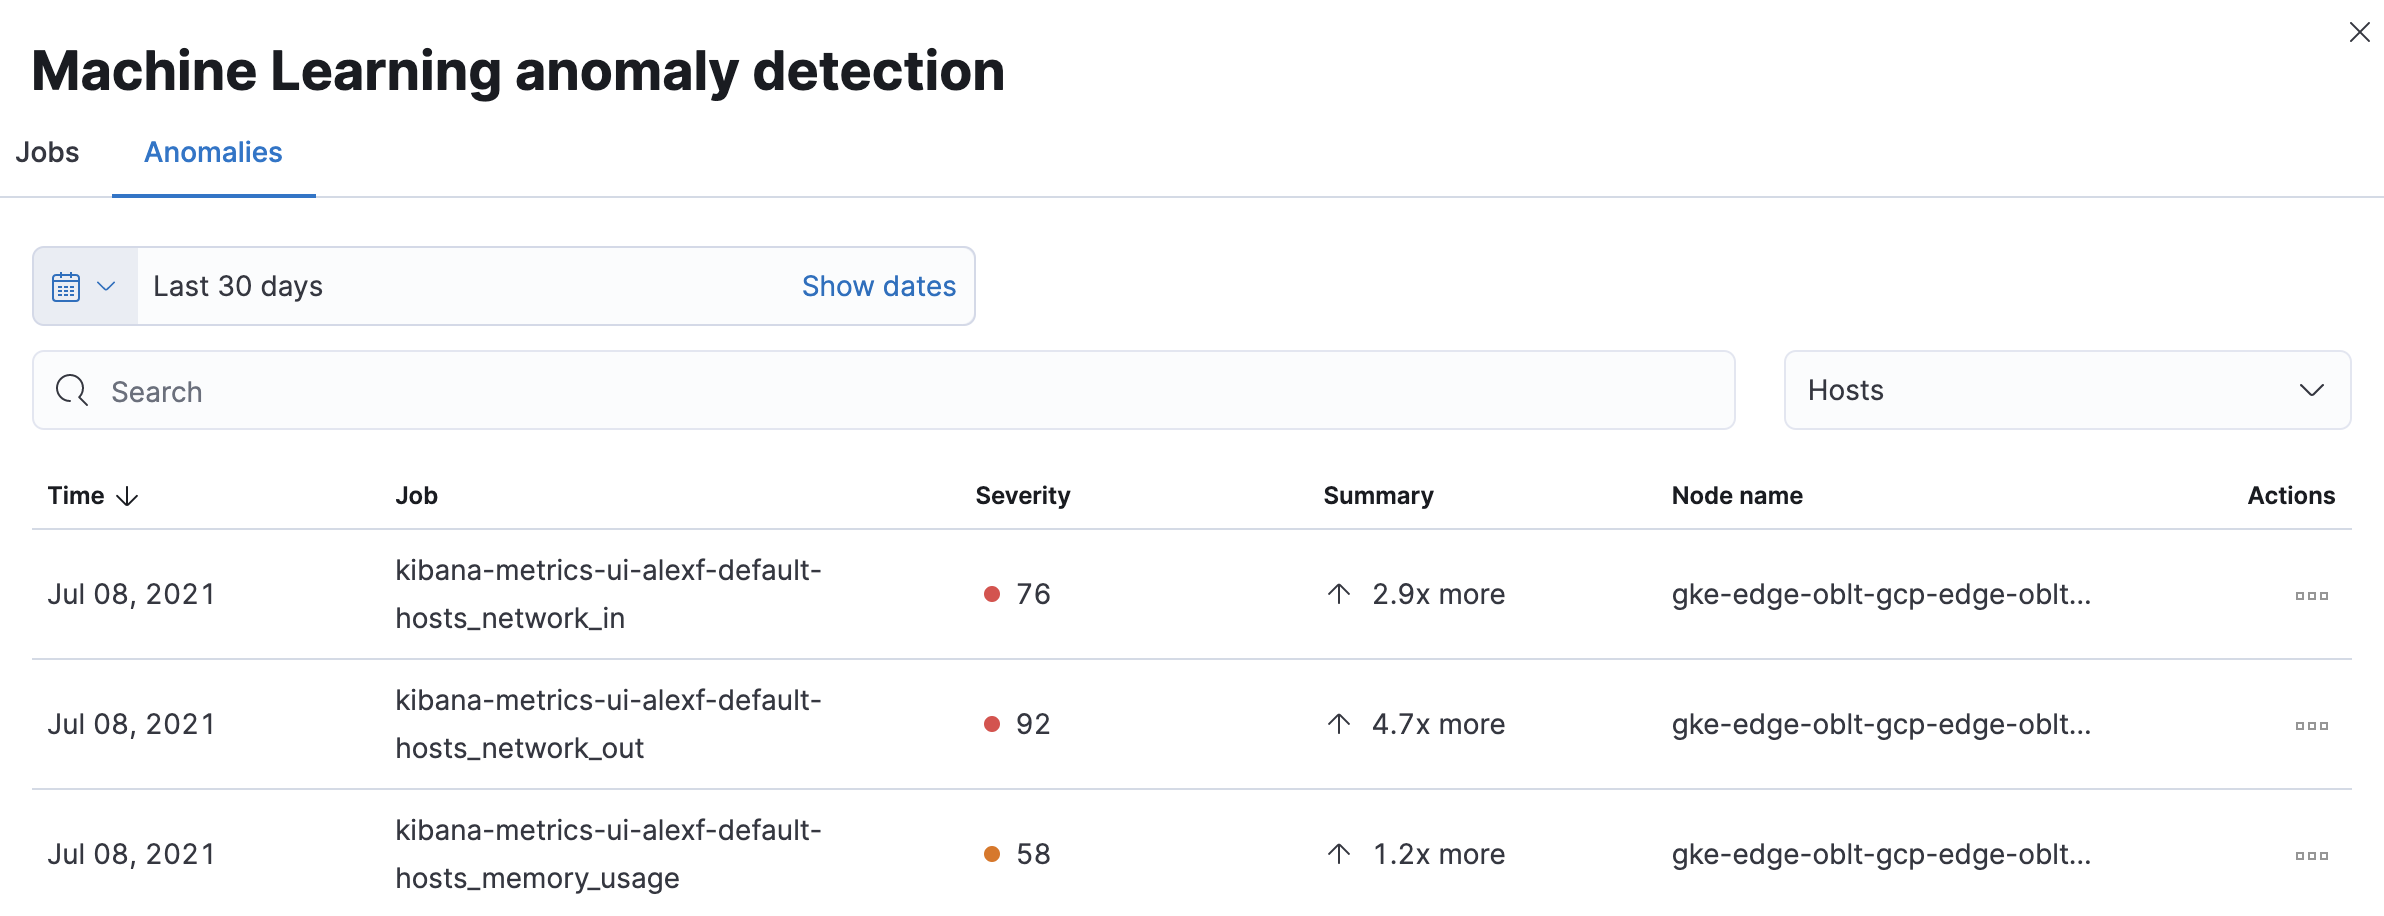
The Anomalies table displays a list of each single metric anomaly detection job for the specific host or Kubernetes pod. By default, anomaly jobs are sorted by time to show the most recent job.
Along with each anomaly job and the node name, detected anomalies with a severity score equal to 50 or higher are listed. These scores represent a severity of "warning" or higher in the selected time period. The summary value represents the increase between the actual value and the expected ("typical") value of the metric in the anomaly record result.
To drill down and analyze the metric anomaly, select Actions → Open in Anomaly Explorer to view the Anomaly Explorer. You can also select Actions → Show in Inventory to view the host or Kubernetes pods Inventory page, filtered by the specific metric.
These predefined anomaly detection jobs use custom rules. To update the rules in the Anomaly Explorer, select Actions → Configure rules. The changes only take effect for new results. If you want to apply the changes to existing results, clone and rerun the job.
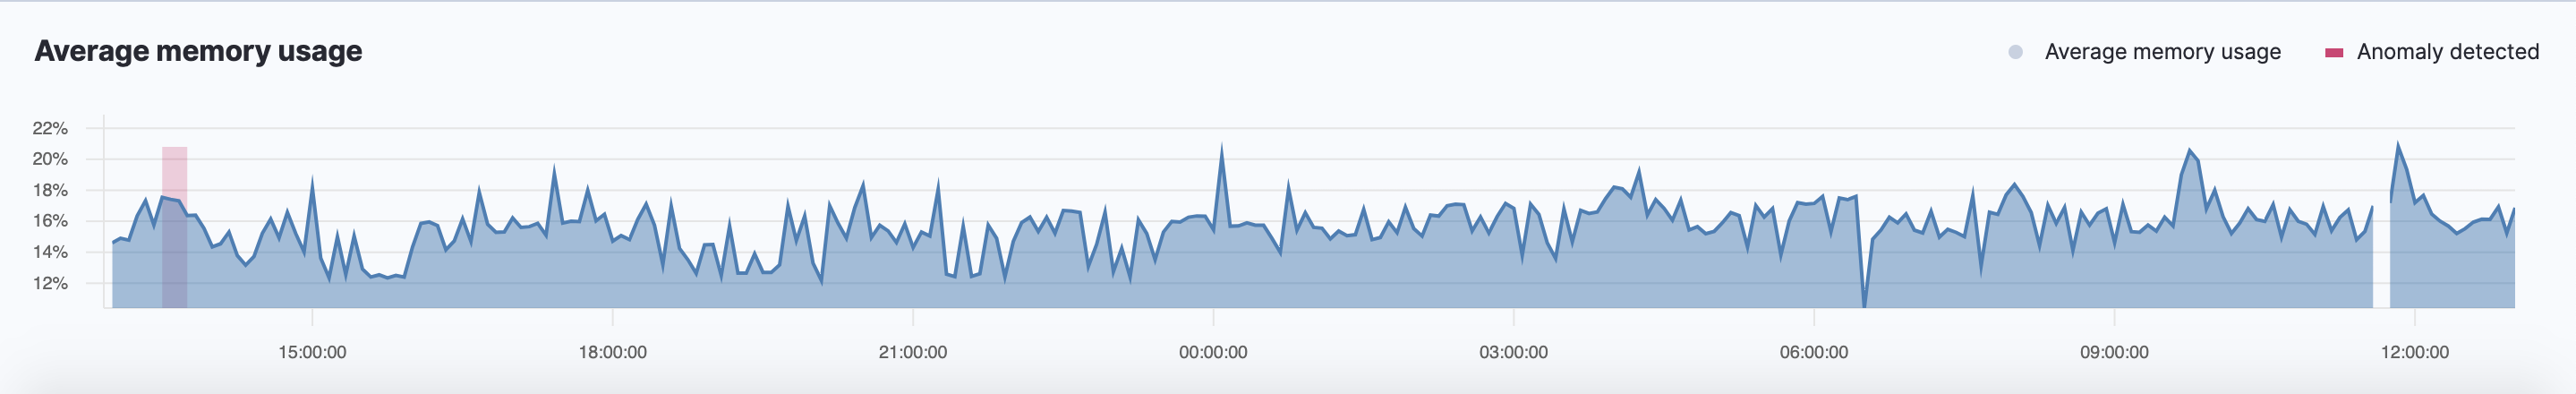
History chart
editOn the Infrastructure inventory page, click Show history to view the metric values within the selected time frame. Detected anomalies with an anomaly score equal to 50 or higher are highlighted in red. To examine the detected anomalies, use the Anomaly Explorer.