- Elastic Cloud Serverless
- Elasticsearch
- Elastic Observability
- Get started
- Observability overview
- Elastic Observability Serverless billing dimensions
- Create an Observability project
- Quickstart: Monitor hosts with Elastic Agent
- Quickstart: Monitor your Kubernetes cluster with Elastic Agent
- Quickstart: Monitor hosts with OpenTelemetry
- Quickstart: Unified Kubernetes Observability with Elastic Distributions of OpenTelemetry (EDOT)
- Quickstart: Collect data with AWS Firehose
- Quickstart: Send data to the Elastic Cloud Managed OTLP Endpoint
- Get started with dashboards
- Applications and services
- Application performance monitoring (APM)
- Get started with traces and APM
- Learn about data types
- Collect application data
- View and analyze data
- Act on data
- Use APM securely
- Reduce storage
- Managed intake service event API
- Troubleshooting
- Synthetic monitoring
- Get started
- Scripting browser monitors
- Configure lightweight monitors
- Manage monitors
- Work with params and secrets
- Analyze monitor data
- Monitor resources on private networks
- Use the CLI
- Configure a Synthetics project
- Multifactor Authentication for browser monitors
- Configure Synthetics settings
- Grant users access to secured resources
- Manage data retention
- Scale and architect a deployment
- Synthetics Encryption and Security
- Troubleshooting
- Visualize OTLP data
- Application performance monitoring (APM)
- Infrastructure and hosts
- Logs
- Inventory
- Incident management
- Data set quality
- Observability AI Assistant
- Machine learning
- Reference
- Get started
- Elastic Security
- Elastic Security overview
- Security billing dimensions
- Create a Security project
- Elastic Security requirements
- Elastic Security UI
- AI for Security
- Ingest data
- Configure endpoint protection with Elastic Defend
- Manage Elastic Defend
- Endpoints
- Policies
- Trusted applications
- Event filters
- Host isolation exceptions
- Blocklist
- Optimize Elastic Defend
- Event capture and Elastic Defend
- Endpoint protection rules
- Identify antivirus software on your hosts
- Allowlist Elastic Endpoint in third-party antivirus apps
- Elastic Endpoint self-protection features
- Elastic Endpoint command reference
- Endpoint response actions
- Cloud Security
- Explore your data
- Dashboards
- Detection engine overview
- Rules
- Alerts
- Advanced Entity Analytics
- Investigation tools
- Asset management
- Manage settings
- Troubleshooting
- Manage your project
- Changelog
Overview dashboard
editOverview dashboard
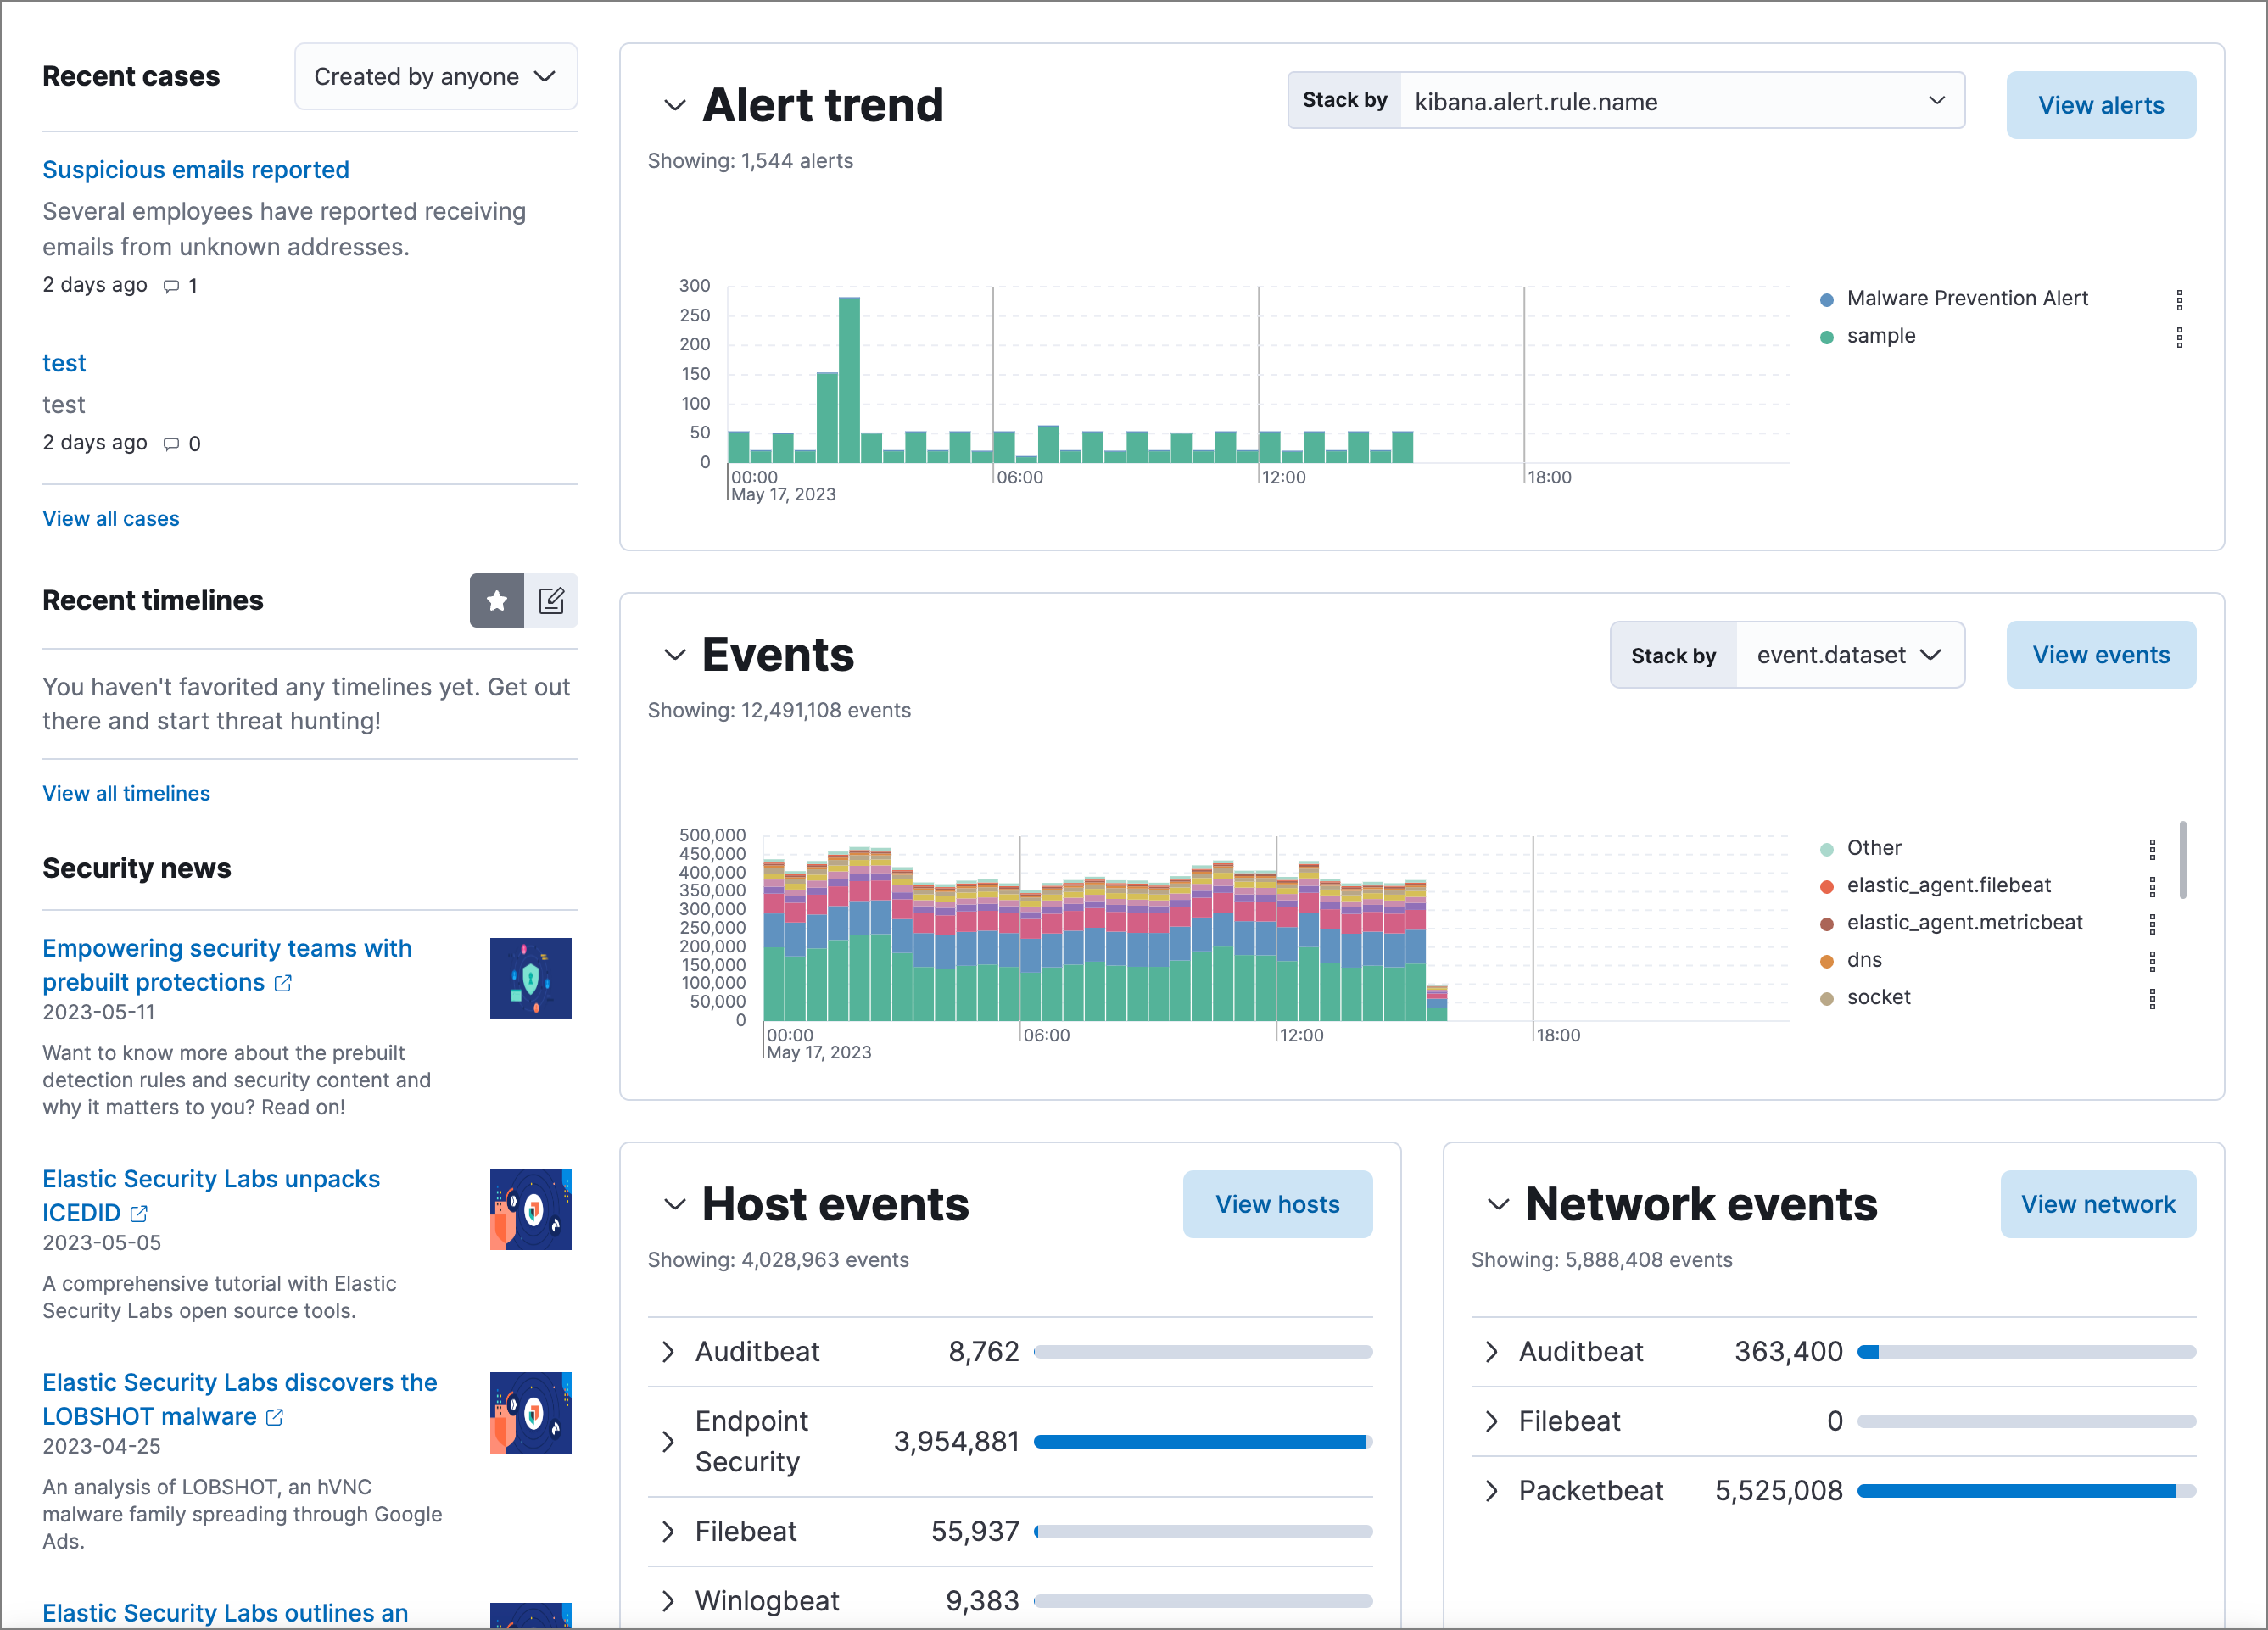
editThe Overview dashboard provides a high-level snapshot of alerts and events. It helps you assess overall system health and find anomalies that may require further investigation.
Live feed
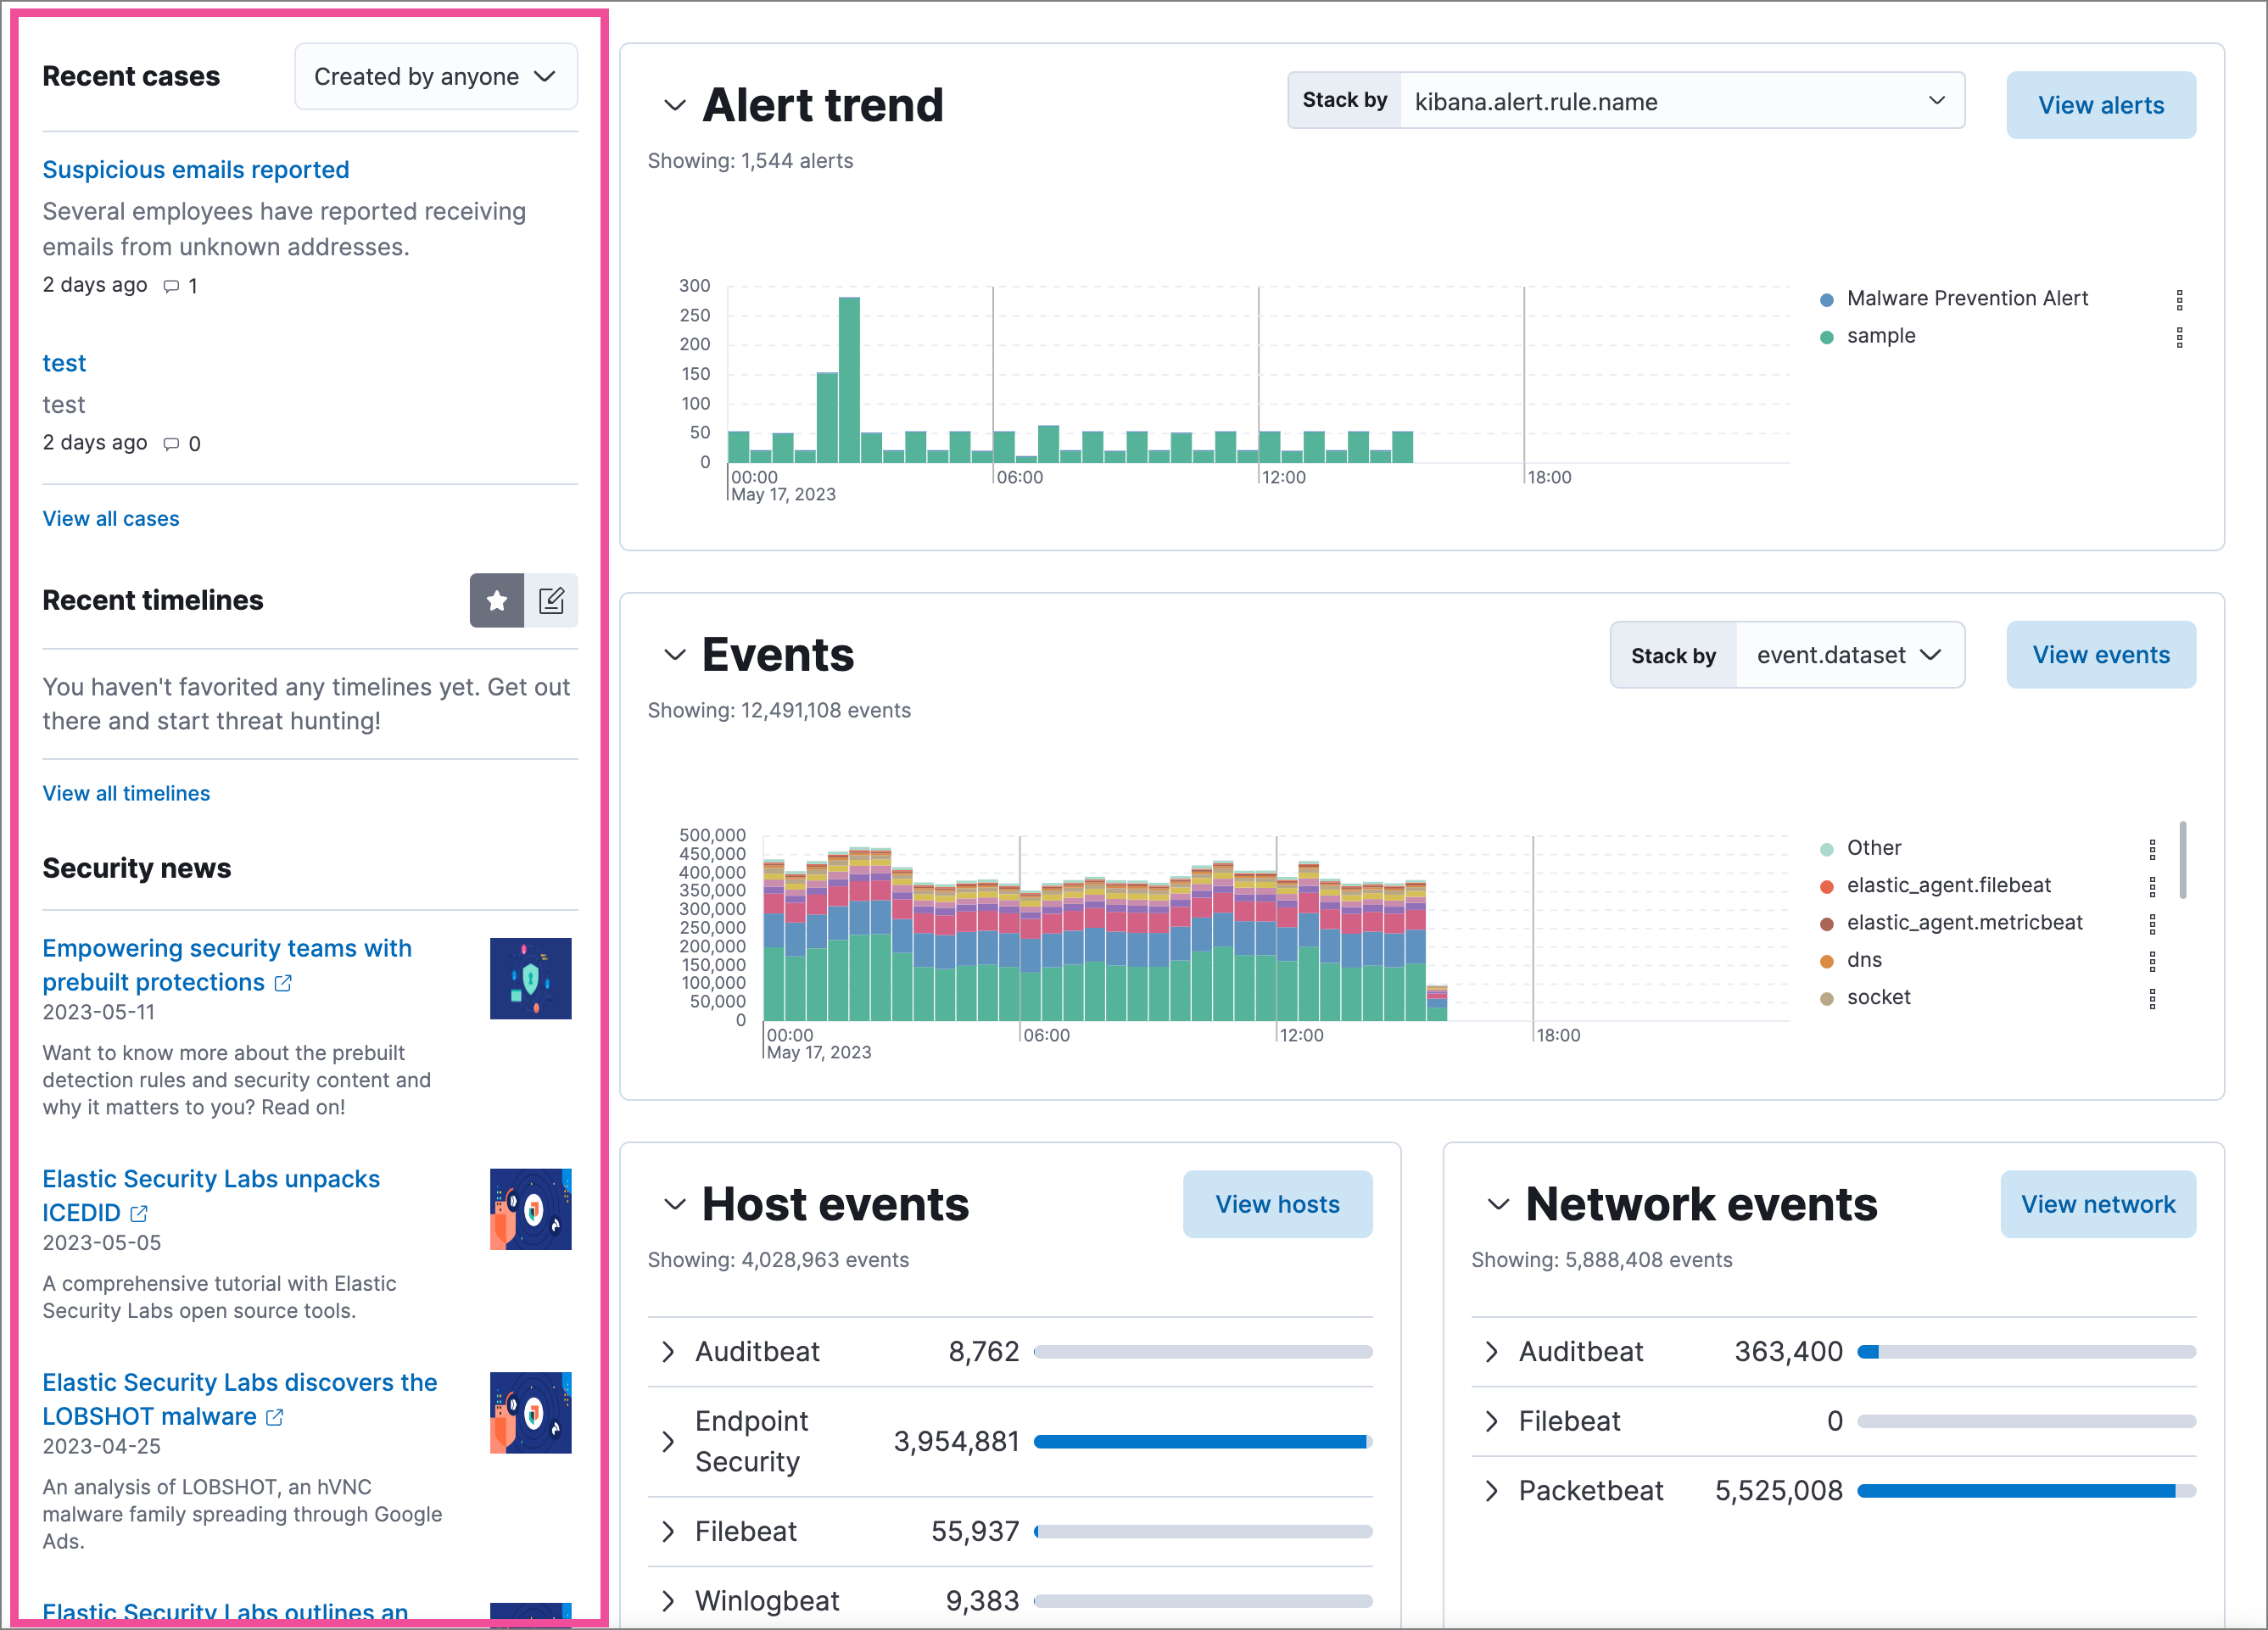
editThe live feed on the Overview dashboard helps you quickly access recently created cases, favorited Timelines, and the latest Elastic Security news.
The Security news section provides the latest Elastic Security news to help you stay informed of new developments, learn about Elastic Security features, and more.
Histograms
editTime-based histograms show the number of detections, alerts, and events that have occurred within the selected time range. To focus on a particular time, click and drag to select a time range, or choose a preset value. The Stack by menu lets you select which field is used to organize the data. For example, in the Alert trend histogram, stack by kibana.alert.rule.name
to display alert counts by rule name within the specified time frame.
Hover over histograms, graphs, and tables to display an Inspect button () or options menu (
). Click to inspect the visualization’s Elasticsearch queries, add it to a new or existing case, or open it in Lens for customization.
Host and network events
editView event and host counts grouped by data source, such as Auditbeat or Elastic Defend. Expand a category to view specific counts of host or network events from the selected source.

Threat Intelligence
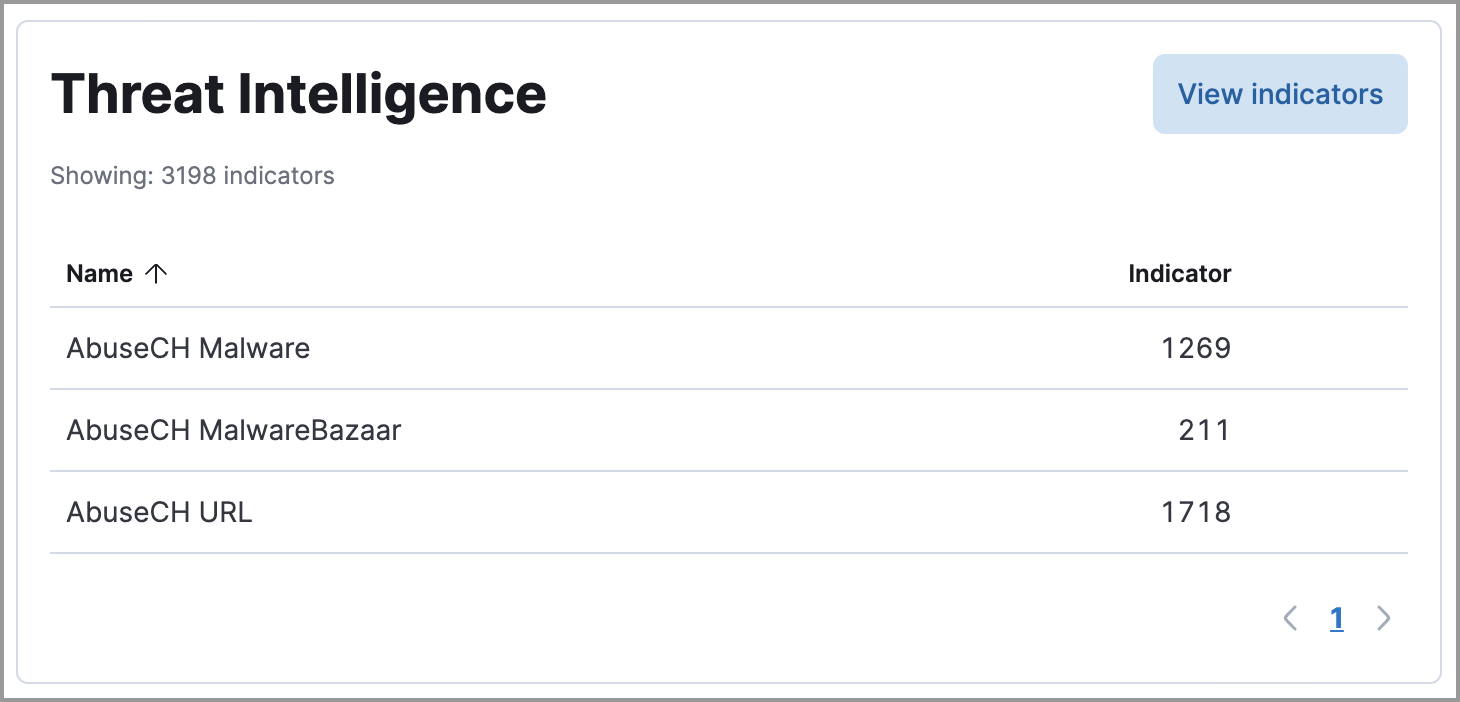
editThe Threat Intelligence view on the Overview dashboard provides streamlined threat intelligence data for threat detection and matching.
The view shows the total number of ingested threat indicators, enabled threat intelligence sources, and ingested threat indicators per source. To learn more about the ingested indicator data, click View indicators.
For more information about connecting to threat intelligence sources, visit Enable threat intelligence integrations.