- Elastic Cloud Serverless
- Elasticsearch
- Elastic Observability
- Get started
- Observability overview
- Elastic Observability Serverless billing dimensions
- Create an Observability project
- Quickstart: Monitor hosts with Elastic Agent
- Quickstart: Monitor your Kubernetes cluster with Elastic Agent
- Quickstart: Monitor hosts with OpenTelemetry
- Quickstart: Unified Kubernetes Observability with Elastic Distributions of OpenTelemetry (EDOT)
- Quickstart: Collect data with AWS Firehose
- Quickstart: Send data to the Elastic Cloud Managed OTLP Endpoint
- Get started with dashboards
- Applications and services
- Application performance monitoring (APM)
- Get started with traces and APM
- Learn about data types
- Collect application data
- View and analyze data
- Act on data
- Use APM securely
- Reduce storage
- Managed intake service event API
- Troubleshooting
- Synthetic monitoring
- Get started
- Scripting browser monitors
- Configure lightweight monitors
- Manage monitors
- Work with params and secrets
- Analyze monitor data
- Monitor resources on private networks
- Use the CLI
- Configure a Synthetics project
- Multifactor Authentication for browser monitors
- Configure Synthetics settings
- Grant users access to secured resources
- Manage data retention
- Scale and architect a deployment
- Synthetics Encryption and Security
- Troubleshooting
- Visualize OTLP data
- Application performance monitoring (APM)
- Infrastructure and hosts
- Logs
- Inventory
- Incident management
- Data set quality
- Observability AI Assistant
- Machine learning
- Reference
- Get started
- Elastic Security
- Elastic Security overview
- Security billing dimensions
- Create a Security project
- Elastic Security requirements
- Elastic Security UI
- AI for Security
- Ingest data
- Configure endpoint protection with Elastic Defend
- Manage Elastic Defend
- Endpoints
- Policies
- Trusted applications
- Event filters
- Host isolation exceptions
- Blocklist
- Optimize Elastic Defend
- Event capture and Elastic Defend
- Endpoint protection rules
- Identify antivirus software on your hosts
- Allowlist Elastic Endpoint in third-party antivirus apps
- Elastic Endpoint self-protection features
- Elastic Endpoint command reference
- Endpoint response actions
- Cloud Security
- Explore your data
- Dashboards
- Detection engine overview
- Rules
- Alerts
- Advanced Entity Analytics
- Investigation tools
- Asset management
- Manage settings
- Troubleshooting
- Manage your project
- Changelog
Alerting
editAlerting
editAlerting enables you to define rules, which detect complex conditions within different apps and trigger actions when those conditions are met. Alerting provides a set of built-in connectors and rules for you to use. This page describes all of these elements and how they operate together.
Important concepts
editAlerting works by running checks on a schedule to detect conditions defined by a rule. You can define rules at different levels (service, environment, transaction) or use custom KQL queries. When a condition is met, the rule tracks it as an alert and responds by triggering one or more actions.
Actions typically involve interaction with Elastic services or third-party integrations. Connectors enable actions to talk to these services and integrations.
Once you’ve defined your rules, you can monitor any alerts triggered by these rules in real time, with detailed dashboards that help you quickly identify and troubleshoot any issues that may arise. You can also extend your alerts with notifications via services or third-party incident management systems.
Alerts page
editOn the Alerts page, the Alerts table provides a snapshot of alerts occurring within the specified time frame. The table includes the alert status, when it was last updated, the reason for the alert, and more.
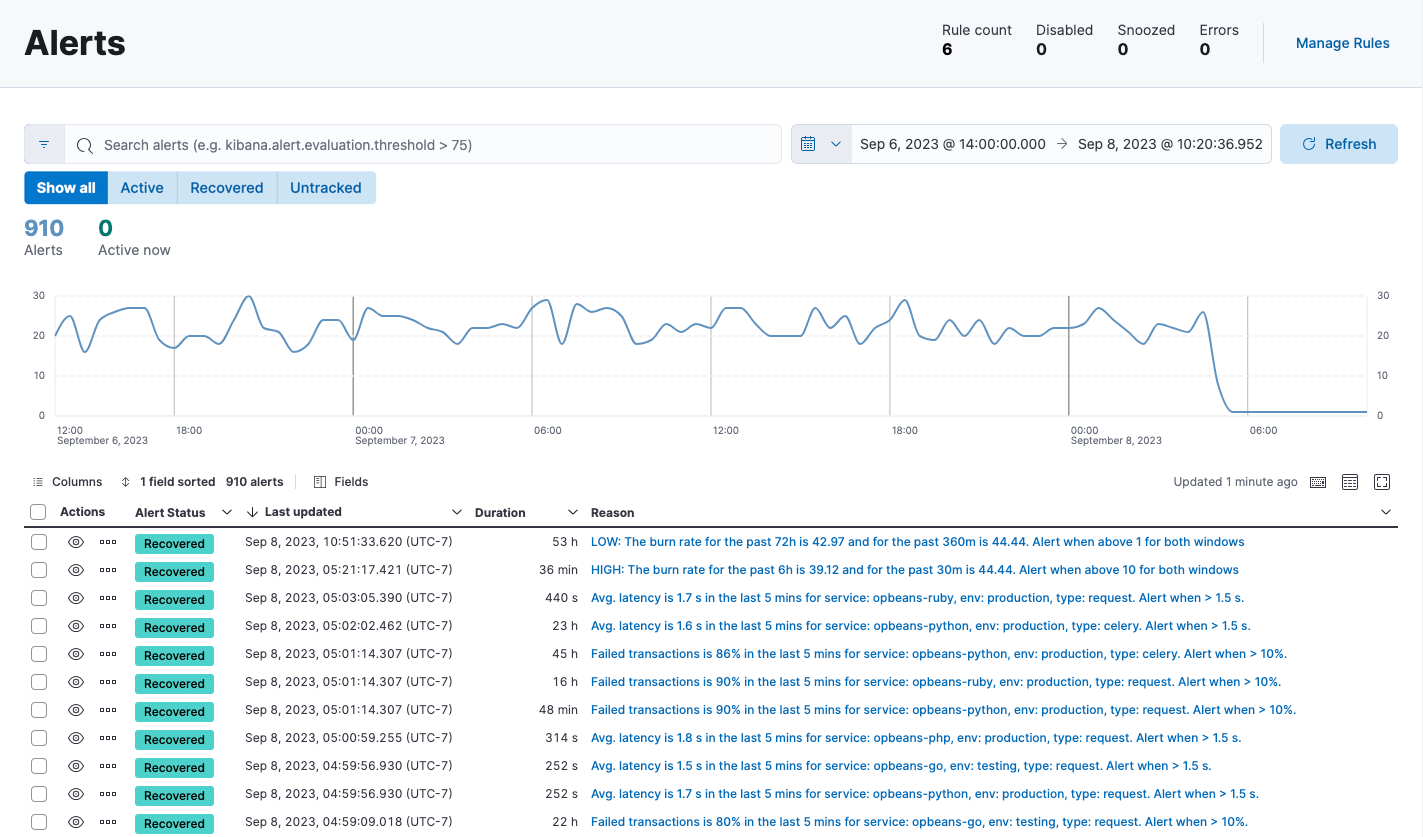
You can filter this table by alert status or time period, customize the visible columns, and search for specific alerts (for example, alerts related to a specific service or environment) using KQL. Select View alert detail from the More actions menu ![]() , or click the Reason link for any alert to view alert in detail, and you can then either View in app or View rule details.
, or click the Reason link for any alert to view alert in detail, and you can then either View in app or View rule details.
Next steps
editOn this page