- Elastic Cloud Serverless
- Elasticsearch
- Elastic Observability
- Get started
- Observability overview
- Elastic Observability Serverless billing dimensions
- Create an Observability project
- Quickstart: Monitor hosts with Elastic Agent
- Quickstart: Monitor your Kubernetes cluster with Elastic Agent
- Quickstart: Monitor hosts with OpenTelemetry
- Quickstart: Unified Kubernetes Observability with Elastic Distributions of OpenTelemetry (EDOT)
- Quickstart: Collect data with AWS Firehose
- Quickstart: Send data to the Elastic Cloud Managed OTLP Endpoint
- Get started with dashboards
- Applications and services
- Application performance monitoring (APM)
- Get started with traces and APM
- Learn about data types
- Collect application data
- View and analyze data
- Act on data
- Use APM securely
- Reduce storage
- Managed intake service event API
- Troubleshooting
- Synthetic monitoring
- Get started
- Scripting browser monitors
- Configure lightweight monitors
- Manage monitors
- Work with params and secrets
- Analyze monitor data
- Monitor resources on private networks
- Use the CLI
- Configure a Synthetics project
- Multifactor Authentication for browser monitors
- Configure Synthetics settings
- Grant users access to secured resources
- Manage data retention
- Scale and architect a deployment
- Synthetics Encryption and Security
- Troubleshooting
- Visualize OTLP data
- Application performance monitoring (APM)
- Infrastructure and hosts
- Logs
- Inventory
- Incident management
- Data set quality
- Observability AI Assistant
- Machine learning
- Reference
- Get started
- Elastic Security
- Elastic Security overview
- Security billing dimensions
- Create a Security project
- Elastic Security requirements
- Elastic Security UI
- AI for Security
- Ingest data
- Configure endpoint protection with Elastic Defend
- Manage Elastic Defend
- Endpoints
- Policies
- Trusted applications
- Event filters
- Host isolation exceptions
- Blocklist
- Optimize Elastic Defend
- Event capture and Elastic Defend
- Endpoint protection rules
- Identify antivirus software on your hosts
- Allowlist Elastic Endpoint in third-party antivirus apps
- Elastic Endpoint self-protection features
- Elastic Endpoint command reference
- Endpoint response actions
- Cloud Security
- Explore your data
- Dashboards
- Detection engine overview
- Rules
- Alerts
- Advanced Entity Analytics
- Investigation tools
- Asset management
- Manage settings
- Troubleshooting
- Manage your project
- Changelog
Create and manage rules
editCreate and manage rules
editRequired role
The Editor role or higher is required to create and manage rules for alerting. To learn more, refer to Assign user roles and privileges.
Alerting enables you to define rules, which detect complex conditions within different apps and trigger actions when those conditions are met. Alerting provides a set of built-in connectors and rules for you to use.
Observability rules
editLearn more about Observability rules and how to create them:
| Rule type | Name | Detects when… |
|---|---|---|
AIOps |
Anomalies match specific conditions. |
|
APM |
The latency, throughput, or failed transaction rate of a service is abnormal. |
|
Observability |
An Observability data type reaches or exceeds a given value. |
|
Stack |
Matches are found during the latest query run. |
|
APM |
The number of errors in a service exceeds a defined threshold. |
|
APM |
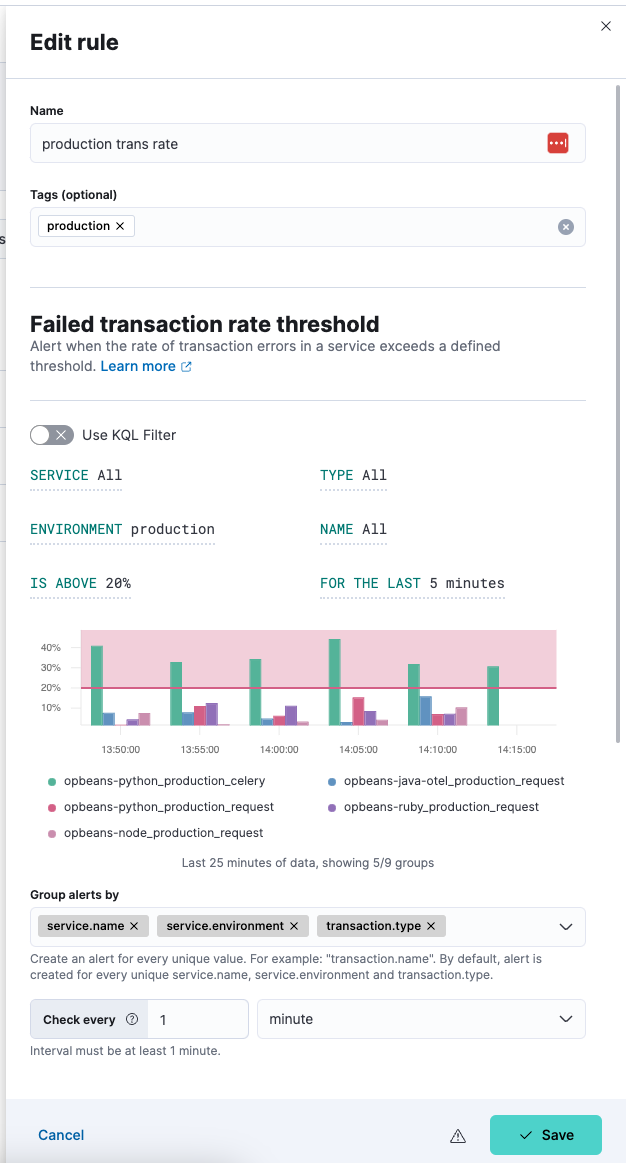
The rate of transaction errors in a service exceeds a defined threshold. |
|
Metrics |
The infrastructure inventory exceeds a defined threshold. |
|
APM |
The latency of a specific transaction type in a service exceeds a defined threshold. |
|
SLO |
The burn rate is above a defined threshold. |
Creating rules and alerts
editYou start by defining the rule and how often it should be evaluated. You can extend these rules by adding an appropriate action (for example, send an email or create an issue) to be triggered when the rule conditions are met. These actions are defined within each rule and implemented by the appropriate connector for that action e.g. Slack, Jira. You can create any rules from scratch using the Manage Rules page, or you can create specific rule types from their respective UIs and benefit from some of the details being pre-filled (for example, Name and Tags).
- For APM alert types, you can select Alerts and rules and create rules directly from the Services, Traces, and Dependencies UIs.
-
For SLO alert types, from the SLOs page open the More actions menu
 for an SLO and select Create new alert rule. Alternatively, when you create a new SLO, the Create new SLO burn rate alert rule checkbox is enabled by default and will prompt you to Create SLO burn rate rule upon saving the SLO.
After a rule is created, you can open the More actions menu ![]() and select Edit rule to check or change the definition, and/or add or modify actions.
and select Edit rule to check or change the definition, and/or add or modify actions.
From the action menu you can also:
- Disable or delete rule
- Clone rule
- Snooze rule notifications
- Run rule (without waiting for next scheduled check)
- Update API keys
View rule details
editClick on an individual rule on the Rules page to view details including the rule name, status, definition, execution history, related alerts, and more.
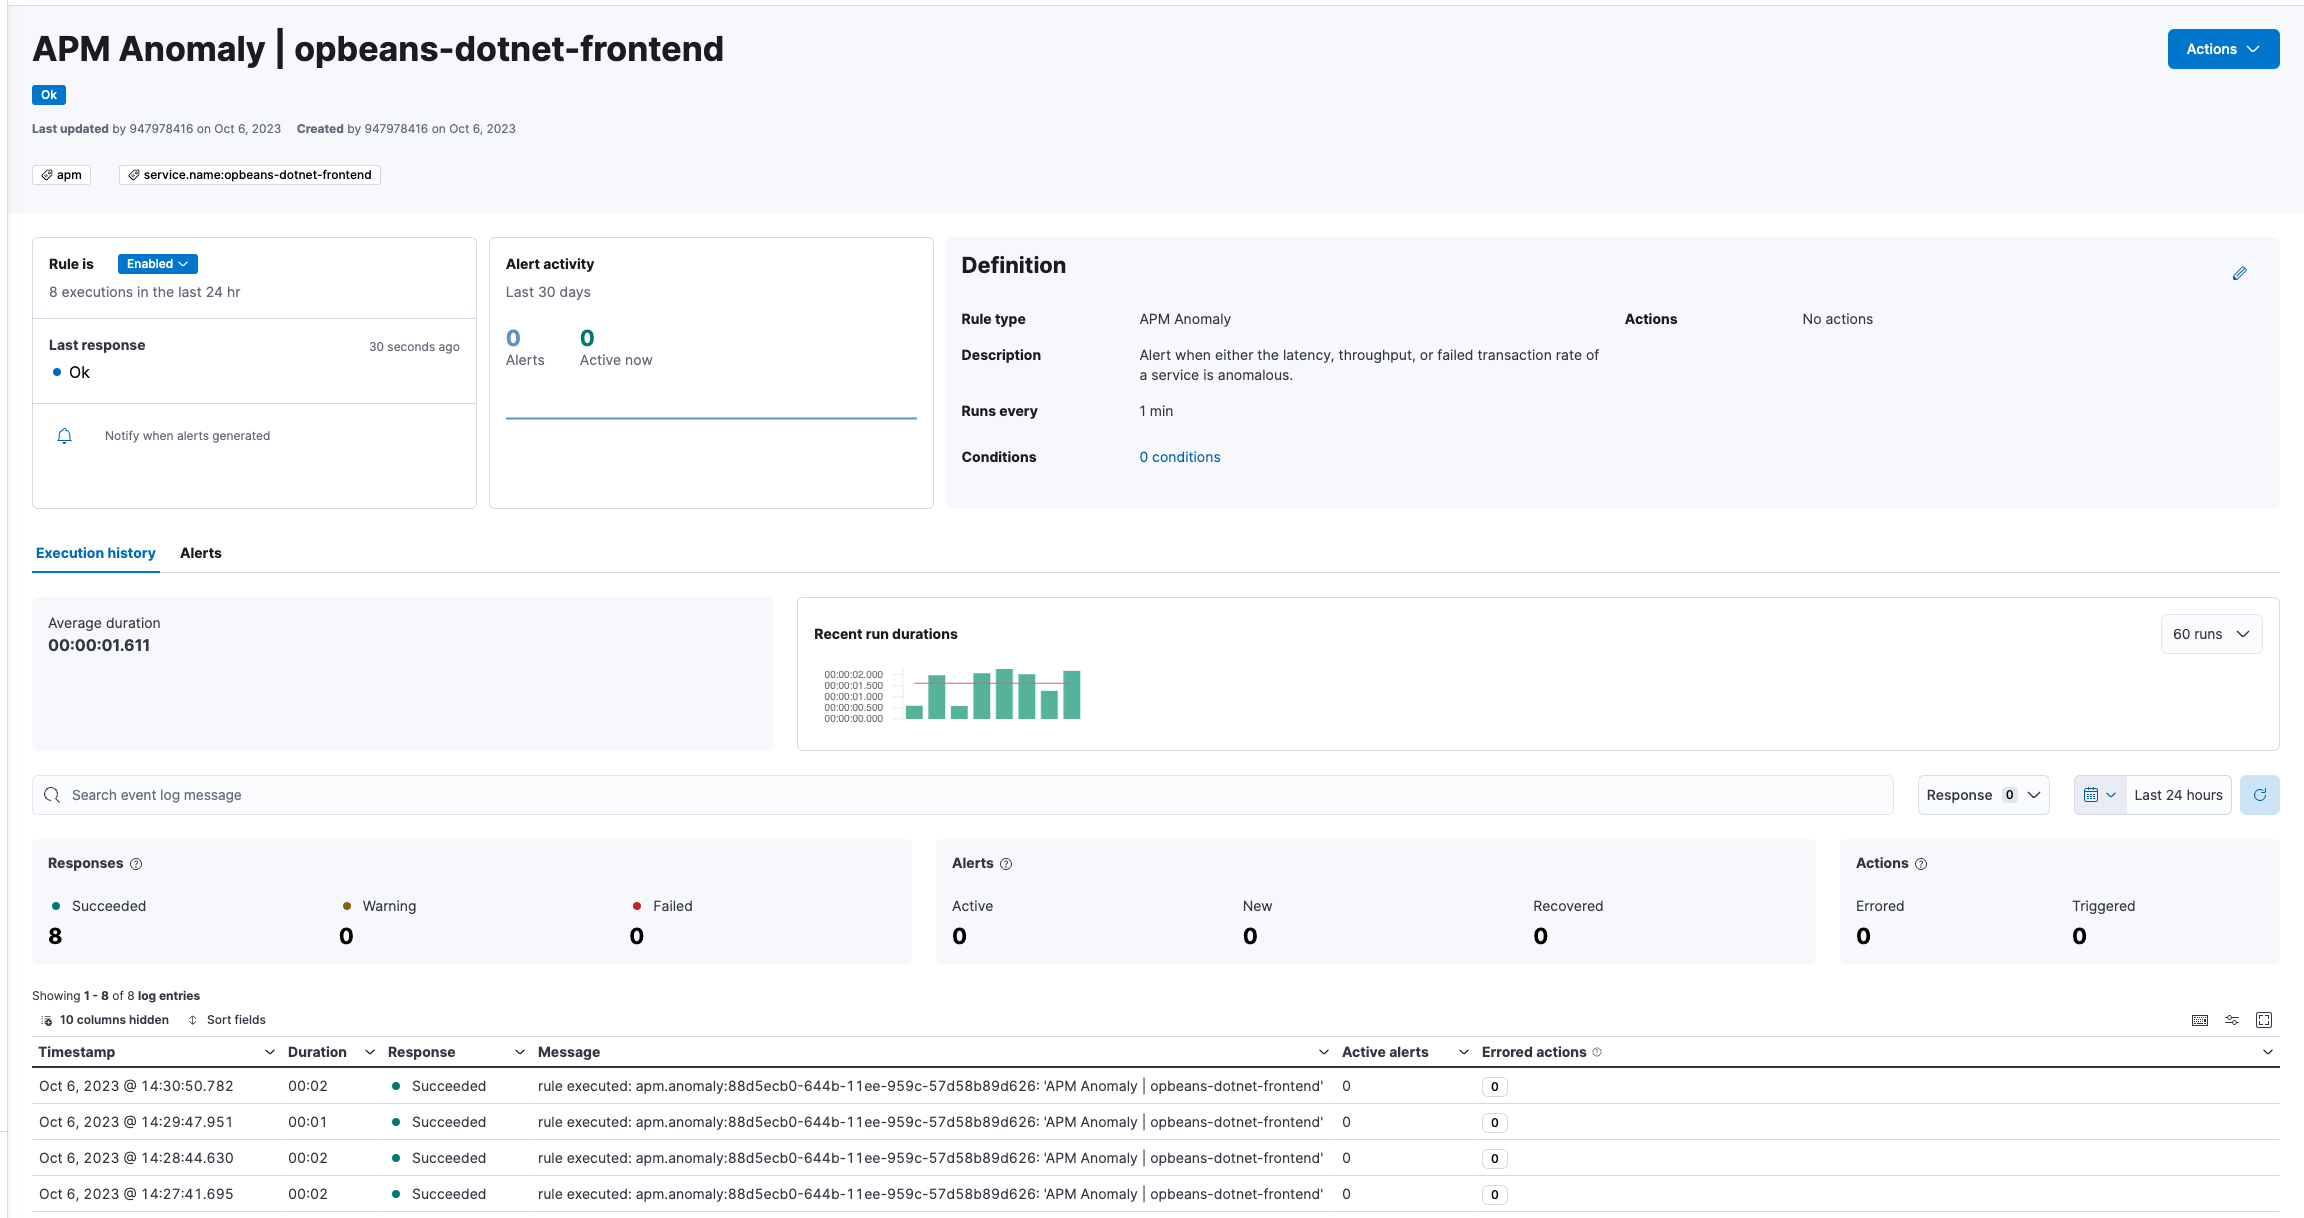
A rule can have one of the following responses:
-
failed - The rule ran with errors.
-
succeeded - The rule ran without errors.
-
warning - The rule ran with some non-critical errors.
Snooze and disable rules
editThe rule listing enables you to quickly snooze, disable, enable, or delete individual rules.
When you snooze a rule, the rule checks continue to run on a schedule but the alert will not trigger any actions. You can snooze for a specified period of time, indefinitely, or schedule single or recurring downtimes.
When a rule is in a snoozed state, you can cancel or change the duration of this state.
To temporarily suppress notifications for all rules, create a maintenance window.
Import and export rules
editTo import and export rules, use Saved Objects.
Rules are disabled on export. You are prompted to re-enable the rule on successful import.
On this page