- Elastic Cloud Serverless
- Elasticsearch
- Elastic Observability
- Get started
- Observability overview
- Elastic Observability Serverless billing dimensions
- Create an Observability project
- Quickstart: Monitor hosts with Elastic Agent
- Quickstart: Monitor your Kubernetes cluster with Elastic Agent
- Quickstart: Monitor hosts with OpenTelemetry
- Quickstart: Unified Kubernetes Observability with Elastic Distributions of OpenTelemetry (EDOT)
- Quickstart: Collect data with AWS Firehose
- Quickstart: Send data to the Elastic Cloud Managed OTLP Endpoint
- Get started with dashboards
- Applications and services
- Application performance monitoring (APM)
- Get started with traces and APM
- Learn about data types
- Collect application data
- View and analyze data
- Act on data
- Use APM securely
- Reduce storage
- Managed intake service event API
- Troubleshooting
- Synthetic monitoring
- Get started
- Scripting browser monitors
- Configure lightweight monitors
- Manage monitors
- Work with params and secrets
- Analyze monitor data
- Monitor resources on private networks
- Use the CLI
- Configure a Synthetics project
- Multifactor Authentication for browser monitors
- Configure Synthetics settings
- Grant users access to secured resources
- Manage data retention
- Scale and architect a deployment
- Synthetics Encryption and Security
- Troubleshooting
- Visualize OTLP data
- Application performance monitoring (APM)
- Infrastructure and hosts
- Logs
- Inventory
- Incident management
- Data set quality
- Observability AI Assistant
- Machine learning
- Reference
- Get started
- Elastic Security
- Elastic Security overview
- Security billing dimensions
- Create a Security project
- Elastic Security requirements
- Elastic Security UI
- AI for Security
- Ingest data
- Configure endpoint protection with Elastic Defend
- Manage Elastic Defend
- Endpoints
- Policies
- Trusted applications
- Event filters
- Host isolation exceptions
- Blocklist
- Optimize Elastic Defend
- Event capture and Elastic Defend
- Endpoint protection rules
- Identify antivirus software on your hosts
- Allowlist Elastic Endpoint in third-party antivirus apps
- Elastic Endpoint self-protection features
- Elastic Endpoint command reference
- Endpoint response actions
- Cloud Security
- Explore your data
- Dashboards
- Detection engine overview
- Rules
- Alerts
- Advanced Entity Analytics
- Investigation tools
- Asset management
- Manage settings
- Troubleshooting
- Manage your project
- Changelog
Forecast future behavior
editForecast future behavior
editRequired role
The Editor role or higher is required to create a forecast for an anomaly detection job. To learn more, refer to Assign user roles and privileges.
In addition to detecting anomalous behavior in your data, you can use the machine learning features to predict future behavior.
You can use a forecast to estimate a time series value at a specific future date. For example, you might want to determine how much disk usage to expect next Sunday at 09:00.
You can also use a forecast to estimate the probability of a time series value occurring at a future date. For example, you might want to determine how likely it is that your disk utilization will reach 100% before the end of next week.
To create a forecast:
- Create an anomaly detection job and view the results in the Single Metric Viewer.
- Click Forecast.
- Specify a duration for your forecast. This value indicates how far to extrapolate beyond the last record that was processed. You must use time units, for example 1w, 1d, 1h, and so on.
- Click Run.
-
View the forecast in the Single Metric Viewer:
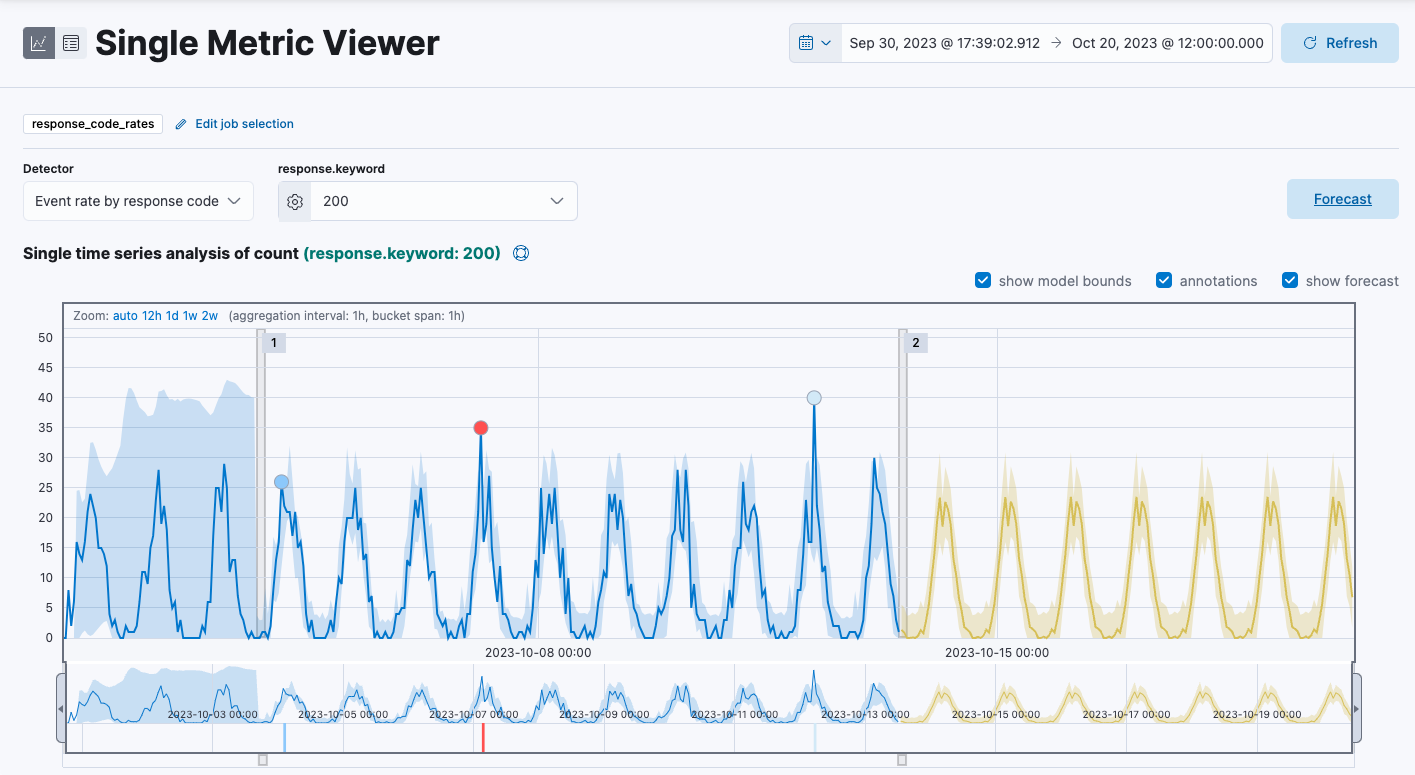
- The line in the chart represents the predicted data values.
- The shaded area represents the bounds for the predicted values, which also gives an indication of the confidence of the predictions.
- Note that the bounds generally increase with time (that is to say, the confidence levels decrease), since you are forecasting further into the future. Eventually if the confidence levels are too low, the forecast stops.
-
(Optional) After the job has processed more data, click the Forecast button again to compare the forecast to actual data.
The resulting chart will contain the actual data values, the bounds for the expected values, the anomalies, the forecast data values, and the bounds for the forecast. This combination of actual and forecast data gives you an indication of how well the machine learning features can extrapolate the future behavior of the data.