- Elastic Cloud Serverless
- Elasticsearch
- Elastic Observability
- Get started
- Observability overview
- Elastic Observability Serverless billing dimensions
- Create an Observability project
- Quickstart: Monitor hosts with Elastic Agent
- Quickstart: Monitor your Kubernetes cluster with Elastic Agent
- Quickstart: Monitor hosts with OpenTelemetry
- Quickstart: Unified Kubernetes Observability with Elastic Distributions of OpenTelemetry (EDOT)
- Quickstart: Collect data with AWS Firehose
- Get started with dashboards
- Applications and services
- Application performance monitoring (APM)
- Get started with traces and APM
- Learn about data types
- Collect application data
- View and analyze data
- Act on data
- Use APM securely
- Reduce storage
- Managed intake service event API
- Troubleshooting
- Synthetic monitoring
- Get started
- Scripting browser monitors
- Configure lightweight monitors
- Manage monitors
- Work with params and secrets
- Analyze monitor data
- Monitor resources on private networks
- Use the CLI
- Configure a Synthetics project
- Multifactor Authentication for browser monitors
- Configure Synthetics settings
- Grant users access to secured resources
- Manage data retention
- Scale and architect a deployment
- Synthetics Encryption and Security
- Troubleshooting
- Application performance monitoring (APM)
- Infrastructure and hosts
- Logs
- Inventory
- Incident management
- Data set quality
- Observability AI Assistant
- Machine learning
- Reference
- Get started
- Elastic Security
- Elastic Security overview
- Security billing dimensions
- Create a Security project
- Elastic Security requirements
- Elastic Security UI
- AI for Security
- Ingest data
- Configure endpoint protection with Elastic Defend
- Manage Elastic Defend
- Endpoints
- Policies
- Trusted applications
- Event filters
- Host isolation exceptions
- Blocklist
- Optimize Elastic Defend
- Event capture and Elastic Defend
- Endpoint protection rules
- Identify antivirus software on your hosts
- Allowlist Elastic Endpoint in third-party antivirus apps
- Elastic Endpoint self-protection features
- Elastic Endpoint command reference
- Endpoint response actions
- Cloud Security
- Explore your data
- Dashboards
- Detection engine overview
- Rules
- Alerts
- Advanced Entity Analytics
- Investigation tools
- Asset management
- Manage settings
- Troubleshooting
- Manage your project
- Changelog
Get started with dashboards
editGet started with dashboards
editElastic provides a wide range of pre-built dashboards for visualizing observability data from a variety of sources. These dashboards are loaded automatically when you install Elastic integrations.
You can also create new dashboards and visualizations based on your data views to get a full picture of your data.
In your Observability project, go to Dashboards to see installed dashboards or create your own. This example shows dashboards loaded by the System integration:

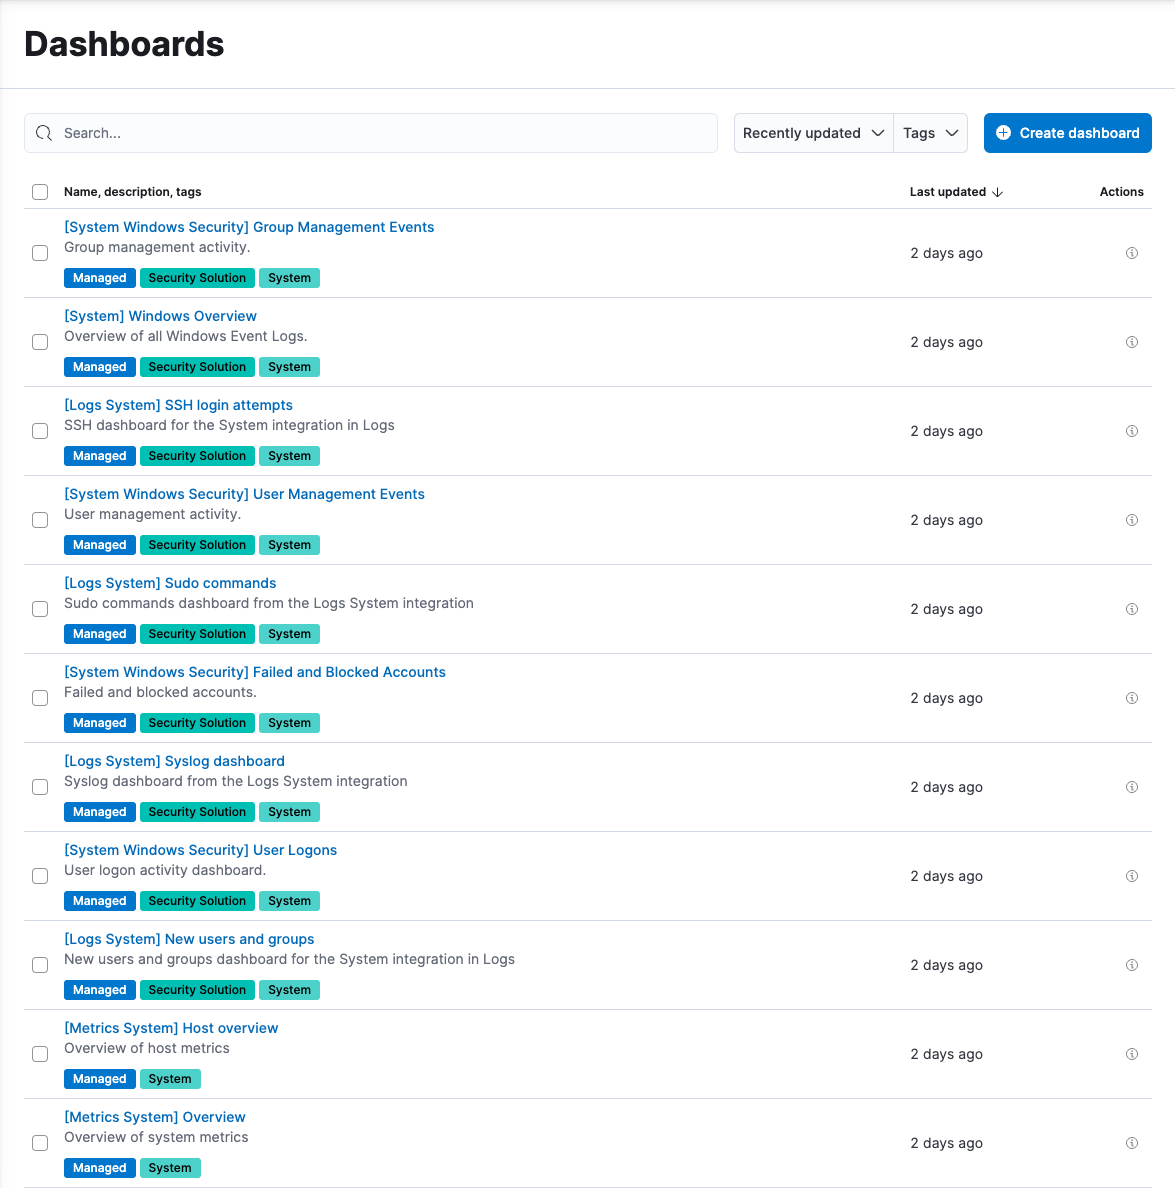
Notice you can filter the list of dashboards:
- Use the text search field to filter by name or description.
- Use the Tags menu to filter by tag. To create a new tag or edit existing tags, click Manage tags.
- Click a dashboard’s tags to toggle filtering for each tag.
Create new dashboards
editTo create a new dashboard, click Create Dashboard and begin adding visualizations. You can create charts, graphs, maps, tables, and other types of visualizations from your data, or you can add visualizations from the library.
You can also add other types of panels — such as filters, links, and text — and add controls like time sliders.
For more information about creating dashboards, refer to Create your first dashboard.
The tutorial about creating your first dashboard is written for Kibana users, but the steps for serverless are very similar. To load the sample data in serverless, go to Project Settings → Integrations in the navigation pane, then search for "sample data".
On this page