Get started with system metrics
Serverless Stack
In this guide you can learn how to onboard system metrics data from a machine or server using Fleet-managed Elastic Agent.
To get started quickly without Fleet, follow the steps described in the quickstarts. We recommend using the Elastic Distribution of OpenTelemetry Collector as the preferred way to collect system metrics and logs.
To follow the steps in this guide, you need an Elastic Stack deployment that includes:
- Elasticsearch for storing and searching data
- Kibana for visualizing and managing data
- Kibana user with
Allprivileges on Fleet and Integrations. Because many Integrations assets are shared across spaces, users need the Kibana privileges in all spaces. - Integrations Server (included by default in every Elastic Cloud Hosted deployment)
To get started quickly, create an Elastic Cloud Hosted deployment and host it on AWS, GCP, or Azure. Try it out for free.
The Admin role or higher is required to onboard system metrics data. To learn more, refer to Assign user roles and privileges.
Elastic Agent is a single, unified way to add monitoring for logs, metrics, and other types of data to a host. It can also protect hosts from security threats, query data from operating systems, forward data from remote services or hardware, and more. A single agent makes it easier and faster to deploy monitoring across your infrastructure. Each agent has a single policy you can update to add integrations for new data sources, security protections, and more.
In this step, add the System integration to monitor host logs and metrics.
Find Integrations in the main menu or use the global search field.
In the query bar, search for System and select the integration to see more details about it.
Select Add System.
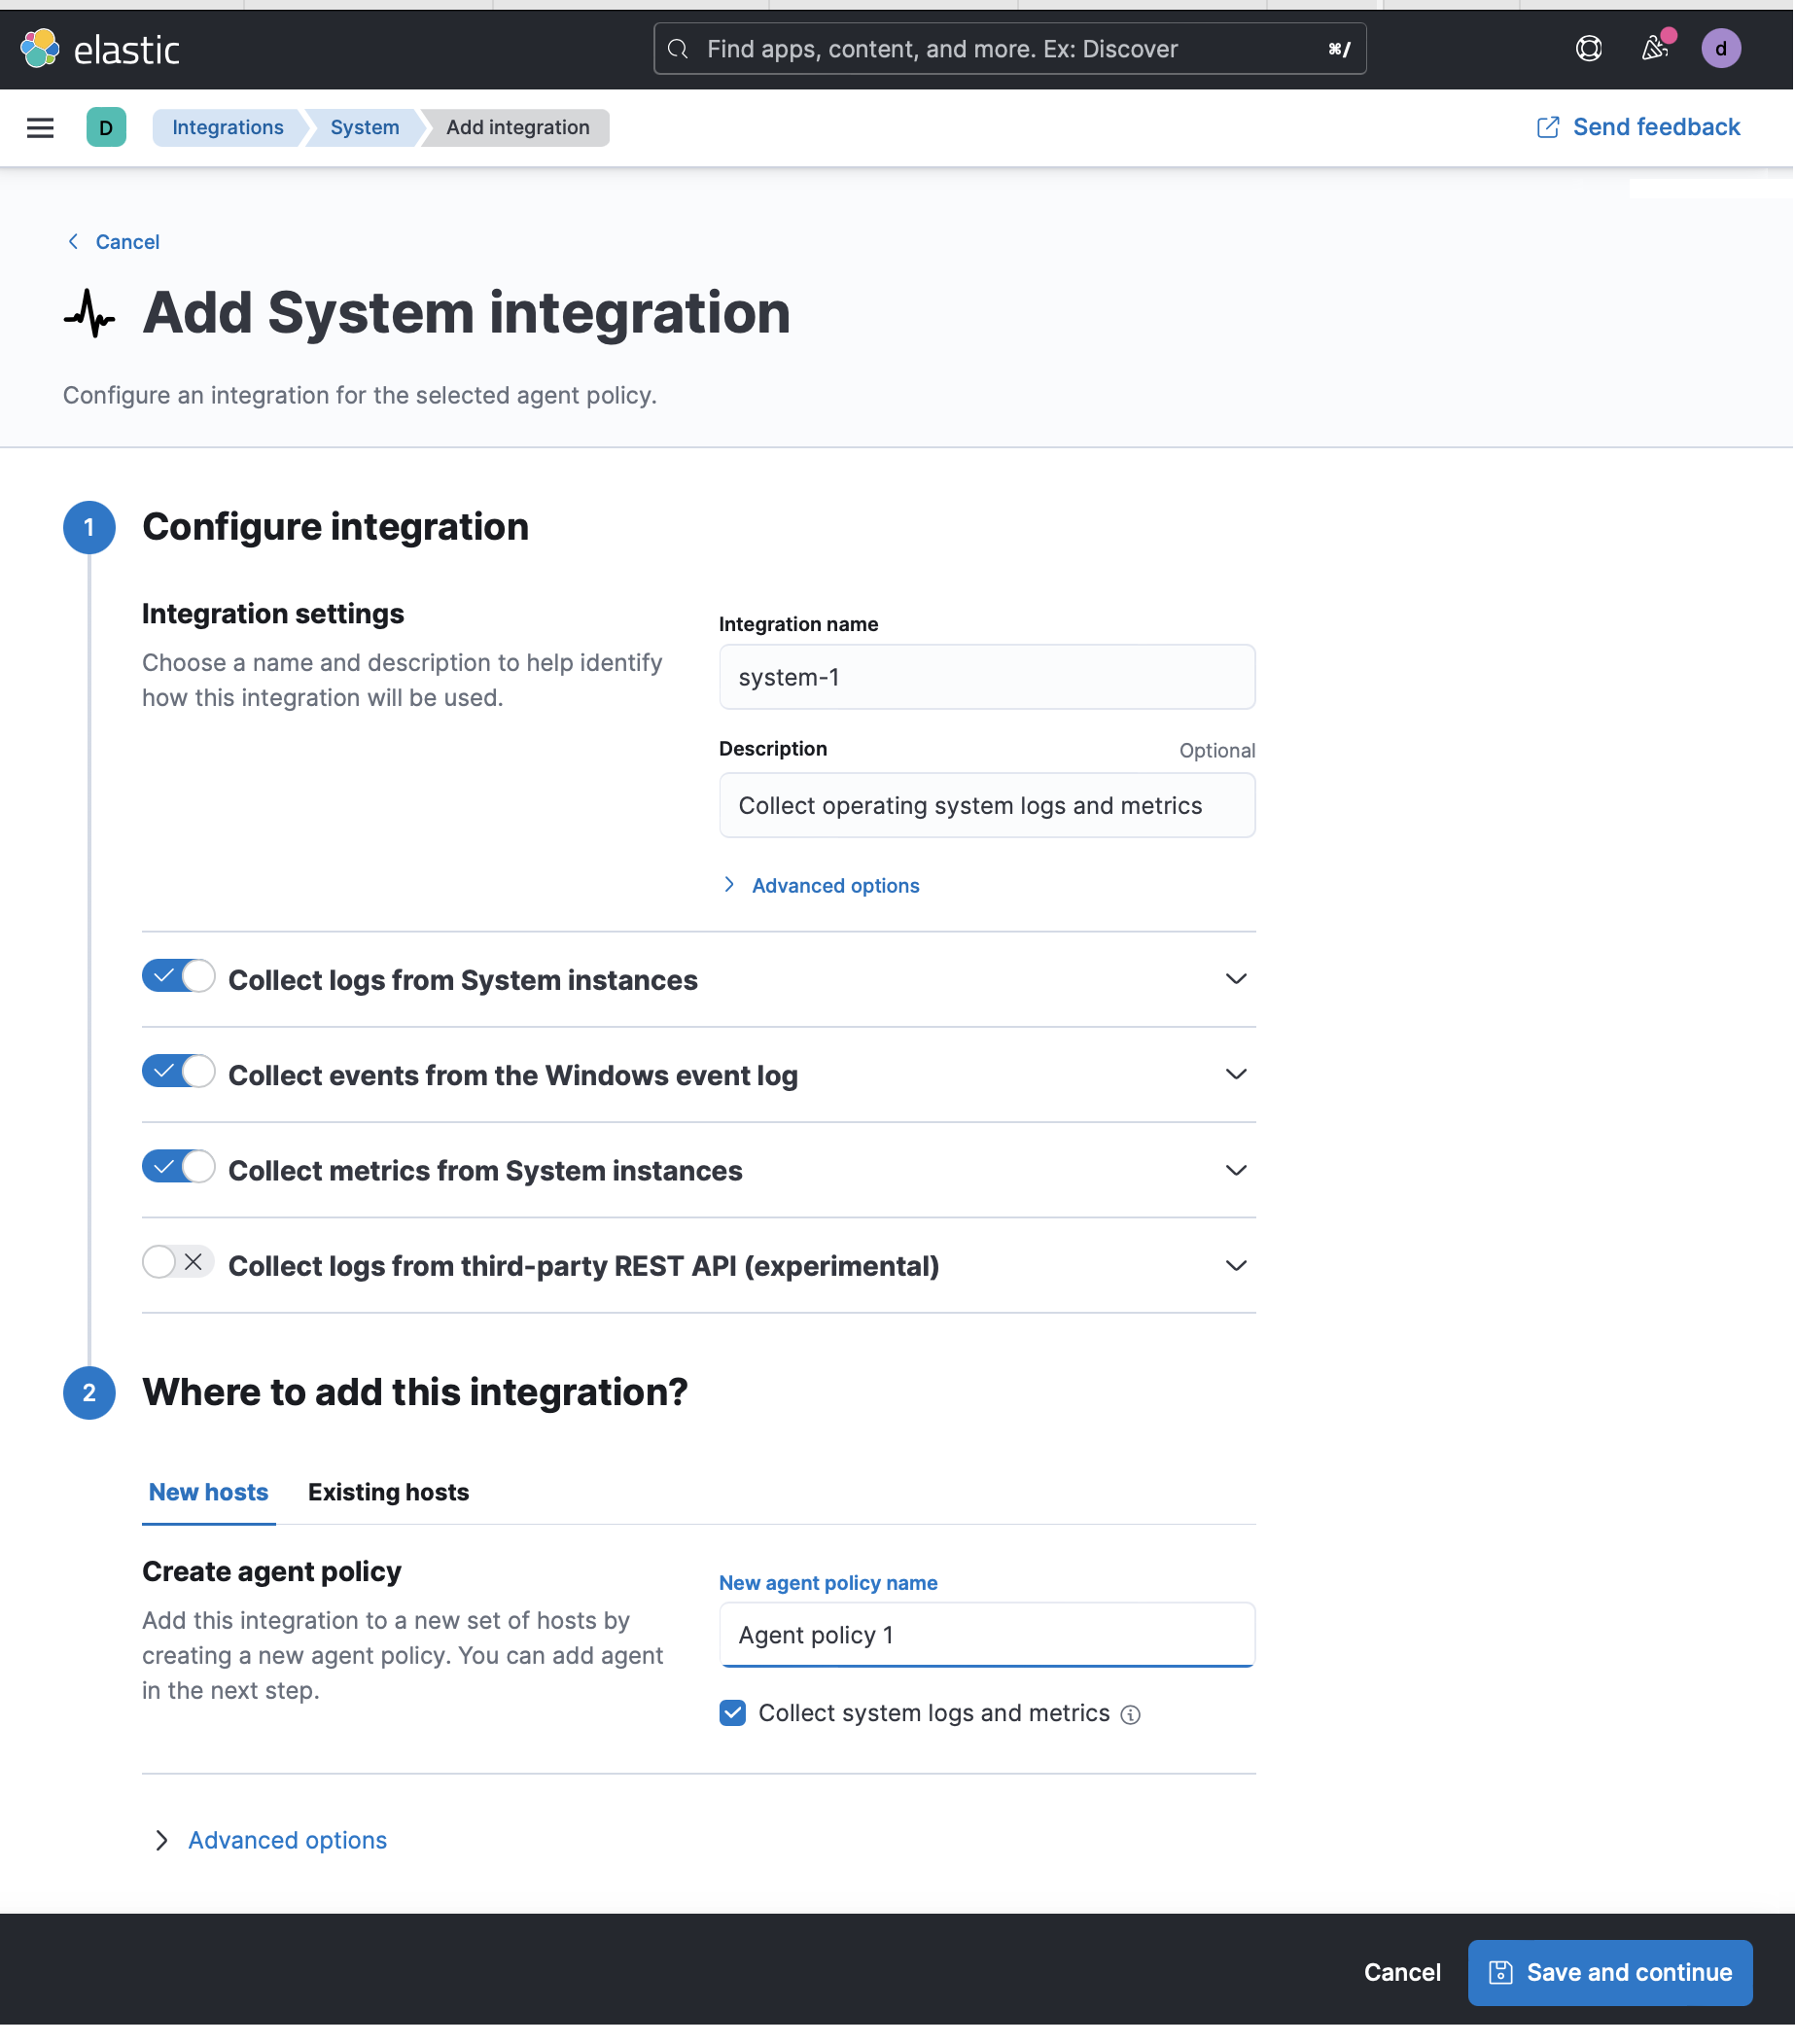
Configure the integration name and optionally add a description. Make sure that Collect logs from System instances and Collect metrics from System instances are turned on.
Expand each configuration section to verify that the settings are correct for your host. For example, if you're deploying Elastic Agent on macOS hosts, you need to add a new path to the System syslog logs section by clicking Add row and specifying
/var/log/system.log.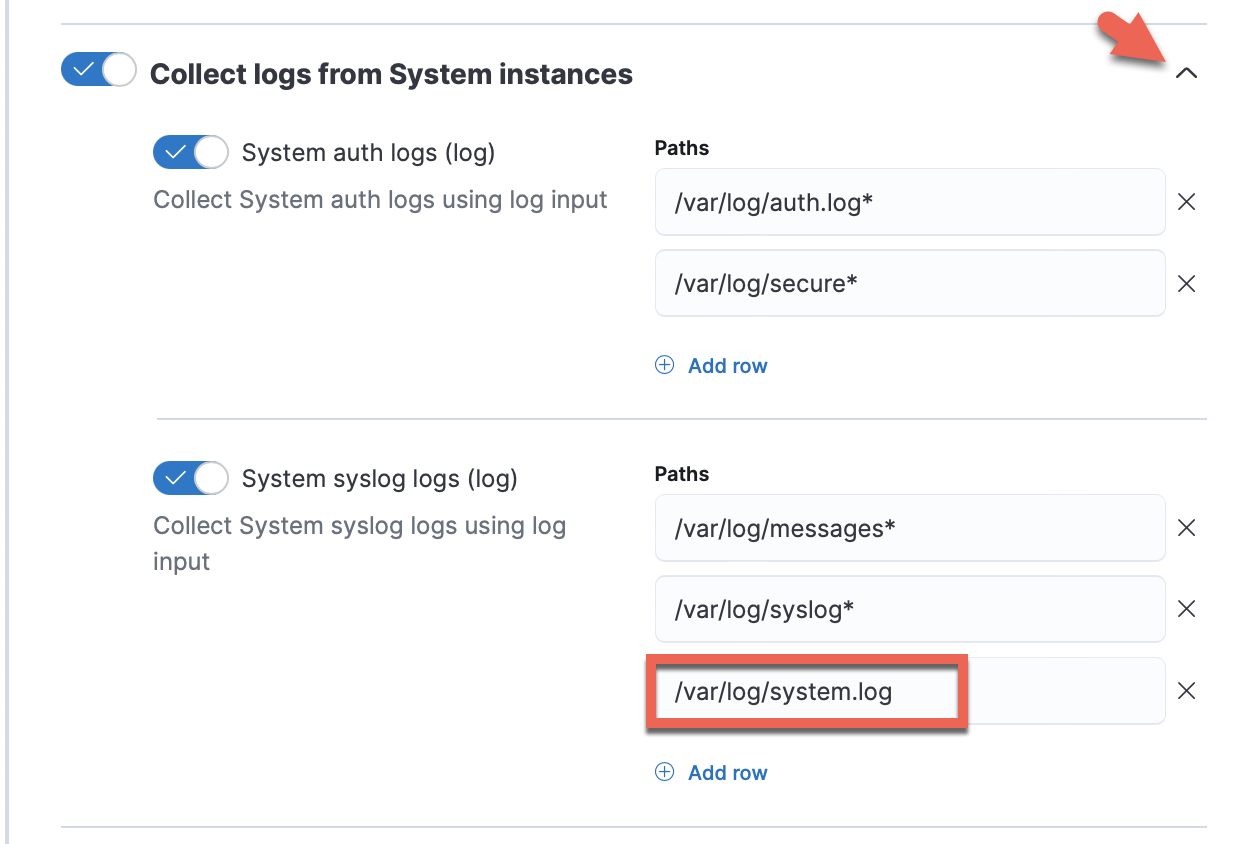
Select Save and continue. This step takes a minute or two to complete. When it's done, the new agent policy contains a system integration policy for the configuration you specified.
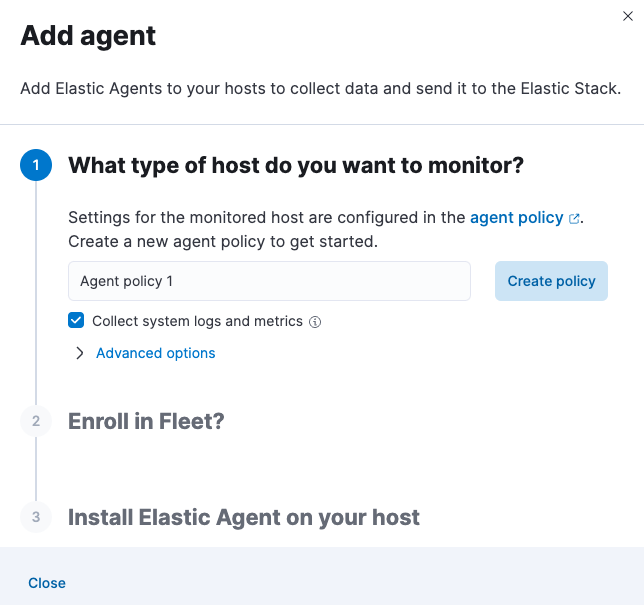
In the dialog, select Add Elastic Agent to your hosts to open the Add agent flyout.
TipIf you accidentally close the popup, go to Fleet > Agents, then select Add agent to access the flyout.
Create a new Elastic Observability Serverless project, or open an existing one.
In your Elastic Observability Serverless project, go to Project Settings → Integrations.
Enter System in the search bar, then select the integration to see more details about it.
Select Add System.
Follow the in-product steps to install the System integration and deploy an Elastic Agent. The sequence of steps varies depending on whether you have already installed an integration.
- When configuring the System integration, make sure that Collect metrics from System instances is turned on.
- Expand each configuration section to verify that the settings are correct for your host. For example, you might want to turn on System core metrics to get a complete view of your infrastructure.
The Add agent flyout has two options: Enroll in Fleet and Run standalone. The default is to enroll the agents in Fleet, as this reduces the amount of work on the person managing the hosts by providing a centralized management tool in Kibana.
Skip the Select enrollment token step. The enrollment token you need is already selected.
NoteThe enrollment token is specific to the Elastic Agent policy that you created. When you run the command to enroll the agent in Fleet, you pass in the enrollment token.
Download, install, and enroll the Elastic Agent on your host by selecting your host operating system and following the Install Elastic Agent on your host step.
It takes about a minute for Elastic Agent to enroll in Fleet, download the configuration specified in the policy you created, and start collecting data.
Notice that you can also configure the integration to collect logs.
What if Elastic Agent is already running on the host?
Don't try to deploy a second Elastic Agent to the same system. You have a couple options:
- Use the System integration to collect system logs and metrics. To do this, uninstall the standalone agent you deployed previously, then follow the in-product steps to install the System integration and deploy an Elastic Agent.
- Configure your existing standalone agent to collect metrics. To do this, edit the deployed Elastic Agent's YAML file and add metric inputs to the configuration manually. Manual configuration is a time-consuming process. To save time, you can follow the in-product steps that describe how to deploy a standalone Elastic Agent, and use the generated configuration as source for the input configurations that you need to add to your standalone config file.
After the agent is installed and successfully streaming metrics data, go to Infrastructure → Infrastructure inventory or Hosts to see a metrics-driven view of your infrastructure. To learn more, refer to View infrastructure metrics by resource type or Analyze and compare hosts.
Now that you have added metrics and explored your data, learn how to onboard other types of data: