- Kibana Guide: other versions:
- Introduction
- Get started
- Set Up Kibana
- Discover
- Visualize
- Creating a Visualization
- Saving Visualizations
- Using rolled up data in a visualization
- Line, Area, and Bar charts
- Controls Visualization
- Data Table
- Markdown Widget
- Metric
- Goal and Gauge
- Pie Charts
- Coordinate Maps
- Region Maps
- Timelion
- TSVB
- Tag Clouds
- Heatmap Chart
- Vega Graphs
- Inspecting Visualizations
- Dashboard
- Canvas
- Graph data connections
- Machine learning
- Elastic Maps
- Code
- Infrastructure
- Logs
- APM
- Uptime
- SIEM
- Dev Tools
- Stack Monitoring
- Management
- Reporting from Kibana
- REST API
- Kibana plugins
- Limitations
- Release Highlights
- Breaking Changes
- Release Notes
- Developer guide
IMPORTANT: No additional bug fixes or documentation updates
will be released for this version. For the latest information, see the
current release documentation.
Getting started with infrastructure monitoring
editGetting started with infrastructure monitoring
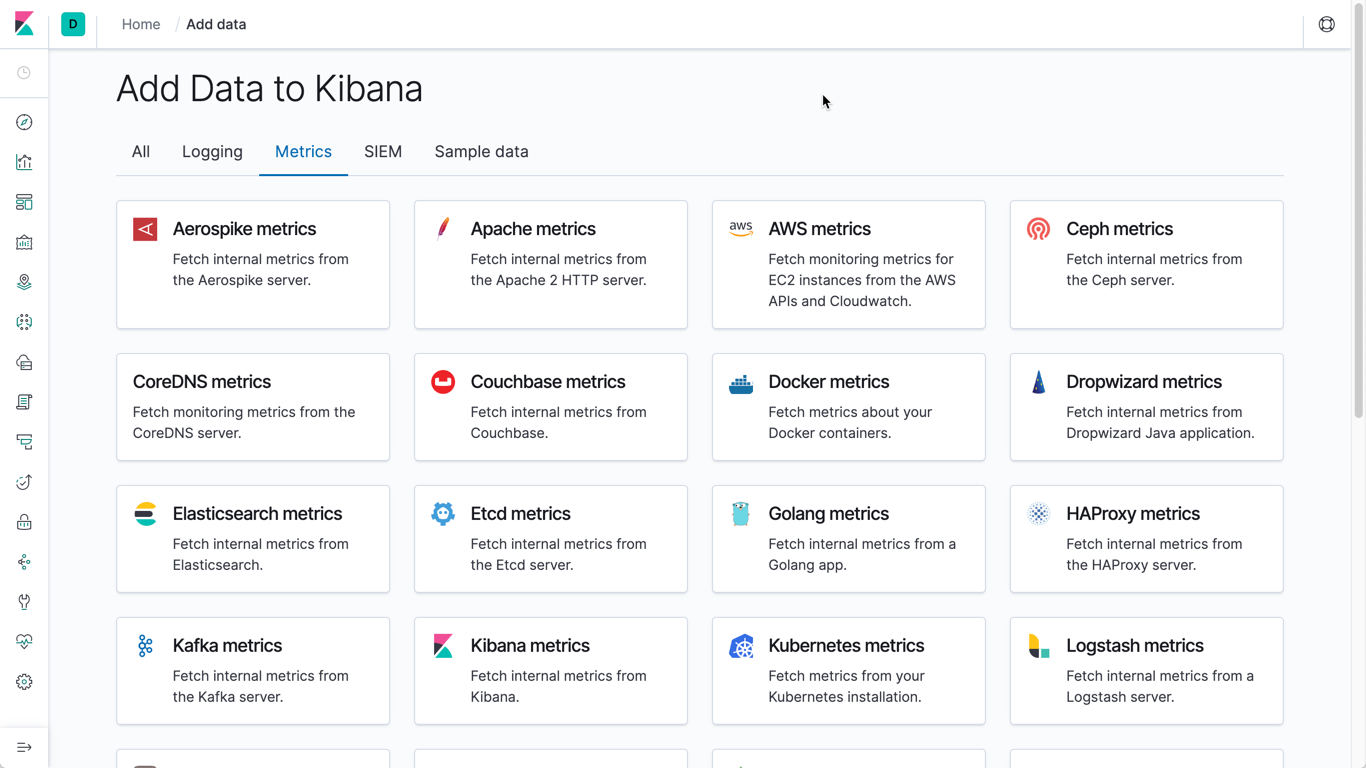
editTo get started with the Infrastructure app in Kibana, you need to start collecting metrics data for your infrastructure.
Kibana provides step-by-step instructions to help you add metrics data. The Infrastructure Monitoring Guide is a good source for more detailed information and instructions.

Was this helpful?
Thank you for your feedback.