IMPORTANT: No additional bug fixes or documentation updates
will be released for this version. For the latest information, see the
current release documentation.
Machine Learning integration
edit
IMPORTANT: This documentation is no longer updated. Refer to Elastic's version policy and the latest documentation.
Machine Learning integration
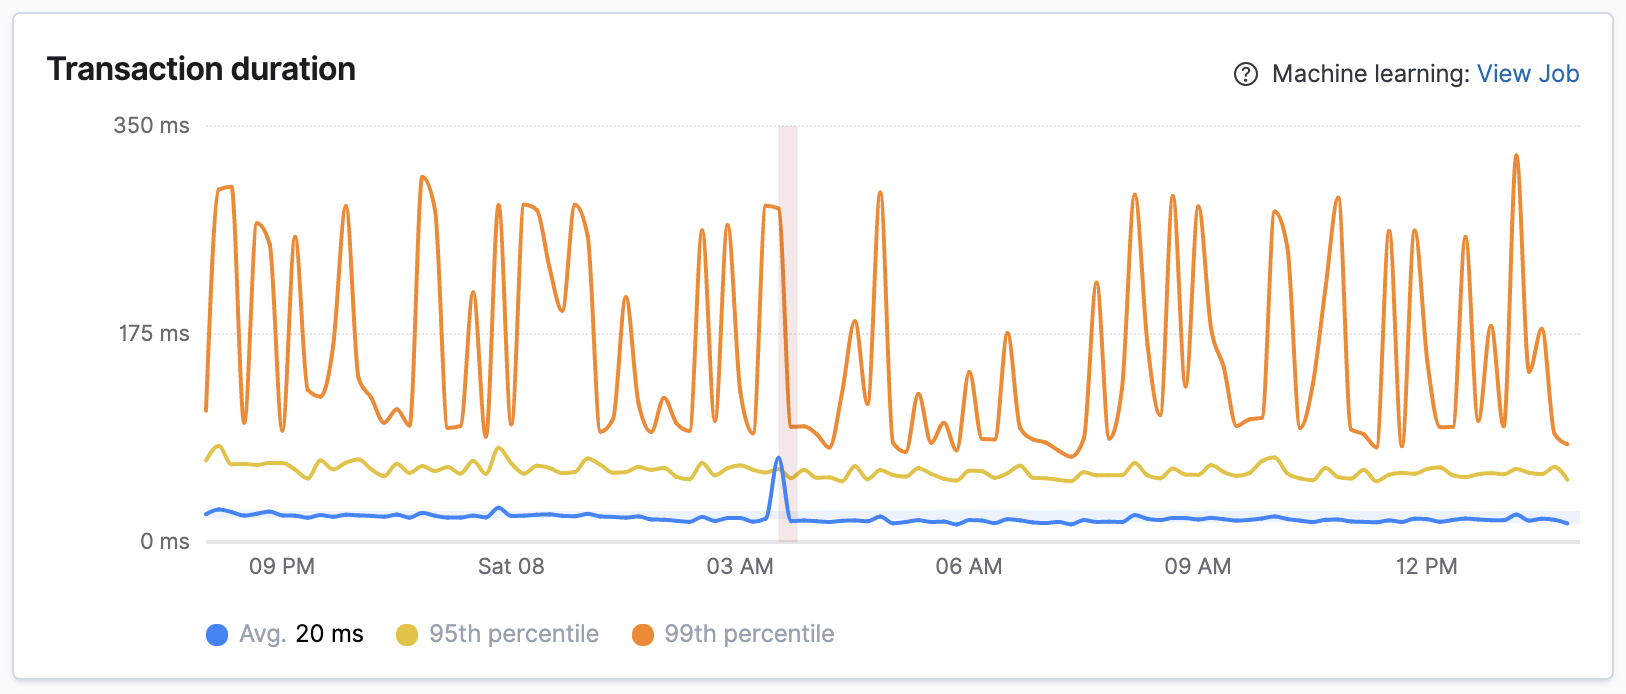
editThe Machine Learning integration will initiate a new job predefined to calculate anomaly scores on transaction response times. The response time graph will show the expected bounds and annotate the graph when the anomaly score is 75 or above.
Jobs can be created per transaction type and based on the average response time. You can manage jobs in the Machine Learning jobs management. It might take some time for results to appear on the graph.
Machine learning is a platinum feature. For a comparison of the Elastic license levels, see the subscription page.