Connect Kibana with Elasticsearch
editConnect Kibana with Elasticsearch
editBefore you can start using Kibana, you need to tell it which Elasticsearch indices you want to explore. The first time you access Kibana, you are prompted to define an index pattern that matches the name of one or more of your indices. That’s it. That’s all you need to configure to start using Kibana. You can add index patterns at any time from the Management tab.
By default, Kibana connects to the Elasticsearch instance running on localhost. To connect to a
different Elasticsearch instance, modify the Elasticsearch URL in the kibana.yml configuration file and
restart Kibana. For information about using Kibana with your production nodes, see Using Kibana in a production environment.
To configure the Elasticsearch indices you want to access with Kibana:
-
Point your browser at port 5601 to access the Kibana UI. For example,
localhost:5601orhttp://YOURDOMAIN.com:5601.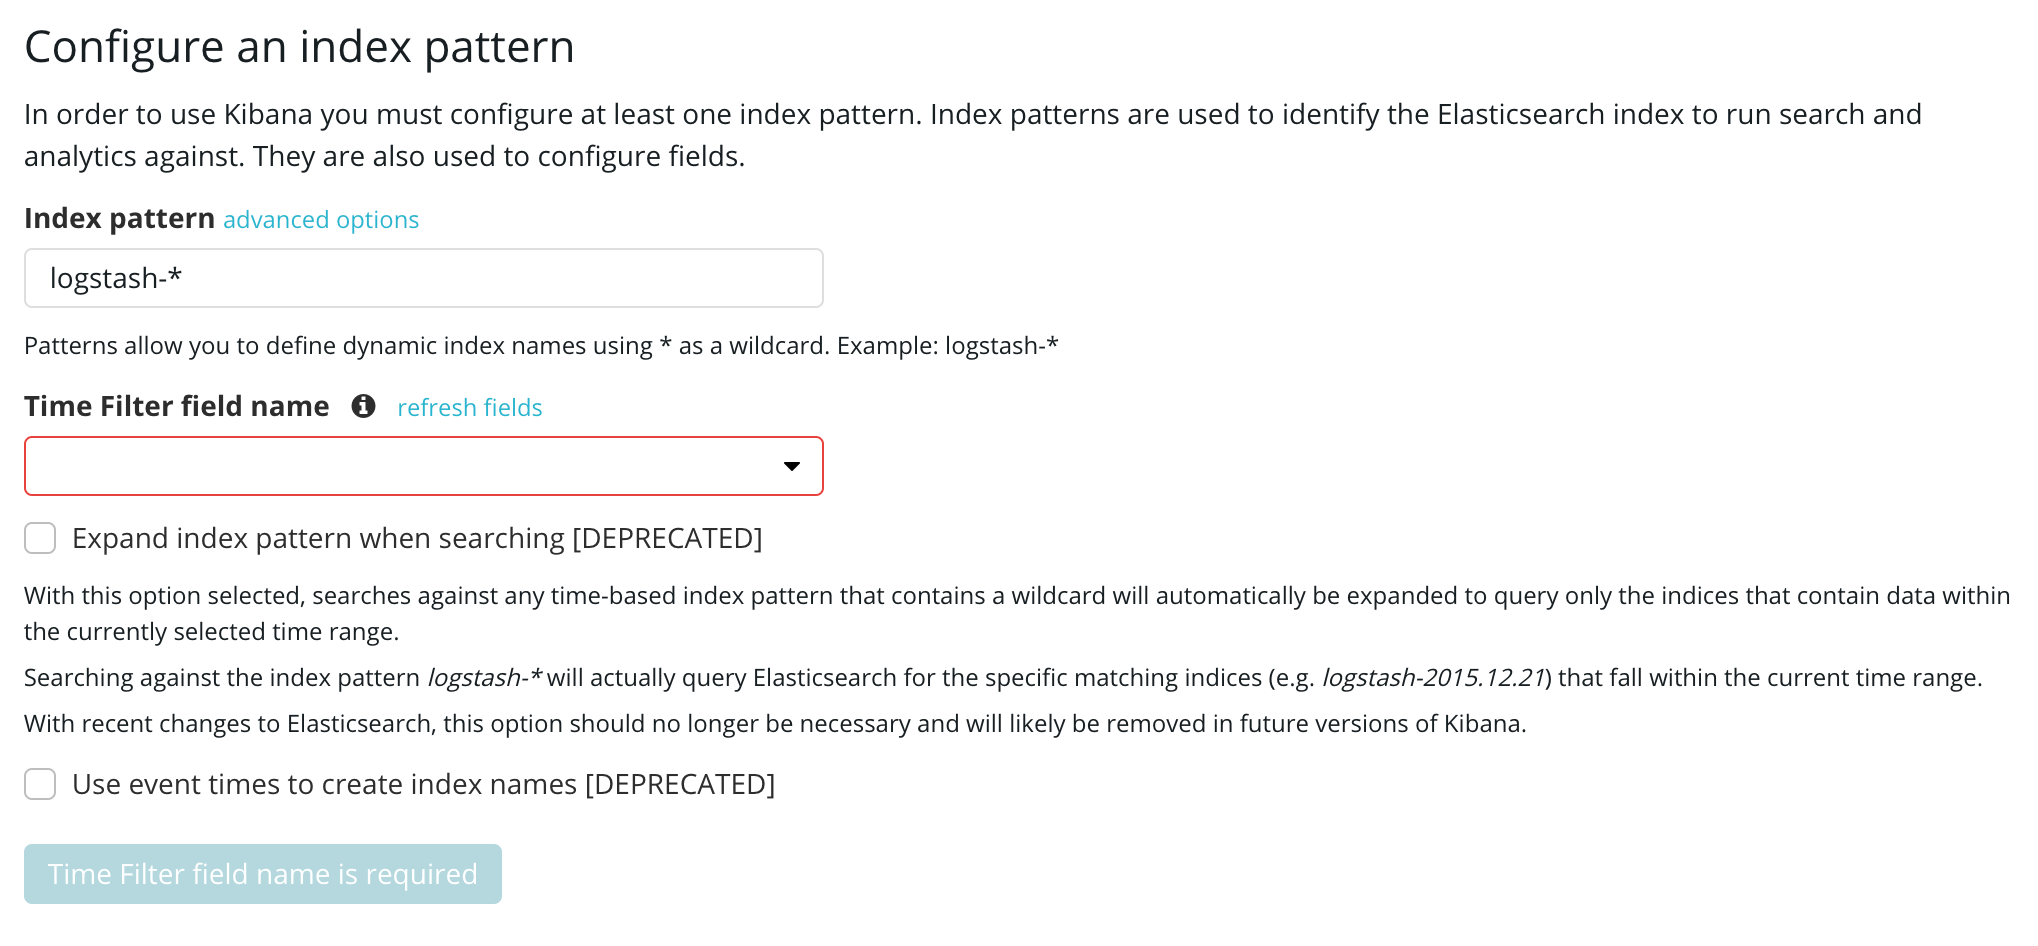
- Specify an index pattern that matches the name of one or more of your Elasticsearch indices. The pattern can include an asterisk (*) to matches zero or more characters in an index’s name. When filling out your index pattern, any matched indices will be displayed.
- Click Next Step to select the index field that contains the timestamp you want to use to perform time-based comparisons. Kibana reads the index mapping to list all of the fields that contain a timestamp. If your index doesn’t have time-based data, choose I don’t want to use the Time Filter option.
- Click Create index pattern to add the index pattern. This first pattern is automatically configured as the default. When you have more than one index pattern, you can designate which one to use as the default by clicking on the star icon above the index pattern title from Management > Index Patterns.
All done! Kibana is now connected to your Elasticsearch data. Kibana displays a read-only list of fields configured for the matching index.
Start Exploring your Data!
editYou’re ready to dive in to your data:
For a step-by-step introduction to these core Kibana concepts, see the Getting Started tutorial.