IMPORTANT: No additional bug fixes or documentation updates
will be released for this version. For the latest information, see the
current release documentation.
Discover
edit
IMPORTANT: This documentation is no longer updated. Refer to Elastic's version policy and the latest documentation.
Discover
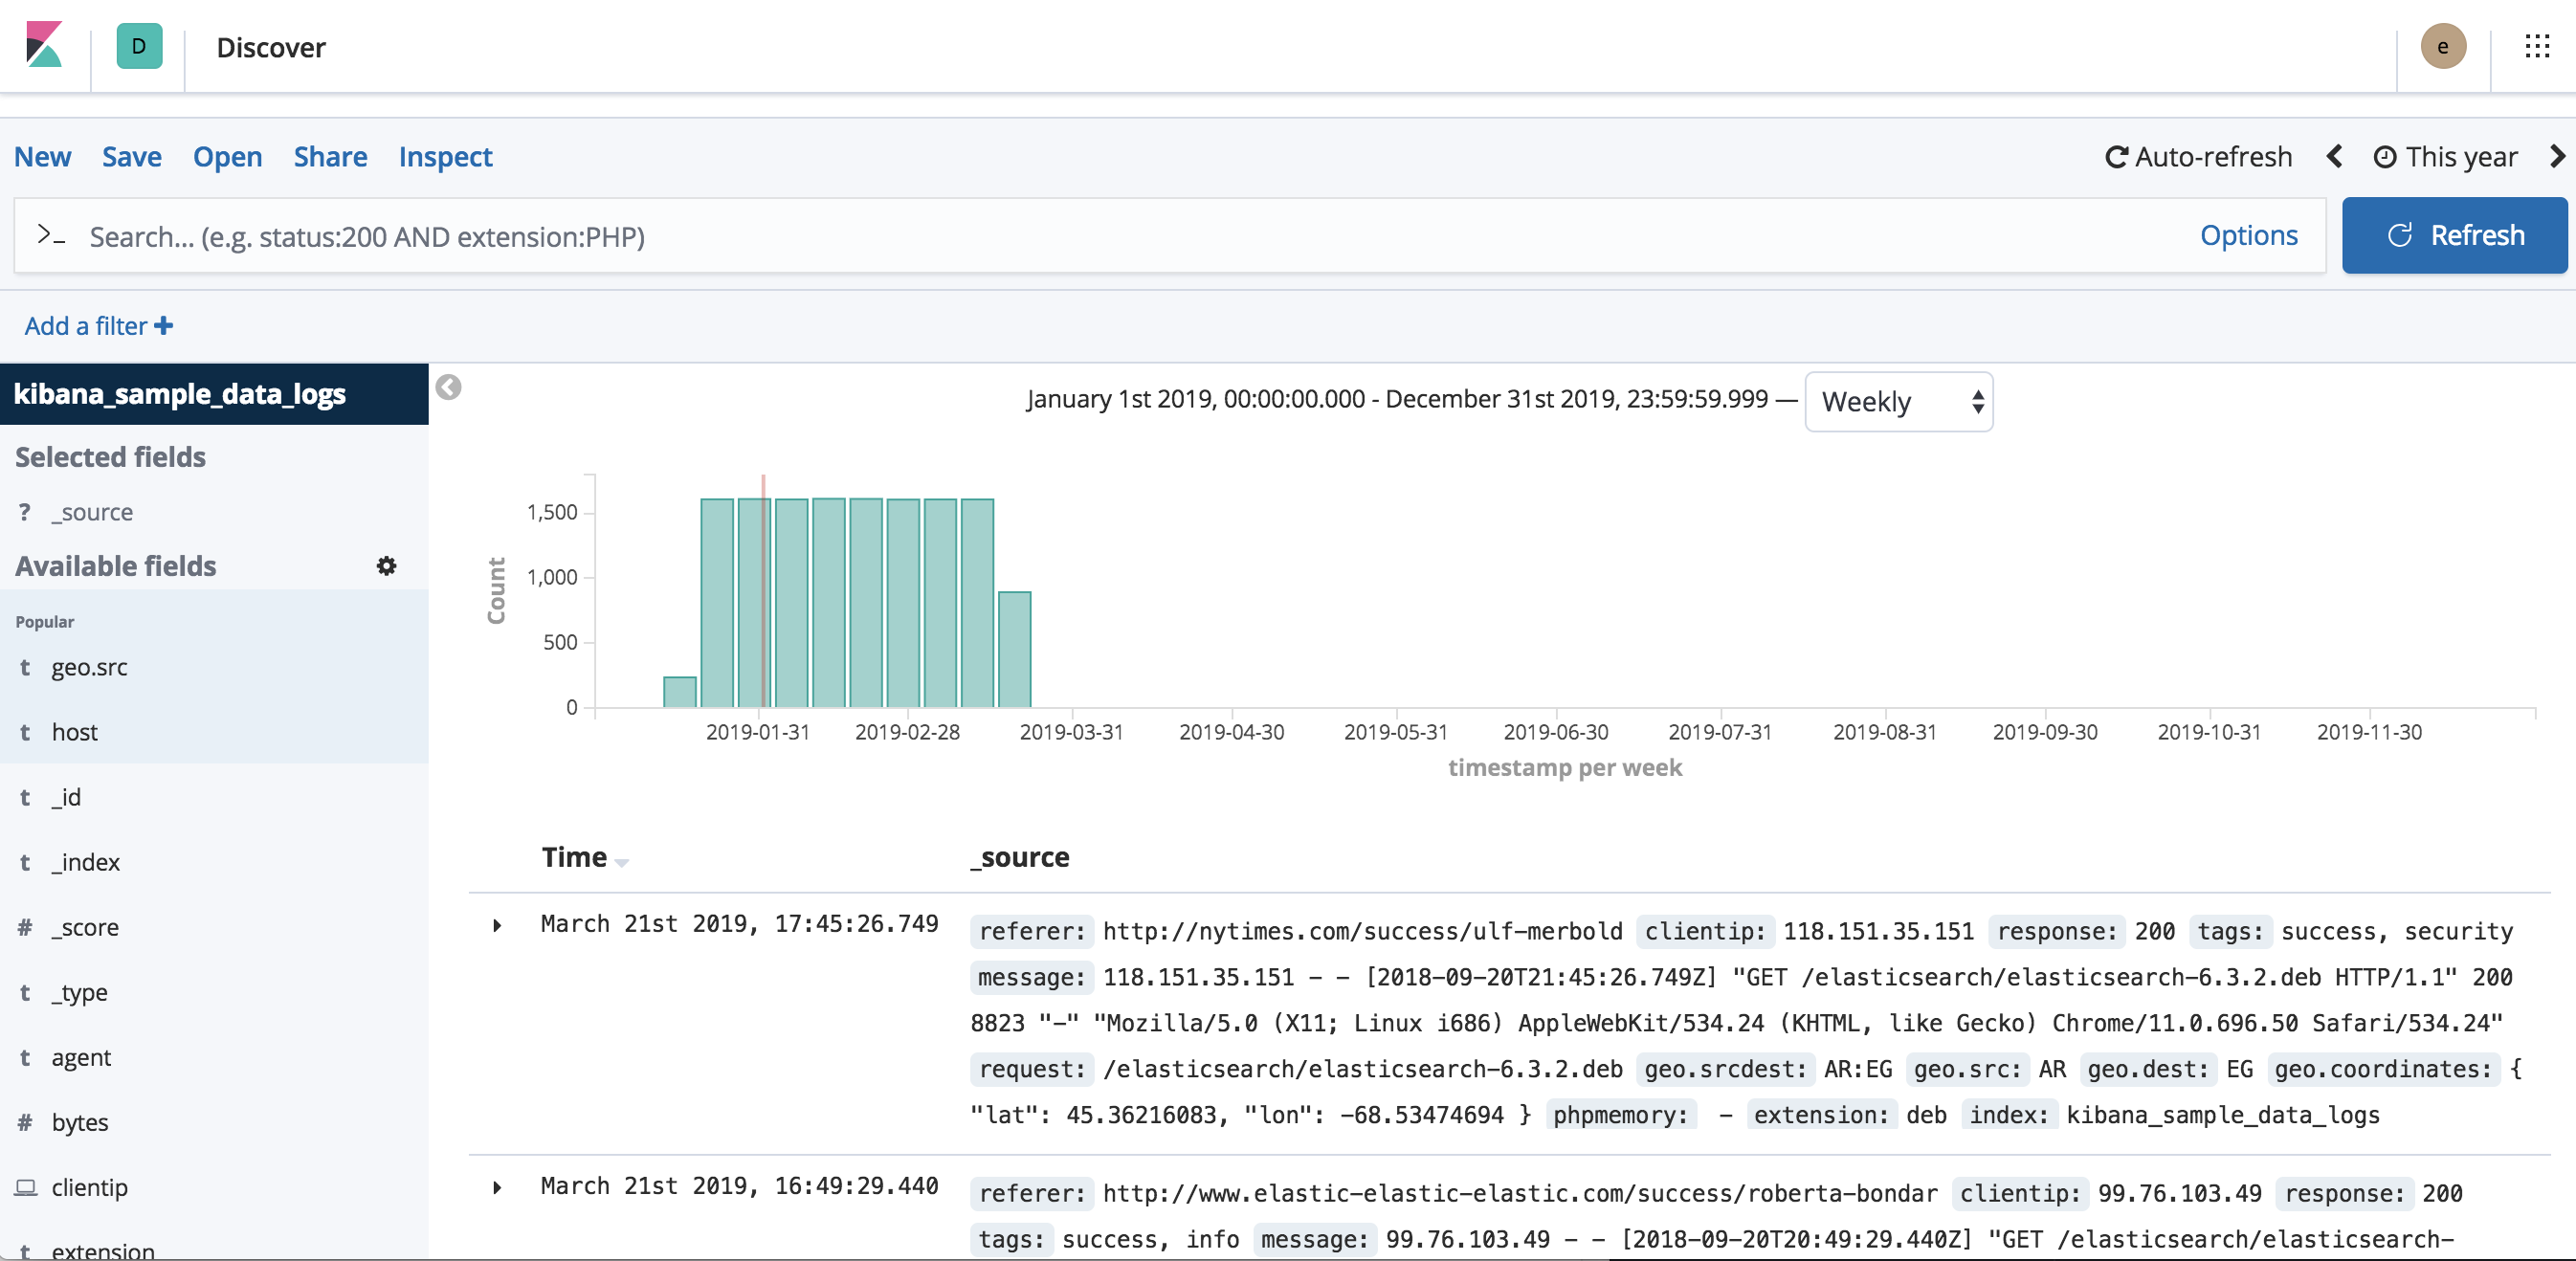
editDiscover enables you to explore your data with Kibana’s data discovery functions. You have access to every document in every index that matches the selected index pattern. You can submit search queries, filter the search results, and view document data. You can also see the number of documents that match the search query and get field value statistics. If a time field is configured for the selected index pattern, the distribution of documents over time is displayed in a histogram at the top of the page.