IMPORTANT: No additional bug fixes or documentation updates
will be released for this version. For the latest information, see the
current release documentation.
Global Options
edit
IMPORTANT: This documentation is no longer updated. Refer to Elastic's version policy and the latest documentation.
Global Options
editOpen the Options tab to configure settings that apply to all input controls in a Controls visualization.
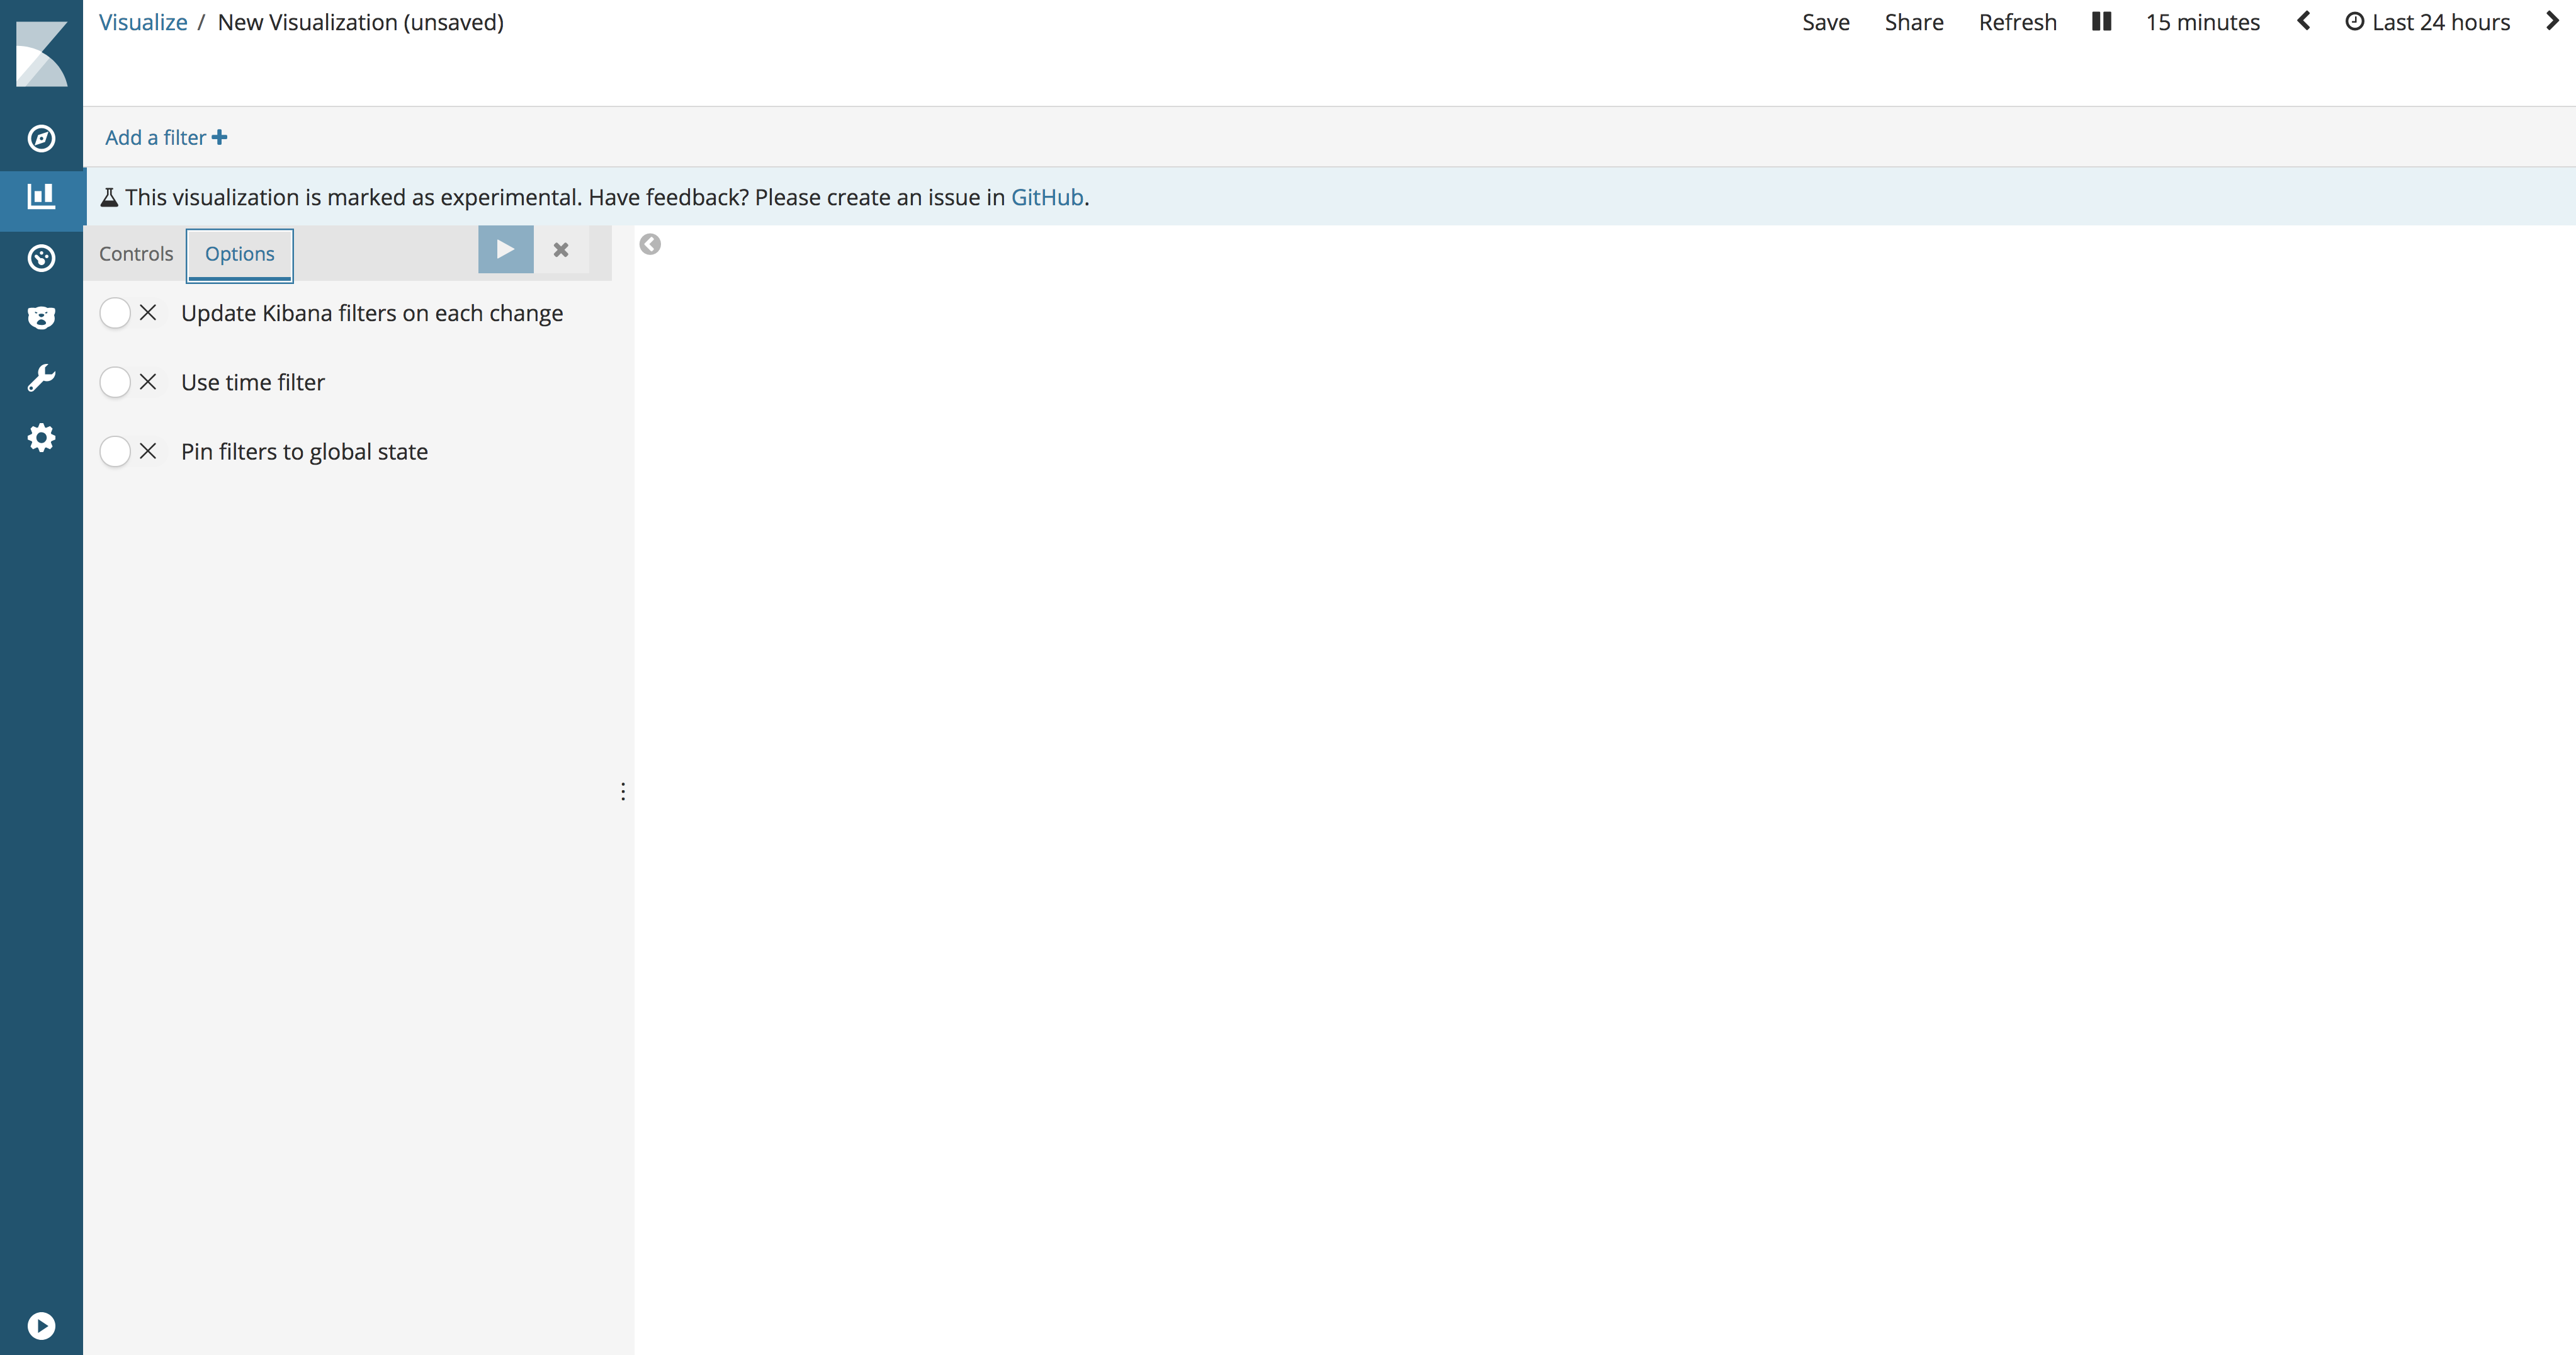
- Update Kibana filters on each change
-
When enabled, all input interactions
immediately create filters that cause the dashboard to refresh. When disabled,
Kibana filters are only created
when the user clicks Apply changes
 .
.
- Use time filter
- When enabled, the aggregations used to generate the dropdown options list and range minimum and maximum are bound to Kibana’s global time range.
- Pin filters to global state
- When enabled, all filters created by interacting with the inputs are automatically pinned.