IMPORTANT: No additional bug fixes or documentation updates
will be released for this version. For the latest information, see the
current release documentation.
Elastic Maps
edit
IMPORTANT: This documentation is no longer updated. Refer to Elastic's version policy and the latest documentation.
Elastic Maps
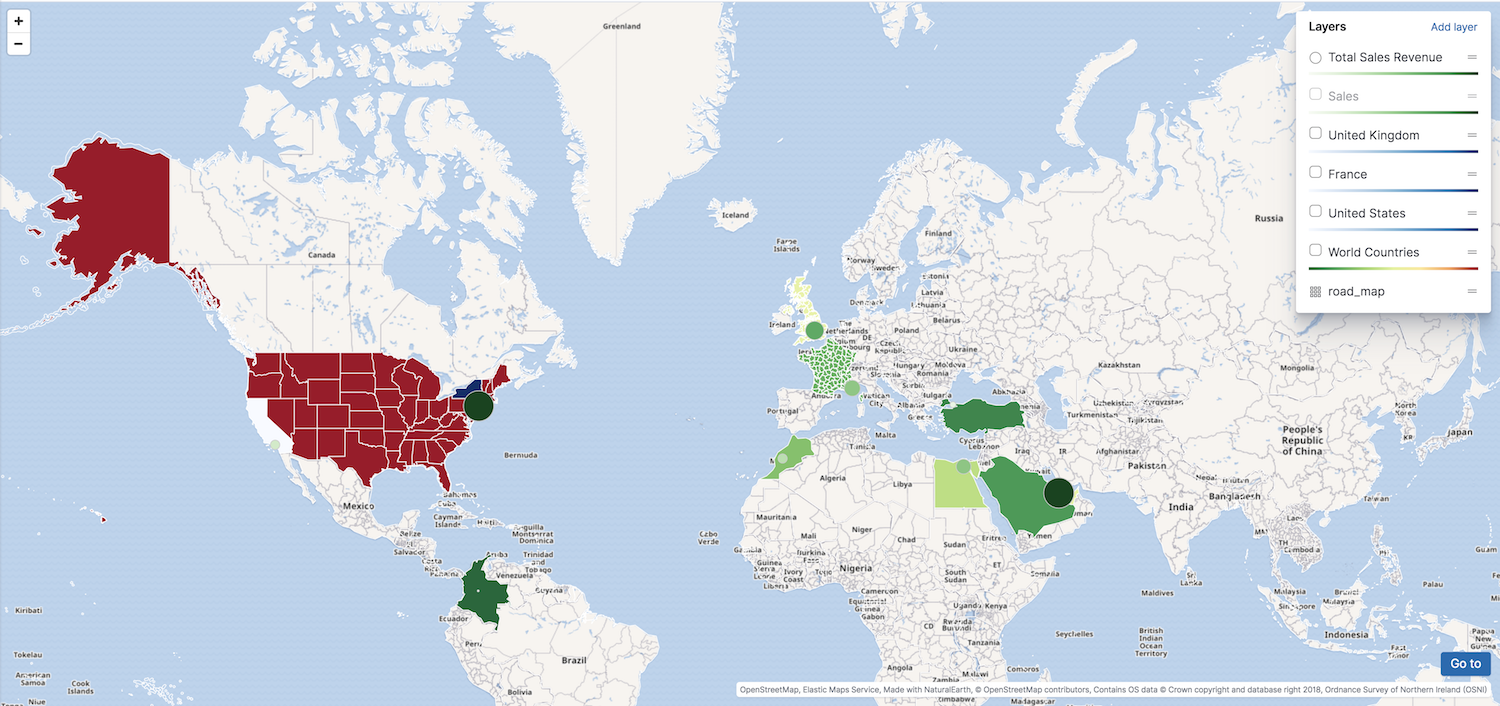
editElastic Maps enables you to parse through your geographical data at scale, with speed, and in real time. With features like multiple layers and indices in a map, plotting of raw documents, dynamic client-side styling, and global search across multiple layers, you can understand and monitor your data with ease.
With Elastic Maps, you can:
- Create maps with multiple layers and indices.
- Upload GeoJSON files into Elasticsearch.
- Embed your map in Dashboards.
- Plot individual documents or use aggregations to plot any data set, no matter how large.
- Create choropleth maps.
- Use data driven styling to symbolize features from property values.
- Focus the data you want to display with searches.
Start your tour of Elastic Maps with the getting started tutorial.