IMPORTANT: No additional bug fixes or documentation updates
will be released for this version. For the latest information, see the
current release documentation.
Logs
edit
IMPORTANT: This documentation is no longer updated. Refer to Elastic's version policy and the latest documentation.
Logs
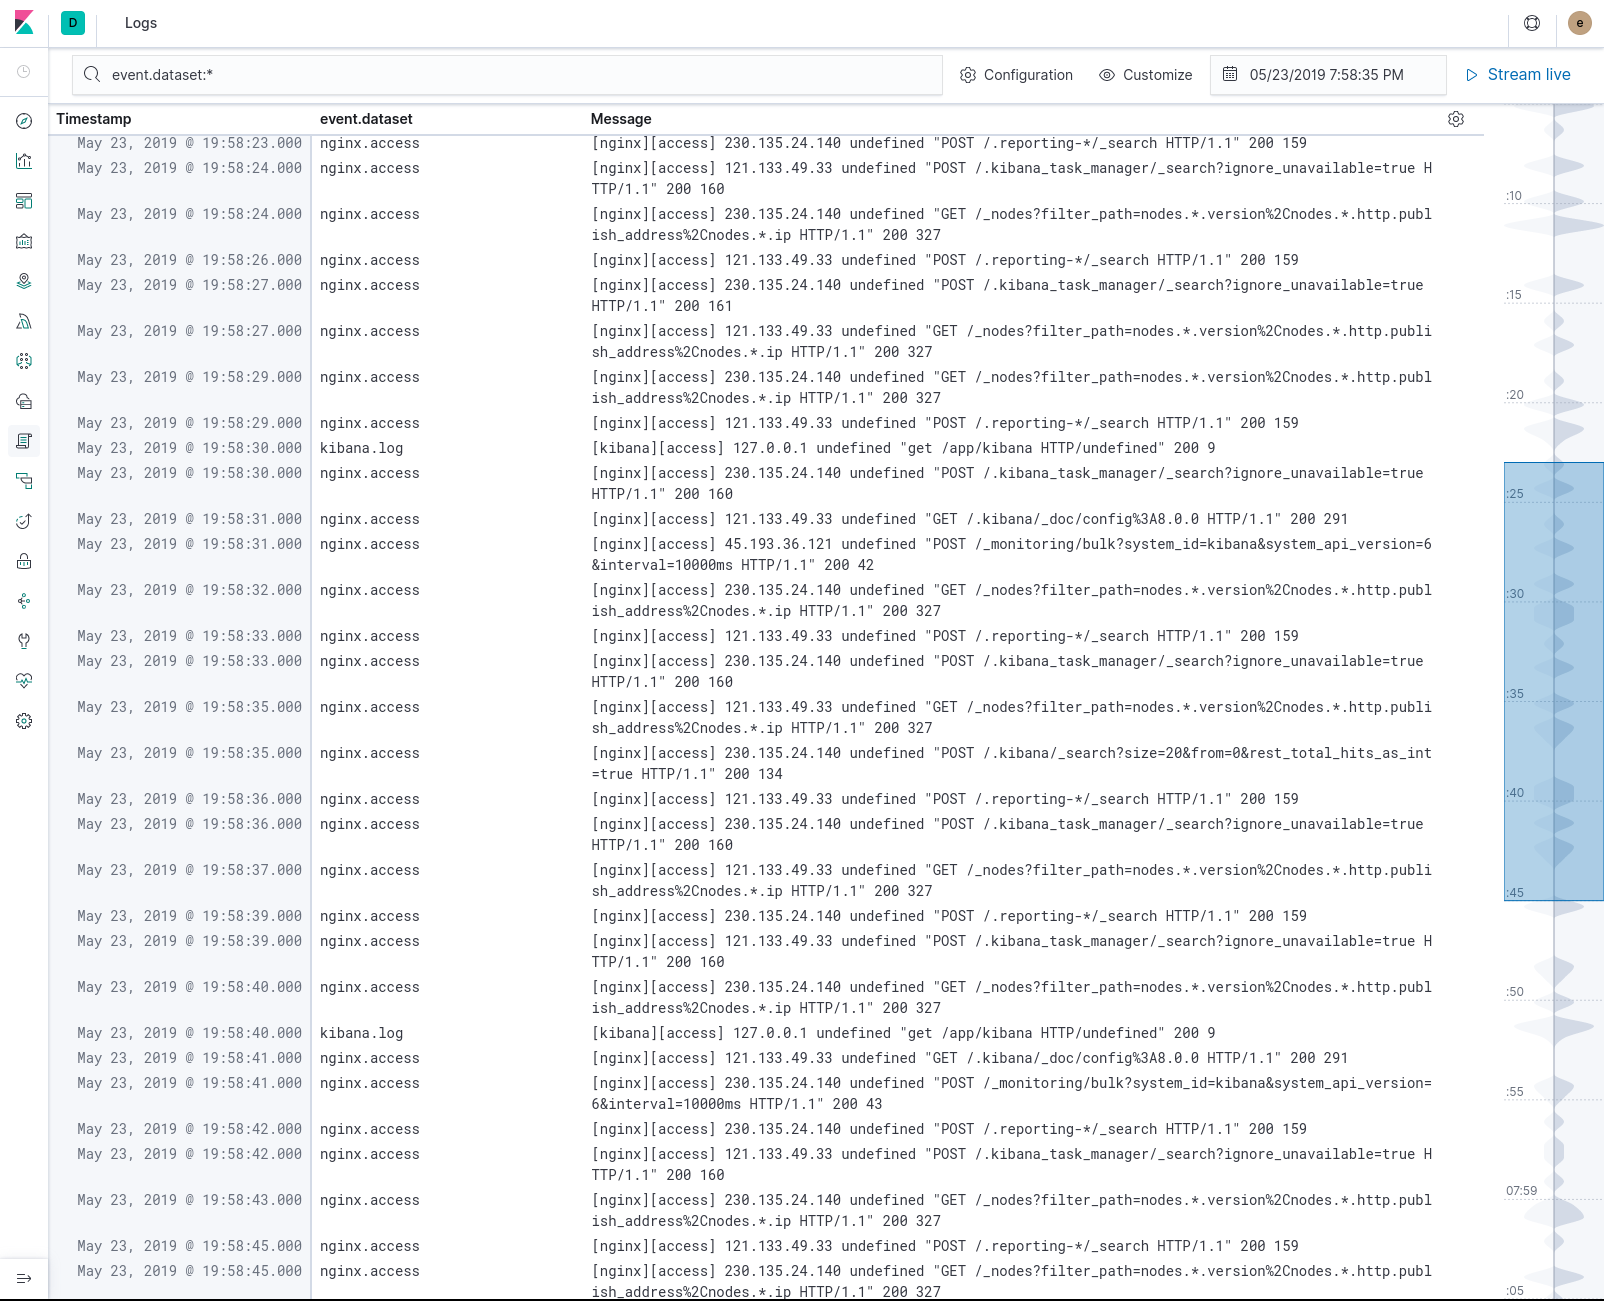
editThe Logs app in Kibana enables you to explore logs for common servers, containers, and services.
The Logs app has a compact, console-like display that you can customize. You can filter the logs by various fields, start and stop live streaming, and highlight text of interest.
You can open the Logs app from the Logs tab in Kibana. You can also open the Logs app directly from a component in the Infrastructure app. In this case, you will only see the logs for the selected component.