AutoOps
AutoOps diagnoses issues in Elasticsearch by analyzing hundreds of metrics, providing root-cause analysis and accurate resolution paths. With AutoOps, customers can prevent and resolve issues, cut down administration time, and optimize resource utilization.

Real-time root-cause analysis for hundreds of issues.
Accurate resolution paths and customized recommendations.
Insight into what occurred and detailed views into nodes, index, shards, and templates.
Wide range of insights, including:
- Cluster status, node failures, and shard sizes.
- High CPU, memory, disk usage, and other resource-related metrics.
- Misconfigurations and possible optimizations.
- Insights on data structure, shards, templates, and mapping optimizations.
- Unbalanced loads between nodes.
- Indexing latency, rejections, search latency, high index/search queues, and slow queries.
- Resource utilization.
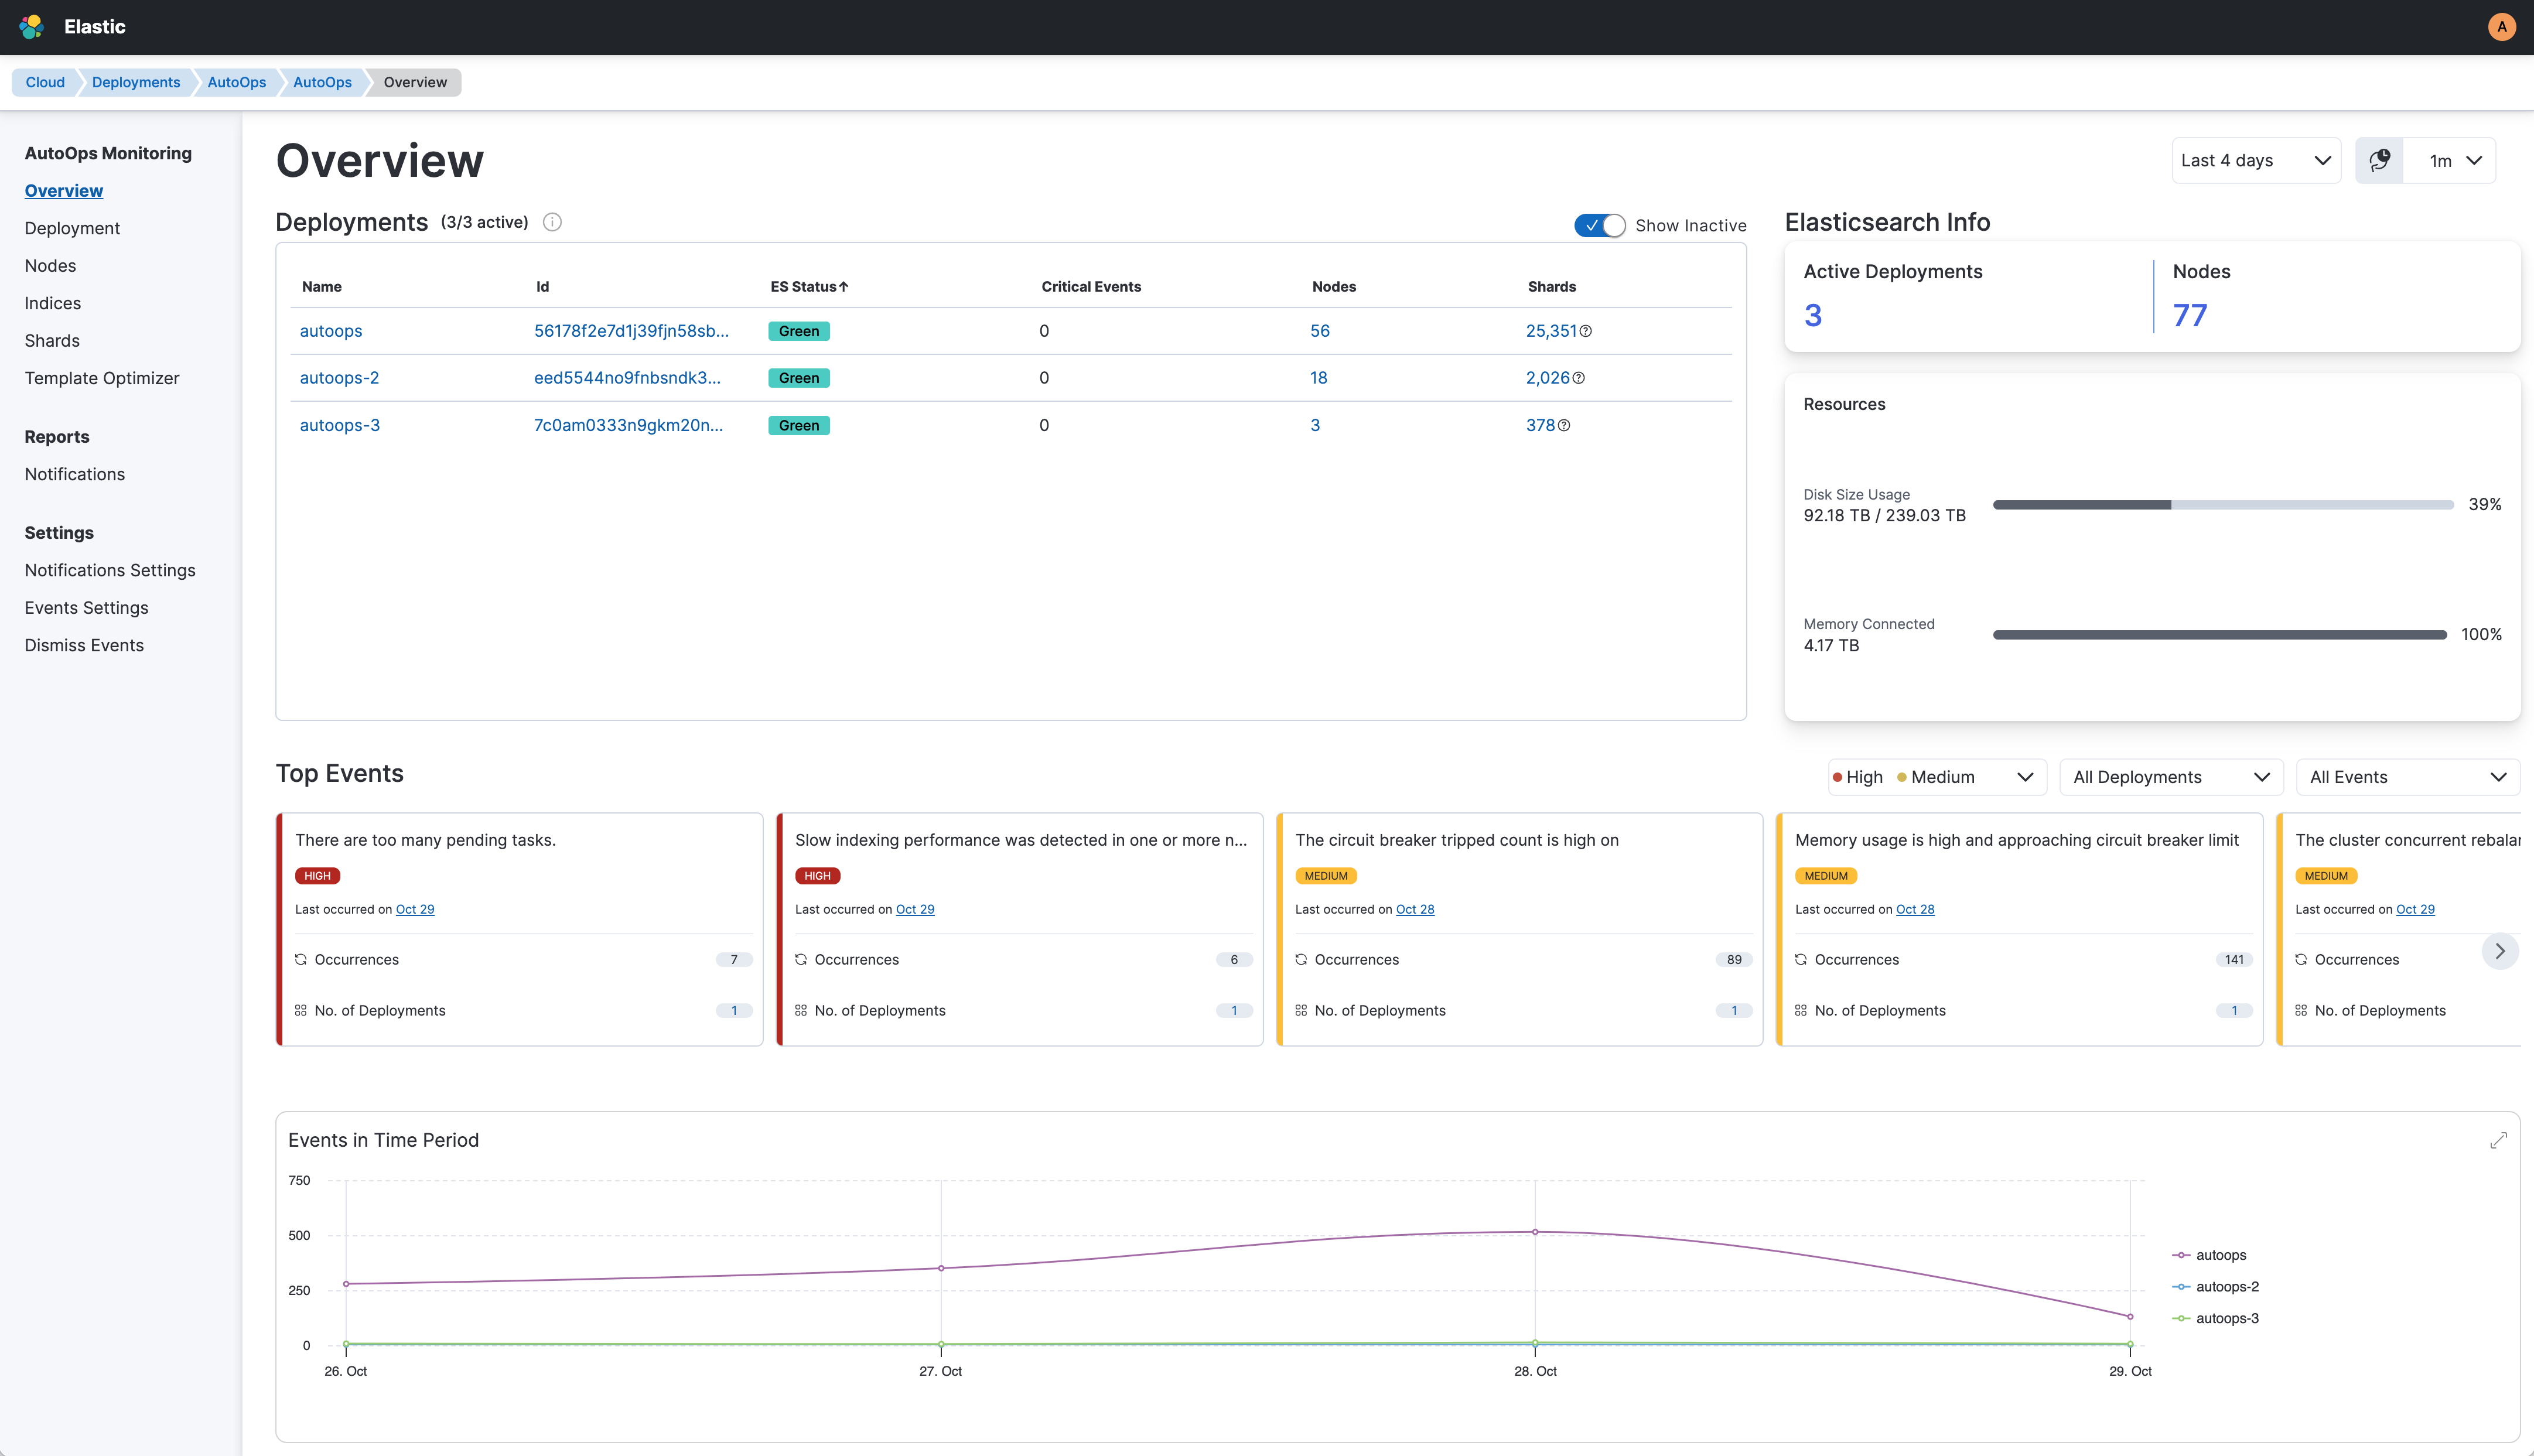
Multi-deployment dashboard to quickly spot issues across all clusters.
Possibility to customize event triggers and connect to different notification services such as PagerDuty, Slack, MS Teams, and webhooks.
Coming soon: Long-term reports for sustained evaluation.
Depending on your deployment type, AutoOps has been rolled out across various regions. More regions and CSPs are coming soon.
AutoOps is automatically available in Elastic Cloud Hosted deployments and Elastic Cloud Serverless projects, and can be set up for ECE, ECK, and self-managed clusters through Cloud Connect.
AutoOps is currently not available for air-gapped environments because it's a cloud service and you need an internet connection to send metrics to Elastic Cloud. However, we plan to offer a locally deployable version in the future.
For Elastic Cloud Hosted deployments and Serverless projects, AutoOps is available to Elastic Cloud customers at all subscription levels at no additional cost, and it does not consume ECU.
Using AutoOps for self-managed clusters (ECE, ECK, or standalone) on-premise or in private cloud environments through Cloud Connect is included with self-managed Enterprise licenses and self-managed free trials. This does not consume ECU.
AutoOps currently has a 10 day retention period.
AutoOps currently only monitors Elasticsearch, not the entire Elastic Stack. AutoOps is compatible with supported Elasticsearch versions(7.17.x and above). We plan to expand AutoOps monitoring to the entire stack in the future.
In this section, you'll find the following information:
- How to access AutoOps in your Elastic Cloud Hosted deployments.
- How to use AutoOps in your Elastic Cloud Serverless projects.
- How to connect your ECE, ECK, or self-managed clusters to AutoOps.
- Regions where AutoOps is available.
- Which views AutoOps offers to gain insight into your deployment.
- What AutoOps events are and how you can configure event settings and notifications.
- Frequently asked questions about AutoOps.