Performance metrics on Elastic Cloud
For Elastic Cloud Hosted deployments, cluster performance metrics are available directly in the Elastic Cloud Console. The graphs on this page include a subset of Elastic Cloud Hosted-specific performance metrics.
For advanced views or production monitoring, enable logging and monitoring. The monitoring application provides more advanced views for Elasticsearch and JVM metrics, and includes a configurable retention period.
For Elastic Cloud Enterprise deployments, you can use platform monitoring to access preconfigured performance metrics.
To access cluster performance metrics:
Log in to the Elastic Cloud Console.
Find your deployment on the home page or on the Hosted deployments page, then select Manage to access its settings menus.
On the Hosted deployments page you can narrow your deployments by name, ID, or choose from several other filters. To customize your view, use a combination of filters, or change the format from a grid to a list. For example, you might want to select Is unhealthy and Has master problems to get a short list of deployments that need attention.
From your deployment menu, go to the Performance page.
The following metrics are available:

Shows the maximum usage of the CPU resources assigned to your Elasticsearch cluster, as a percentage. CPU resources are relative to the size of your cluster, so that a cluster with 32GB of RAM gets assigned twice as many CPU resources as a cluster with 16GB of RAM. All clusters are guaranteed their share of CPU resources, as Elastic Cloud Hosted infrastructure does not overcommit any resources. CPU credits permit boosting the performance of smaller clusters temporarily, so that CPU usage can exceed 100%.
This chart reports the maximum CPU values over the sampling period. Logs and metrics ingested into Stack Monitoring's "CPU Usage" instead reflects the average CPU over the sampling period. Therefore, you should not expect the two graphs to look exactly the same. When investigating CPU-related performance issues, you should default to Stack Monitoring.

Shows your remaining CPU credits, measured in seconds of CPU time. CPU credits enable the boosting of CPU resources assigned to your cluster to improve performance temporarily when it is needed most. For more details check How to use vCPU to boost your instance.

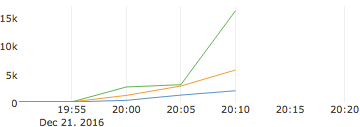
Shows the number of requests that your cluster receives per second, separated into search requests and requests to index documents. This metric provides a good indicator of the volume of work that your cluster typically handles over time which, together with other performance metrics, helps you determine if your cluster is sized correctly. Also lets you check if there is a sudden increase in the volume of user requests that might explain an increase in response times.

Indicates the amount of time that it takes for your Elasticsearch cluster to complete a search query, in milliseconds. Response times won’t tell you about the cause of a performance issue, but they are often a first indicator that something is amiss with the performance of your Elasticsearch cluster.

Indicates the amount of time that it takes for your Elasticsearch cluster to complete an indexing operation, in milliseconds. Response times won’t tell you about the cause of a performance issue, but they are often a first indicator that something is amiss with the performance of your Elasticsearch cluster.

Indicates the total memory used by the JVM heap over time. We’ve configured Elasticsearch's garbage collector to keep memory usage below 75% for heaps of 8GB or larger. For heaps smaller than 8GB, the threshold is 85%. If memory pressure consistently remains above this threshold, you might need to resize your cluster or reduce memory consumption. Check how high memory pressure can cause performance issues.

Indicates the overhead involved in JVM garbage collection to reclaim memory.
Performance correlates directly with resources assigned to your cluster, and many of these metrics will show some sort of correlation with each other when you are trying to determine the cause of a performance issue. Take a look at some of the scenarios included in this section to learn how you can determine the cause of performance issues.
It is not uncommon for performance issues on Elastic Cloud Hosted to be caused by an undersized cluster that cannot cope with the workload it is being asked to handle. If your cluster performance metrics often shows high CPU usage or excessive memory pressure, consider increasing the size of your cluster soon to improve performance. This is especially true for clusters that regularly reach 100% of CPU usage or that suffer out-of-memory failures; it is better to resize your cluster early when it is not yet maxed out than to have to resize a cluster that is already overwhelmed. Changing the configuration of your cluster may add some overhead if data needs to be migrated to the new nodes, which can increase the load on a cluster further and delay configuration changes.
To help diagnose high CPU usage you can also use the Elasticsearch nodes hot threads API, which identifies the threads on each node that have the highest CPU usage or that have been executing for a longer than normal period of time.
Got an overwhelmed cluster that needs to be upsized? Try enabling maintenance mode first. It will likely help with configuration changes.
Work with the metrics shown in Cluster Performance Metrics section to help you find the information you need:
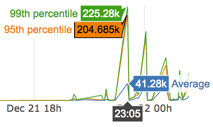
Hover on any part of a graph to get additional information. For example, hovering on a section of a graph that shows response times reveals the percentile that responses fall into at that point in time:

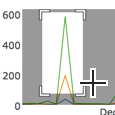
Zoom in on a graph by drawing a rectangle to select a specific time window. As you zoom in one metric, other performance metrics change to show data for the same time window.

Pan around with
 to make sure that you can get the right parts of a metric graph as you zoom in.
Reset the metric graph axes with
 , which returns the graphs to their original scale.
Cluster performance metrics are shown per node and are color-coded to indicate which running Elasticsearch instance they belong to.