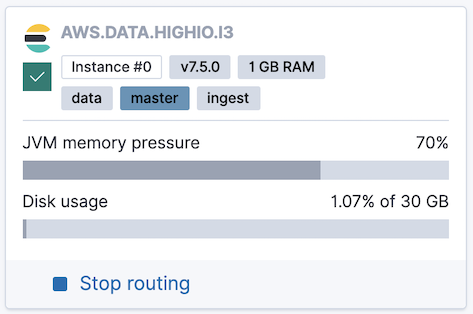
JVM memory pressure indicator
ECH ECE
In addition to the more detailed cluster performance metrics, Elastic Cloud Hosted and Elastic Cloud Enterprise also include a JVM memory pressure indicator for each node in your cluster in your deployment overview. This indicator can help you to determine when you need to upgrade to a larger cluster.
The percentage number used in the JVM memory pressure indicator is actually the fill rate of the old generation pool. For a detailed explanation of why this metric is used, refer to Understanding memory pressure.

When the JVM memory pressure reaches 75%, the indicator turns red. At this level, garbage collection becomes more frequent as the memory usage increases, potentially impacting the performance of your cluster. As long as the cluster performance suits your needs, JVM memory pressure above 75% is not a problem in itself, but there is not much spare memory capacity. Review the common causes of high JVM memory usage to determine your best course of action.
When the JVM memory pressure indicator rises above 95%, Elasticsearch's real memory circuit breaker triggers to prevent your instance from running out of memory. This situation can reduce the stability of your cluster and the integrity of your data. Unless you expect the load to drop soon, we recommend that you resize to a larger cluster before you reach this level of memory pressure. Even if you’re planning to optimize your memory usage, it is best to resize the cluster first. Resizing the cluster to increase capacity can give you more time to apply other changes, and also provides the cluster with more resource for when those changes are applied.
The two most common reasons for a high JVM memory pressure reading are:
1. Having too many shards per node
If JVM memory pressure above 75% is a frequent occurrence, the cause is often having too many shards per node relative to the amount of available memory. You can lower the JVM memory pressure by reducing the number of shards or upgrading to a larger cluster. For guidelines, check How to size your shards.
2. Running expensive queries
If JVM memory pressure above 75% happens only occasionally, this is often due to expensive queries. Queries that have a very large request size, that involve aggregations with a large volume of buckets, or that involve sorting on a non-optimized field, can all cause temporary spikes in JVM memory usage. To resolve this problem, consider optimizing your queries or upgrading to a larger cluster.