Diagnose unavailable shards
ECH
This section describes how to analyze unassigned shards using the Elasticsearch APIs and Kibana.
- Analyze unassigned shards using the Elasticsearch API
- Analyze unassigned shards using the Kibana UI
- Remediate common issues returned by the cluster allocation explain API
Elasticsearch distributes the documents in an index across multiple shards and distributes copies of those shards across multiple nodes in the cluster. This both increases capacity and makes the cluster more resilient, ensuring your data remains available if a node goes down.
A healthy (green) cluster has a primary copy of each shard and the required number of replicas are assigned to different nodes in the cluster.
If a cluster has unassigned replica shards, it is functional but vulnerable in the event of a failure. The cluster is unhealthy and reports a status of yellow.
If a cluster has unassigned primary shards, some of your data is unavailable. The cluster is unhealthy and reports a status of red.
A formerly-healthy cluster might have unassigned shards because nodes have dropped out or moved, are running out of disk space, or are hitting allocation limits.
If a cluster has unassigned shards, you might see an error message such as this on the Elastic Cloud console:

If your issue is not addressed here, then contact Elastic support for help.
AutoOps is a monitoring tool that simplifies cluster management through performance recommendations, resource utilization visibility, and real-time issue detection with resolution paths. Learn more about AutoOps.
You can retrieve information about the status of your cluster, indices, and shards using the Elasticsearch API. To access the API you can either use the Kibana Dev Tools Console, or the Elasticsearch API console. If you have your own way to run the Elasticsearch API, check How to access the API. This section shows you how to:
- Check cluster health
- Check unhealthy indices
- Check which shards are unassigned
- Check why shards are unassigned
- Check Elasticsearch cluster logs
Use the Cluster health API:
GET /_cluster/health/
This command returns the cluster status (green, yellow, or red) and shows the number of unassigned shards:
{
  "cluster_name" : "xxx",
  "status" : "red",
  "timed_out" : false,
  "number_of_nodes" : "x",
  "number_of_data_nodes" : "x",
  "active_primary_shards" : 116,
  "active_shards" : 229,
  "relocating_shards" : 0,
  "initializing_shards" : 0,
  "unassigned_shards" : 1,
  "delayed_unassigned_shards" : 0,
  "number_of_pending_tasks" : 0,
  "number_of_inflight_fetch" : 0,
  "task_max_waiting_in_queue_millis" : 0,
  "active_shards_percent_as_number" : 98.70689655172413
}
Use the cat indices API to get the status of individual indices. Specify the health parameter to limit the results to a particular status, for example ?v&health=red or ?v&health=yellow.
GET /_cat/indices?v&health=red
This command returns any indices that have unassigned primary shards (red status):
red   open    filebeat-7.10.0-2022.01.07-000014 C7N8fxGwRxK0JcwXH18zVg  1 1
red   open    filebeat-7.9.3-2022.01.07-000015  Ib4UIJNVTtOg6ovzs011Lq  1 1
For more information, refer to Fix a red or yellow cluster status.
Use the cat shards API:
GET /_cat/shards/?v
This command returns the index name, followed by the shard type and shard status:
filebeat-7.10.0-2022.01.07-000014 0   P   UNASSIGNED
filebeat-7.9.3-2022.01.07-000015  1   P   UNASSIGNED
filebeat-7.9.3-2022.01.07-000015  2   r   UNASSIGNED
To understand why shards are unassigned, run the Cluster allocation explain API.
Running the API call GET _cluster/allocation/explain retrieves an allocation explanation for unassigned primary shards, or replica shards.
For example, if _cat/health shows that the primary shard of shard 1 in the filebeat-7.9.3-2022.01.07-000015 index is unassigned, you can get the allocation explanation with the following request:
GET _cluster/allocation/explain
{
  "index": "filebeat-7.9.3-2022.01.07-000015",
  "shard": 1,
  "primary": true
}
The response is as follows:
{
  "index": "filebeat-7.9.3-2022.01.07-000015",
  "shard": 1,
  "primary": true,
  "current_state": "unassigned",
  "unassigned_info": {
    "reason": "CLUSTER_RECOVERED",
    "at": "2022-04-12T13:06:36.125Z",
    "last_allocation_status": "no_valid_shard_copy"
  },
  "can_allocate": "no_valid_shard_copy",
  "allocate_explanation": "cannot allocate because a previous copy of the primary shard existed but can no longer be found on the nodes in the cluster",
  "node_allocation_decisions": [
    {
      "node_id": "xxxx",
      "node_name": "instance-0000000005",
      (... skip ...)
      "node_decision": "no",
      "store": {
        "found": false
      }
    }
  ]
}
To determine the allocation issue, you can check the logs. This is easier if you have set up a dedicated monitoring deployment.
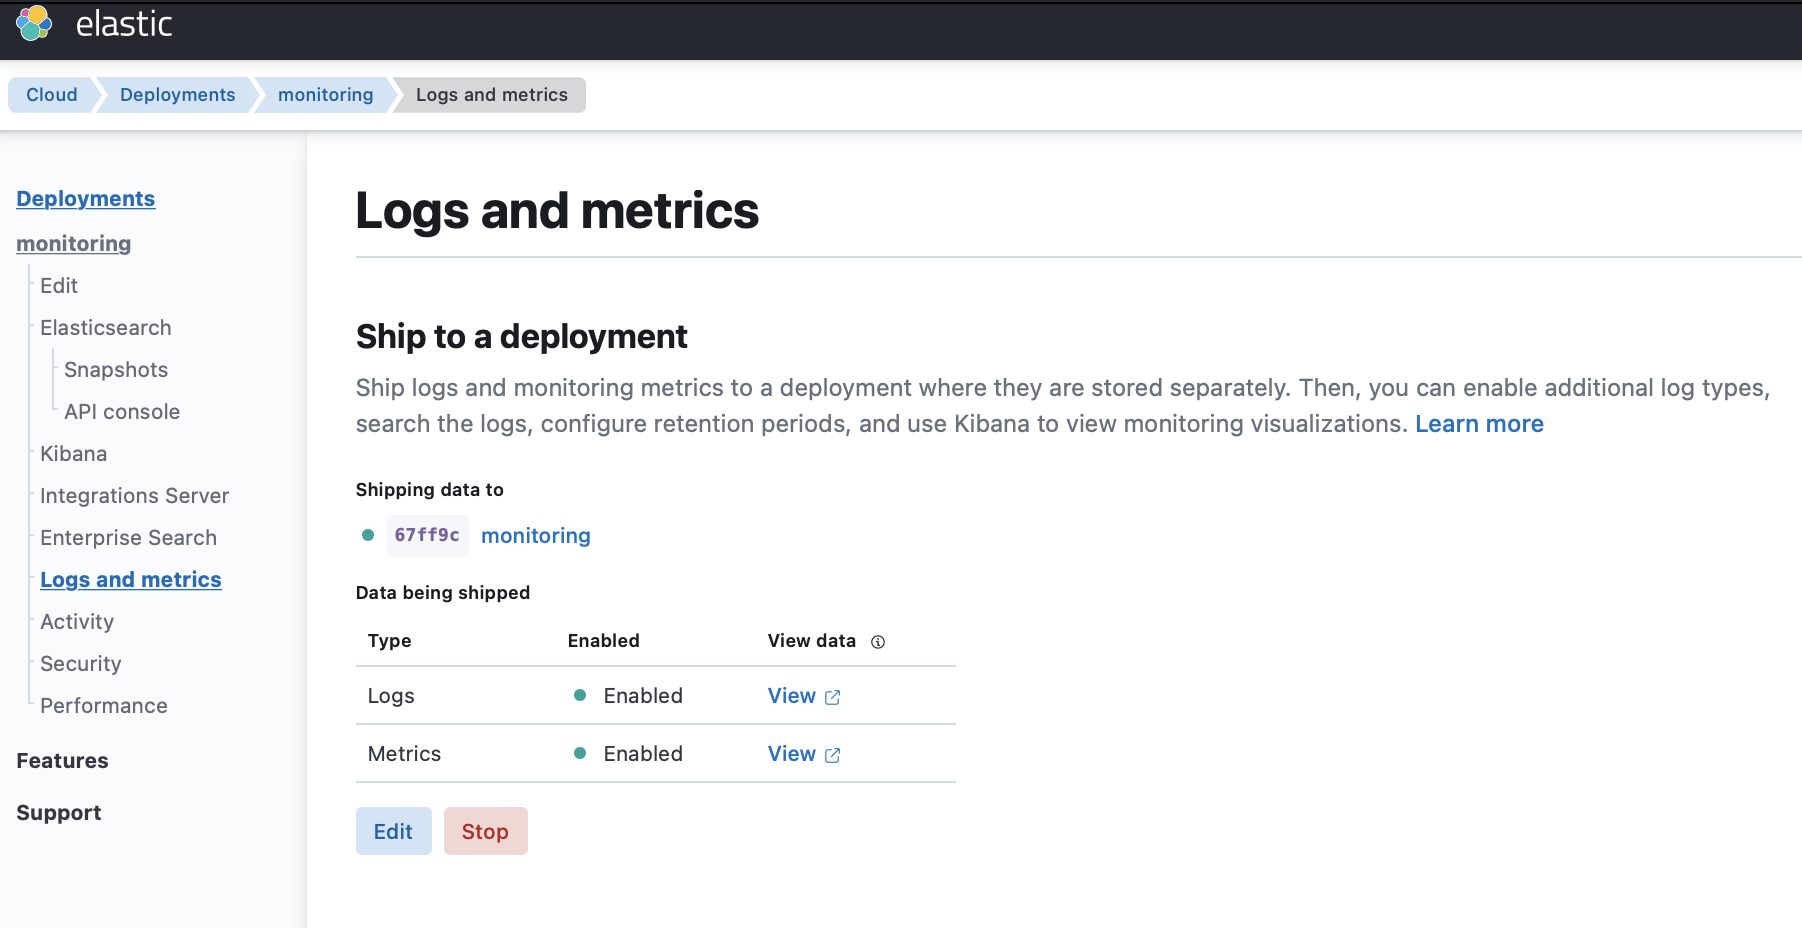
If you are shipping logs and metrics to a monitoring deployment, go through the following steps.
- Select your deployment from the Elasticsearch Service panel and navigate to the Logs and metrics page.
- Click Enable.
- Choose the deployment where to send your logs and metrics.
- Click Save. It might take a few minutes to apply the configuration changes.
- Click View to open the Kibana UI and get more details on metrics and logs.

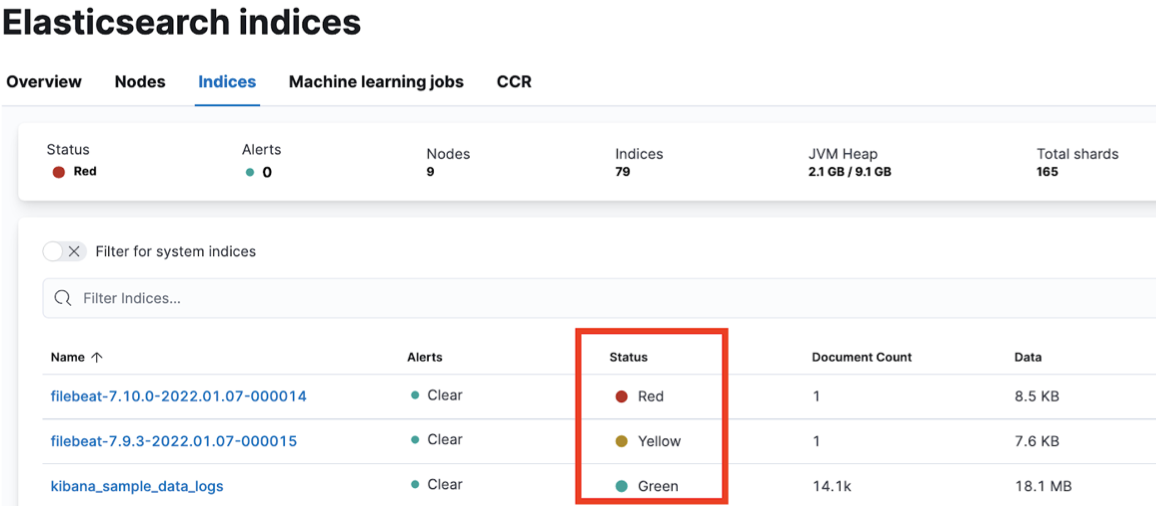
The unhealthy indices appear with a red or yellow status.

Here’s how to resolve the most common causes of unassigned shards reported by the cluster allocation explain API.
- Disk is full
- A node containing data has moved to a different host
- Unable to assign shards based on the allocation rule
- The number of eligible data nodes is less than the number of replicas
- A snapshot issue prevents searchable snapshot indices from being allocated
- Maximum retry times exceeded
- Max shard per node reached the limit
If your issue is not addressed here, then contact Elastic support for help.
Symptom
If the disk usage exceeded the threshold, you may get one or more of the following messages:
the node is above the high watermark cluster setting [cluster.routing.allocation.disk.watermark.high=90%], using more disk space than the maximum allowed [90.0%], actual free: [9.273781776428223%]
unable to force allocate shard to [%s] during replacement, as allocating to this node would cause disk usage to exceed 100%% ([%s] bytes above available disk space)
the node is above the low watermark cluster setting [cluster.routing.allocation.disk.watermark.low=85%], using more disk space than the maximum allowed [85.0%], actual free: [14.119771122932434%]
after allocating [[restored-xxx][0], node[null], [P], recovery_source[snapshot recovery [Om66xSJqTw2raoNyKxsNWg] from xxx/W5Yea4QuR2yyZ4iM44fumg], s[UNASSIGNED], unassigned_info[[reason=NEW_INDEX_RESTORED], at[2022-03-02T10:56:58.210Z], delayed=false, details[restore_source[xxx]], allocation_status[fetching_shard_data]]] node [GTXrECDRRmGkkAnB48hPqw] would have more than the allowed 10% free disk threshold (8.7% free), preventing allocation
Resolutions
Review the topic for your deployment architecture:
To learn more, review the following topics:
Symptom
During the routine system maintenance performed by Elastic, it might happen that a node moves to a different host. If the indices are not configured with replica shards, the shard data on the Elasticsearch node that is moved will be lost, and you might get one or more of these messages:
cannot allocate because a previous copy of the primary shard existed but can no longer be found on the nodes in the cluster
Resolutions
Configure an highly available cluster to keep your service running. Also, consider taking the following actions to bring your deployment back to health and recover your data from the snapshot.
- Close the red indices
- Restore the indices from the last successful snapshot
For more information, check also Designing for resilience.
Symptom
When shards cannot be assigned, due to data tier allocation or attribute-based allocation, you might get one or more of these messages:
node does not match index setting [index.routing.allocation.include] filters [node_type:\"cold\"]
index has a preference for tiers [data_cold] and node does not meet the required [data_cold] tier
index has a preference for tiers [data_cold,data_warm,data_hot] and node does not meet the required [data_cold] tier
index has a preference for tiers [data_warm,data_hot] and node does not meet the required [data_warm] tier
this node's data roles are exactly [data_frozen] so it may only hold shards from frozen searchable snapshots, but this index is not a frozen searchable snapshot
Resolutions
- Make sure nodes are available in each data tier and have sufficient disk space.
- Check the index settings and ensure shards can be allocated to the expected data tier.
- Check the ILM policy and check for issues with the allocate action.
- Inspect the index templates and check for issues with the index settings.
Symptom
Unassigned replica shards are often caused by there being fewer eligible data nodes than the configured number_of_replicas.
Resolutions
- Add more eligible data nodes or more availability zones to ensure resiliency.
- Adjust the
number_of_replicassetting for your indices to the number of eligible data nodes -1.
Symptom
Some snapshots operations might be impacted, as shown in the following example:
failed shard on node [Yc_Jbf73QVSVYSqZT8HPlA]: failed recovery, failure RecoveryFailedException[[restored-my_index-2021.32][1]: … SnapshotMissingException[[found-snapshots:2021.08.25-my_index-2021.32-default_policy-_j2k8it9qnehe1t-2k0u6a/iOAoyjWLTyytKkW3_wF1jw] is missing]; nested: NoSuchFileException[Blob object [snapshots/52bc3ae2030a4df8ab10559d1720a13c/indices/WRlkKDuPSLW__M56E8qbfA/1/snap-iOAoyjWLTyytKkW3_wF1jw.dat] not found: The specified key does not exist. (Service: Amazon S3; Status Code: 404; Error Code: NoSuchKey; Request ID: 4AMTM1XFMTV5F00V; S3 Extended Request ID:
Resolutions
Upgrade to Elasticsearch version 7.17.0 or later, which resolves bugs that affected snapshot operations in earlier versions. Check Upgrade versions for more details.
If you can’t upgrade, you can recreate the snapshot repository as a workaround.
The bugs also affect searchable snapshots. If you still have data in the cluster but cannot restore from the searchable snapshot, you can try reindexing and recreating the searchable snapshot:
- Reindex all the affected indices to new regular indices
- Remove the affected frozen indices
- Take the snapshot and mount the indices again
Symptom
The parameter cluster.max_shards_per_node limits the total number of primary and replica shards for the cluster. If your cluster has a number of shards beyond this limit, you might get the following message:
Validation Failed: 1: this action would add [2] shards, but this cluster currently has [1000]/[1000] maximum normal shards open
Resolutions
Delete unnecessary indices, add more data nodes, and avoid oversharding as too many shards can overwhelm your cluster. If you cannot take these actions, and you’re confident your changes won’t destabilize the cluster, you can temporarily increase the limit using the cluster update settings API and retry the action. For more details, check Troubleshoot shard-related errors.
Symptom
The cluster will attempt to allocate a shard a few times, before giving up and leaving the shard unallocated. On Elasticsearch Service, index.allocation.max_retries defaults to 5. If allocation fails after the maximum number of retries, you might get the following message:
shard has exceeded the maximum number of retries [%d] on failed allocation attempts - manually call [/_cluster/reroute?retry_failed=true] to retry, [%s]
Resolutions
Run POST /_cluster/reroute?retry_failed=true API to retry. If it still fails, rerun the Cluster allocation explain API to diagnose the problem.