Nodes
Elastic Cloud Hosted
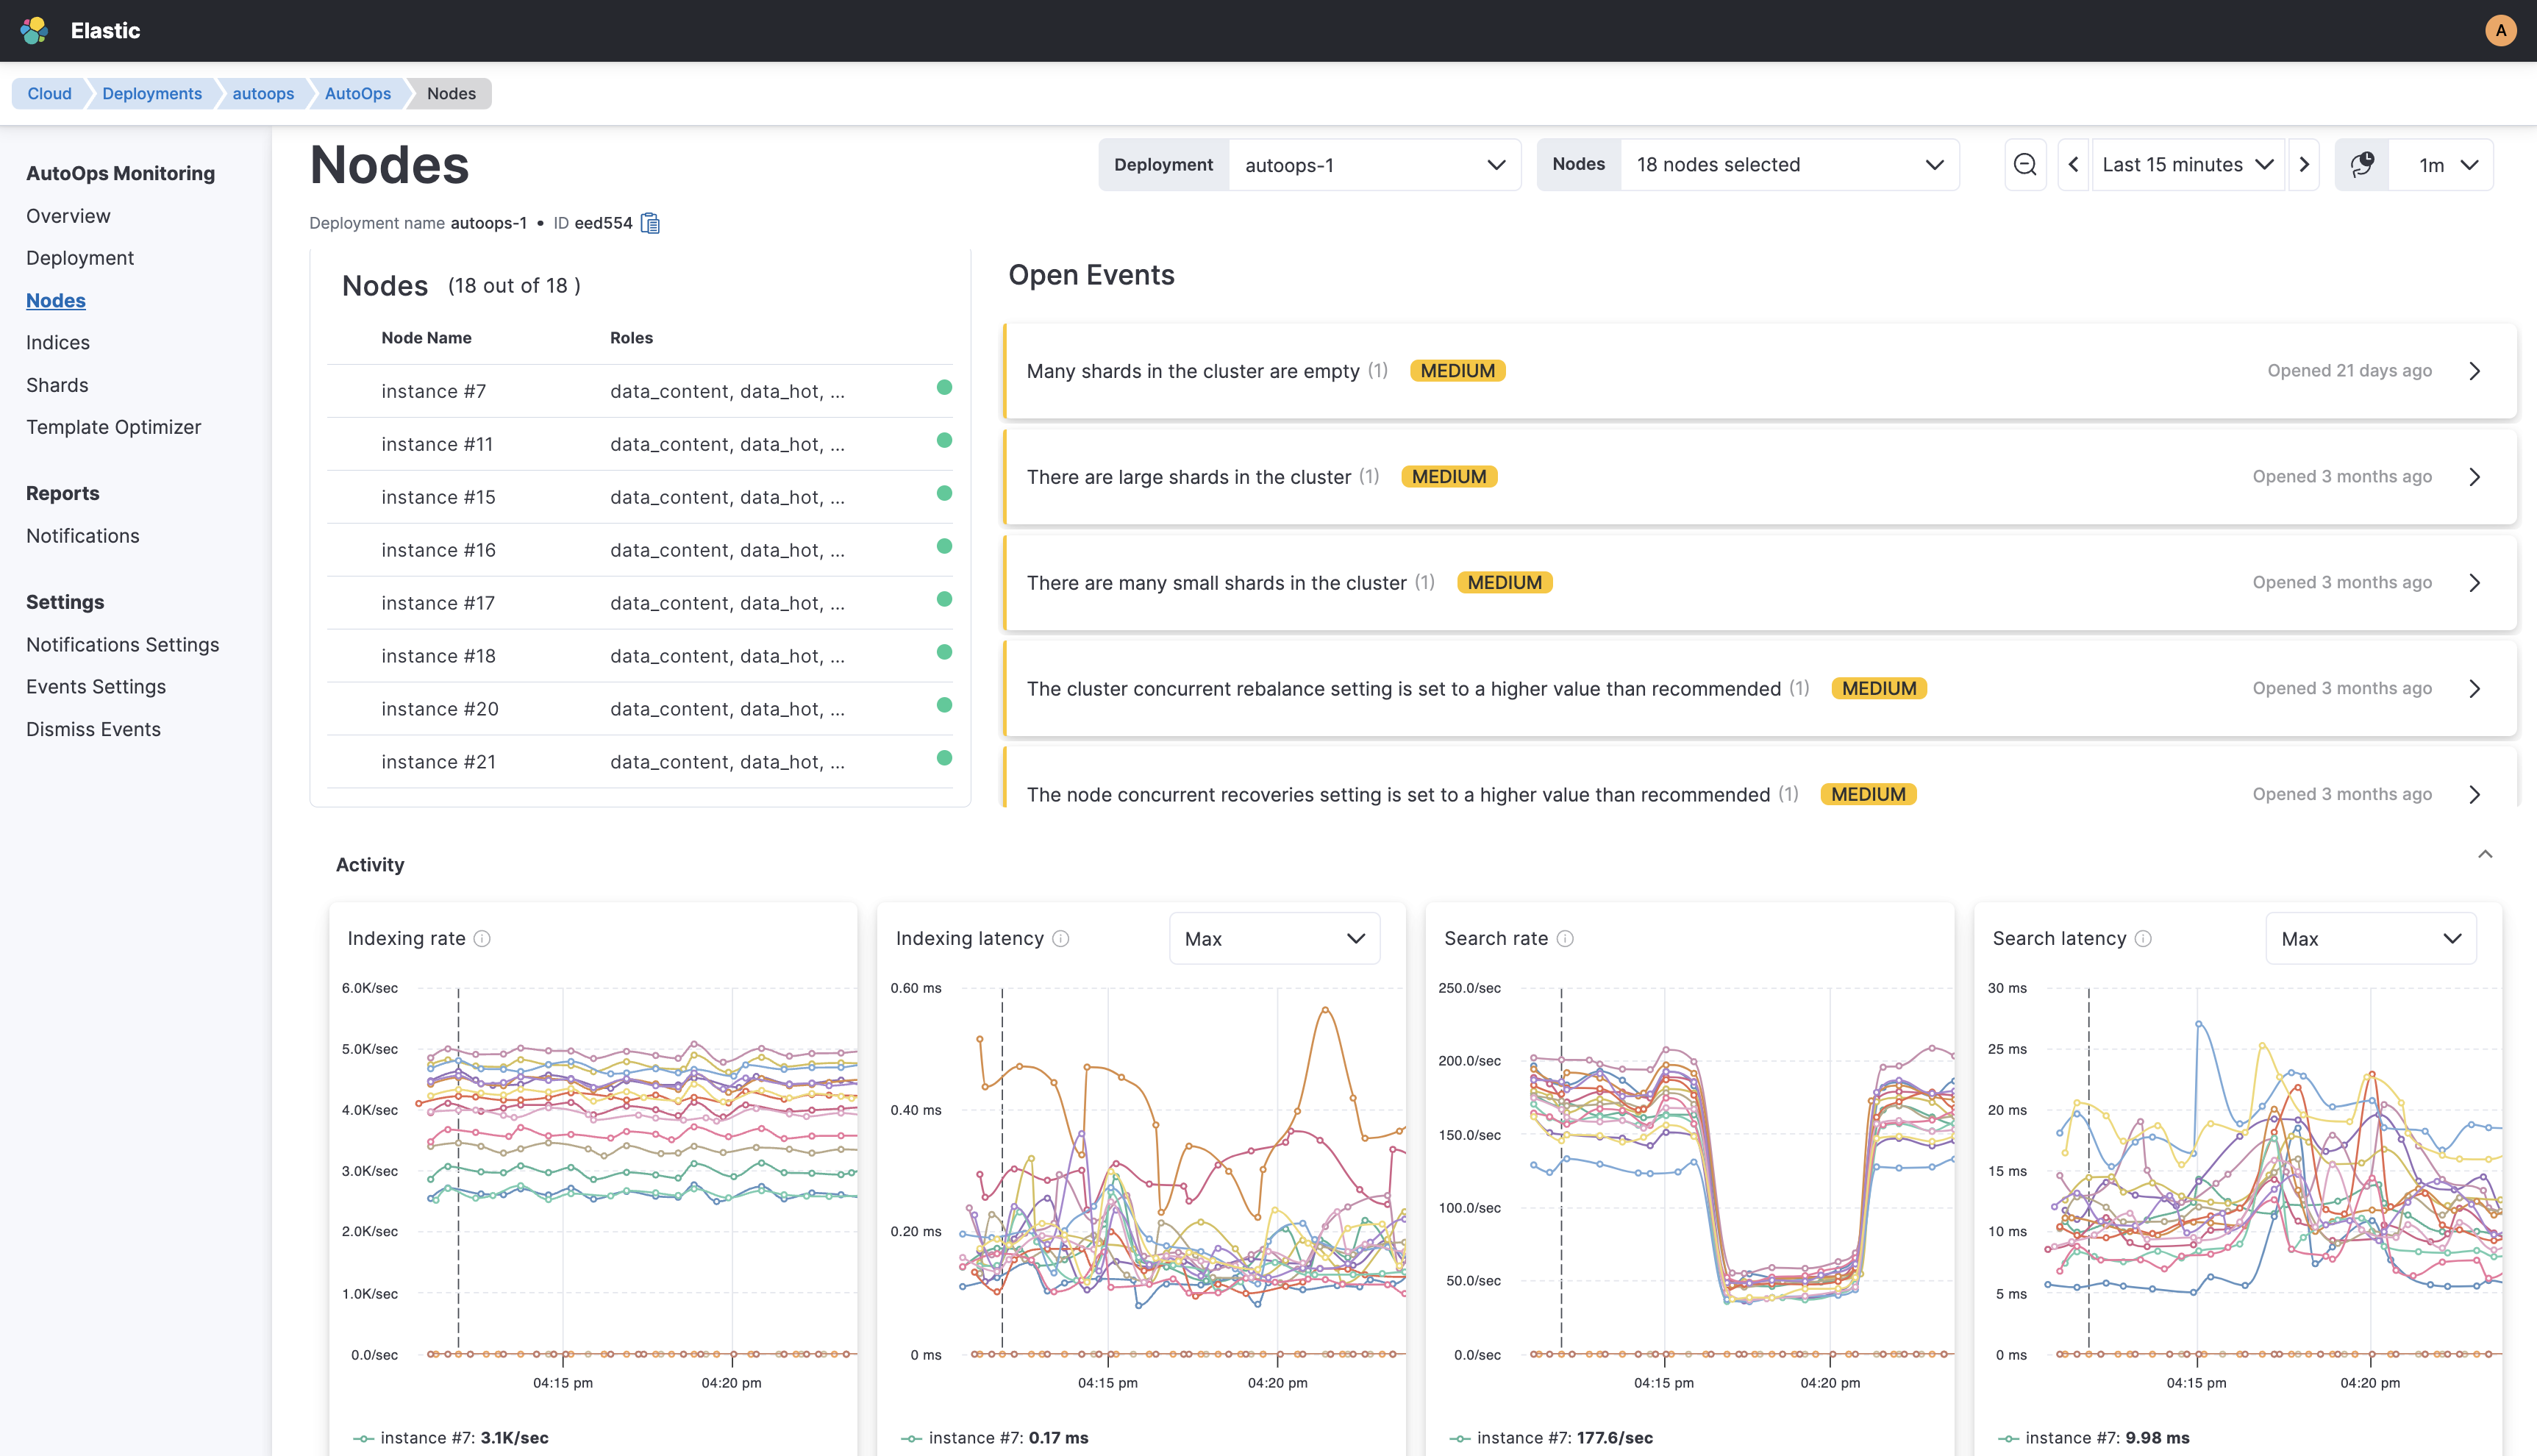
The Nodes view provides a thorough overview on the essential metrics for all monitored deployment nodes. You can delve into specific nodes to observe metrics over extended periods. This includes data on the indexing rate and latency, search rate and latency, as well as details concerning thread pools, data, circuit breakers, network, disk, and additional elements.

Similar to the Deployment view, the list of open events is sorted by severity and open time.
The following table lists all the nodes used by the Deployment Elasticsearch cluster, presenting node name, role and status. The elected master node will be marked with a start sign.
| Area | Metrics name | Metrics description |
|---|---|---|
| Activity | Indexing rate | Number of documents being indexed per second on all primary and replica shards hosted on the node. |
| Indexing latency | Average latency for indexing documents, which is the time it takes to index documents divided by the number that were indexed in all primary and replica shards hosted on the node. | |
| Search rate | Number of search requests being executed per second on all shards hosted on the node. | |
| Search latency | Average latency for searching, which is the time it takes to execute searches divided by the number of searches submitted to the node. | |
| Host and Process | Load | Load average of the node over the last five minutes. |
| CPU | Percentage of the CPU usage for the Elasticsearch process running on the node. | |
| Heap used in bytes | Total JVM heap memory used by the Elasticsearch process running on the node. | |
| GC | Average time spent doing GC in milliseconds on the node. | |
| Thread pools | Write | Number of index, bulk and write operations in the queue, as well as the total number of completed and rejected operations in those pools. |
| Search | Number of search operations in the queue, as well as the total number of completed and rejected operations in that pool. | |
| Management | Number of management operations in the queue, as well as the total number of completed and rejected operations in that pool. | |
| Snapshot | Number of snapshot operations in the queue, as well as the total number of completed and rejected operations in that pool. | |
| Data | Disk usage | Amount of used disk storage on the node. |
| Shards count | Number of primary and replica shards hosted on the node. | |
| Segment count | Number of segments hosted on the node. | |
| Documents count | Number of documents hosted on the node. | |
| HTTP | HTTP current open | Current number of open HTTP connections for the node. |
| HTTP connections open rate | Number of HTTP connections opened per second. | |
| Circuit breakers | Parent Used | Estimated memory used for the parent circuit breaker. |
| Field Data used | Estimated memory used for the field data circuit breaker. | |
| Request used | Estimated memory used for the request circuit breaker. | |
| Parent tripped | Total number of times the parent circuit breaker has been triggered and prevented an out-of-memory error. | |
| Field data tripped | Total number of times the field data circuit breaker has been triggered and prevented an-out-of memory error. | |
| Request tripped | Total number of times the request circuit breaker has been triggered and prevented an out-of-memory error. | |
| Network | Network rx bytes | Size of RX packets received by the node during internal cluster communication. |
| Network rx count | Total number of RX packets received by the node during internal cluster communication. | |
| Network tx bytes | Size of TX packets sent by the node during internal cluster communication. | |
| Network tx count | Total number of TX packets received by the node during internal cluster communication. | |
| Disk | Disk read bytes | The total number of bytes read across all devices used by Elasticsearch. |
| Disk read IOPS | The total number of completed read operations across all devices used by Elasticsearch. | |
| Disk write bytes | The total number of bytes written across all devices used by Elasticsearch. | |
| Disk write IOPS | The total number of completed write operations across all devices used by Elasticsearch. | |
| Activity-Additional | Merge rate | Number of merge operations being executed per second on all shards hosted on the node. |
| Merge latency | Average latency for merging, which is the time it takes to execute merges divided by the number of merge operations submitted to the node. | |
| Indexing failed | Number of failed indexing operations on the node. |