IMPORTANT: No additional bug fixes or documentation updates
will be released for this version. For the latest information, see the
current release documentation.
Add a choropleth layer
edit
IMPORTANT: This documentation is no longer updated. Refer to Elastic's version policy and the latest documentation.
Add a choropleth layer
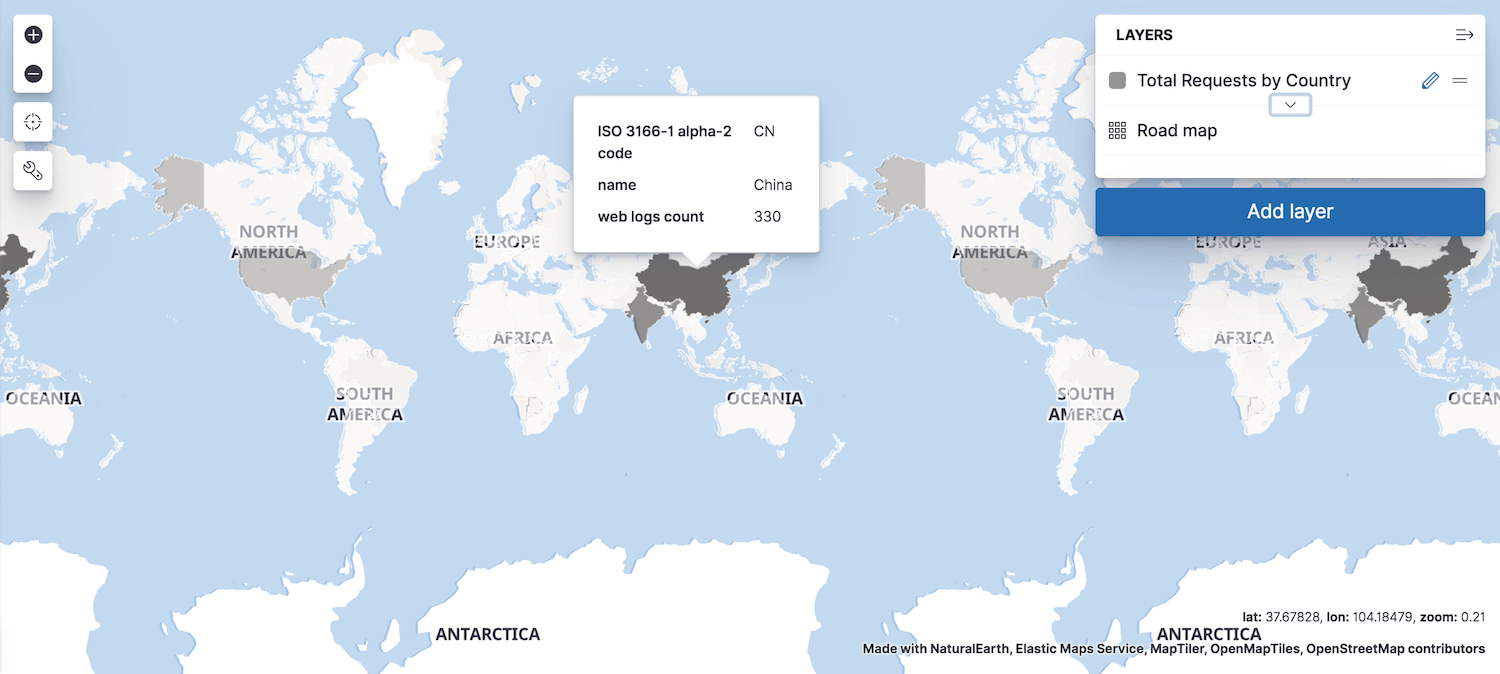
editNow that you have a map, you’ll want to add layers to it. The first layer you’ll add is a choropleth layer to shade world countries by web log traffic. Darker shades symbolize countries with more web log traffic, and lighter shades symbolize countries with less traffic.
- Click Add layer.
- Select Choropleth.
- From the Layer dropdown menu, select World Countries.
- Under Statistics source, set Index pattern to kibana_sample_data_logs.
- Set Join field to geo.src.
- Click the Add layer button.
-
Set Name to
Total Requests by Country. - Set Opacity to 50%.
- Click Add under Tooltip fields.
- In the popover, select ISO 3166-1 alpha-2 code and name and click Add.
- Under Fill color, select the grey color ramp.
- Under Border color, change the selected color to white.
-
Click Save & close.
Your map now looks like this:
