Tutorial: Updating Kibana filters from Vega
editTutorial: Updating Kibana filters from Vega
editIn this tutorial you will build an area chart in Vega using an Elasticsearch search query, and add a click handler and drag handler to update Kibana filters. This tutorial is not a full Vega tutorial, but will cover the basics of creating Vega visualizations into Kibana.
First, create an almost-blank Vega chart by pasting this into the editor:
{
  $schema: "https://vega.github.io/schema/vega/v5.json"
  data: [{
    name: source_0
  }]

  scales: [{
    name: x
    type: time
    range: width
  }, {
    name: y
    type: linear
    range: height
  }]

  axes: [{
    orient: bottom
    scale: x
  }, {
    orient: left
    scale: y
  }]

  marks: [
    {
      type: area
      from: {
        data: source_0
      }
      encode: {
        update: {
        }
      }
    }
  ]
}
Despite being almost blank, this Vega spec still contains the minimum requirements:
- Data
- Scales
- Marks
- (optional) Axes
Next, add a valid Elasticsearch search query in the data block:
  data: [
    {
      name: source_0
      url: {
        %context%: true
        %timefield%: order_date
        index: kibana_sample_data_ecommerce
        body: {
          aggs: {
            time_buckets: {
              date_histogram: {
                field: order_date
                fixed_interval: "3h"
                extended_bounds: {
                  min: {%timefilter%: "min"}
                  max: {%timefilter%: "max"}
                }
                min_doc_count: 0
              }
            }
          }
          size: 0
        }
      }
      format: { property: "aggregations.time_buckets.buckets" }
    }
  ]
Click "Update", and nothing will change in the visualization. The first step is to change the X and Y scales based on the data:
  scales: [{
    name: x
    type: time
    range: width
    domain: {
      data: source_0
      field: key
    }
  }, {
    name: y
    type: linear
    range: height
    domain: {
      data: source_0
      field: doc_count
    }
  }]
Click "Update", and you will see that the X and Y axes are now showing labels based on the real data.
Next, encode the fields key and doc_count as the X and Y values:
  marks: [
    {
      type: area
      from: {
        data: source_0
      }
      encode: {
        update: {
          x: {
            scale: x
            field: key
          }
          y: {
            scale: y
            value: 0
          }
          y2: {
            scale: y
            field: doc_count
          }
        }
      }
    }
  ]
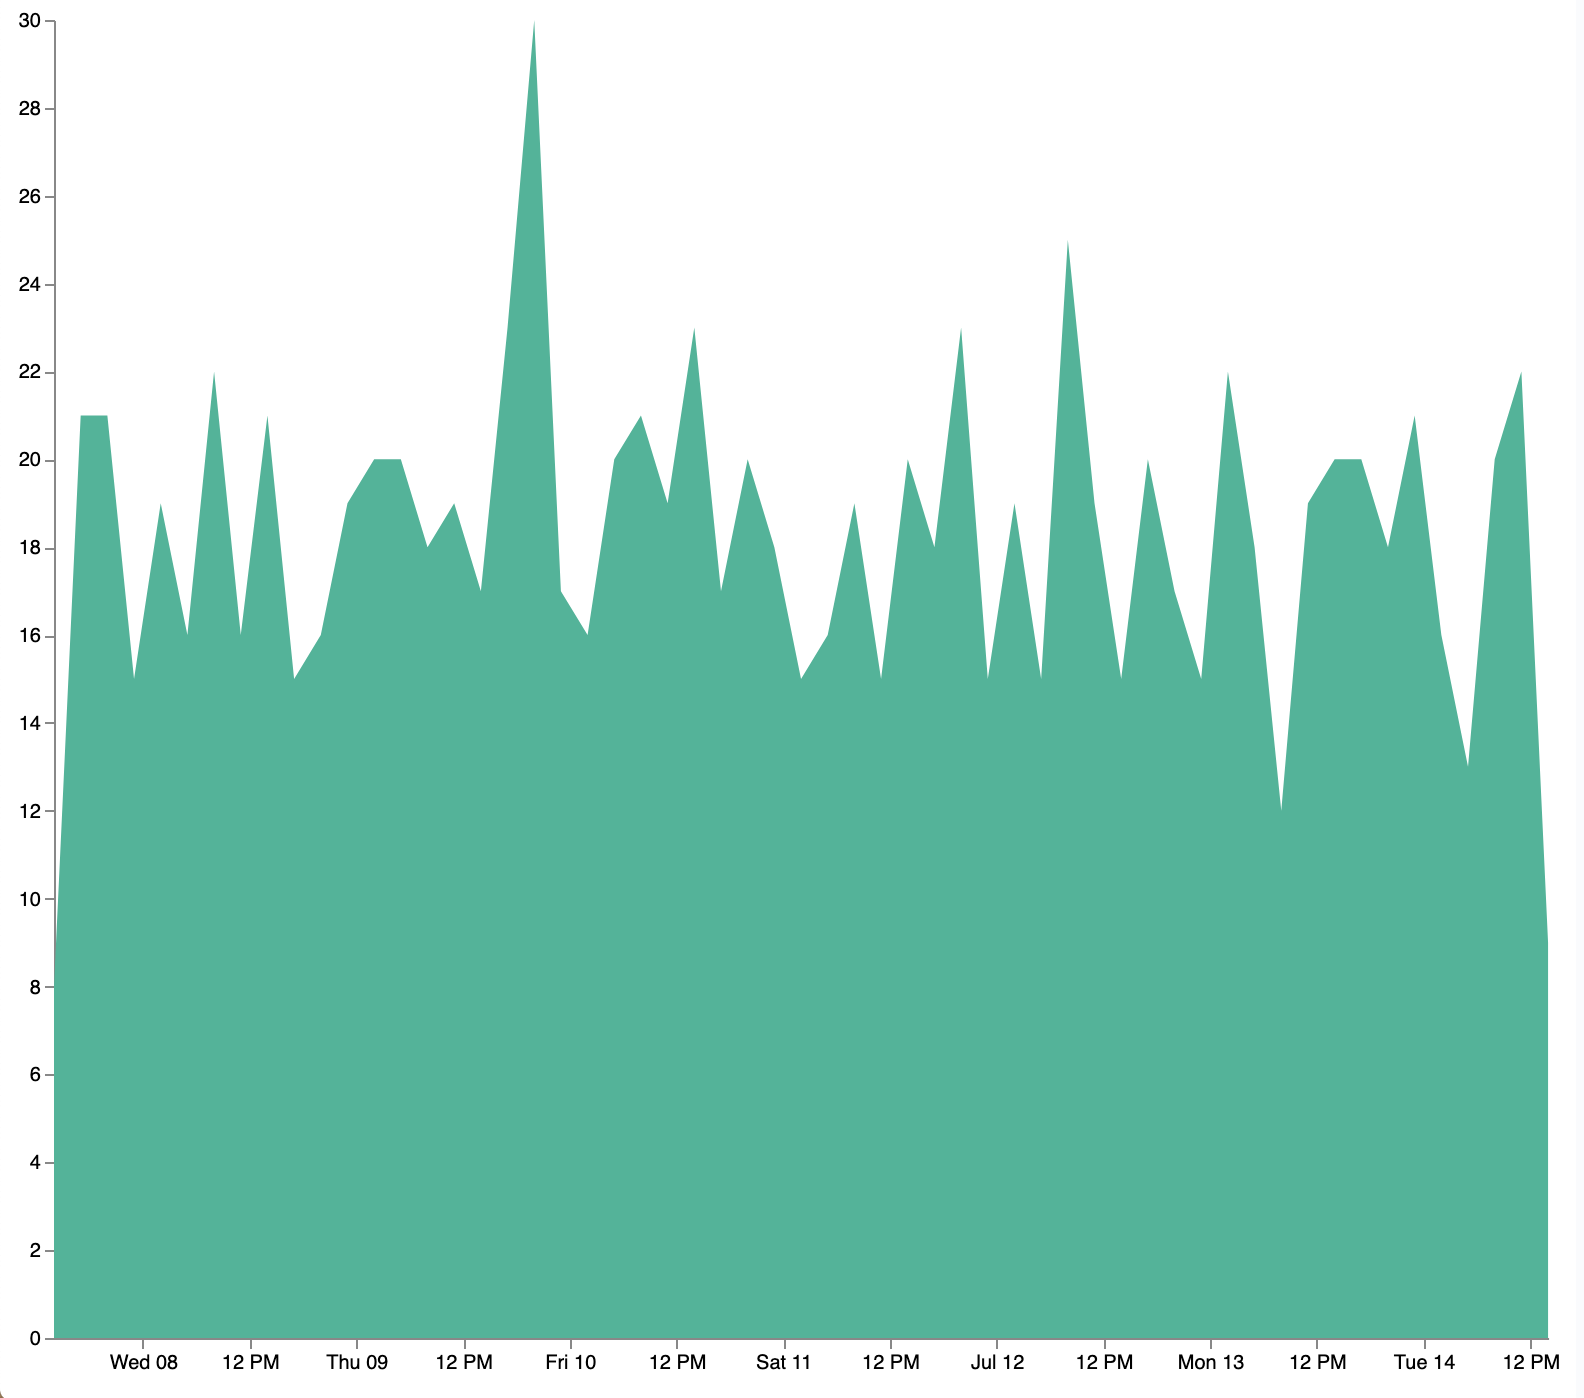
Click "Update" and you will get a basic area chart:
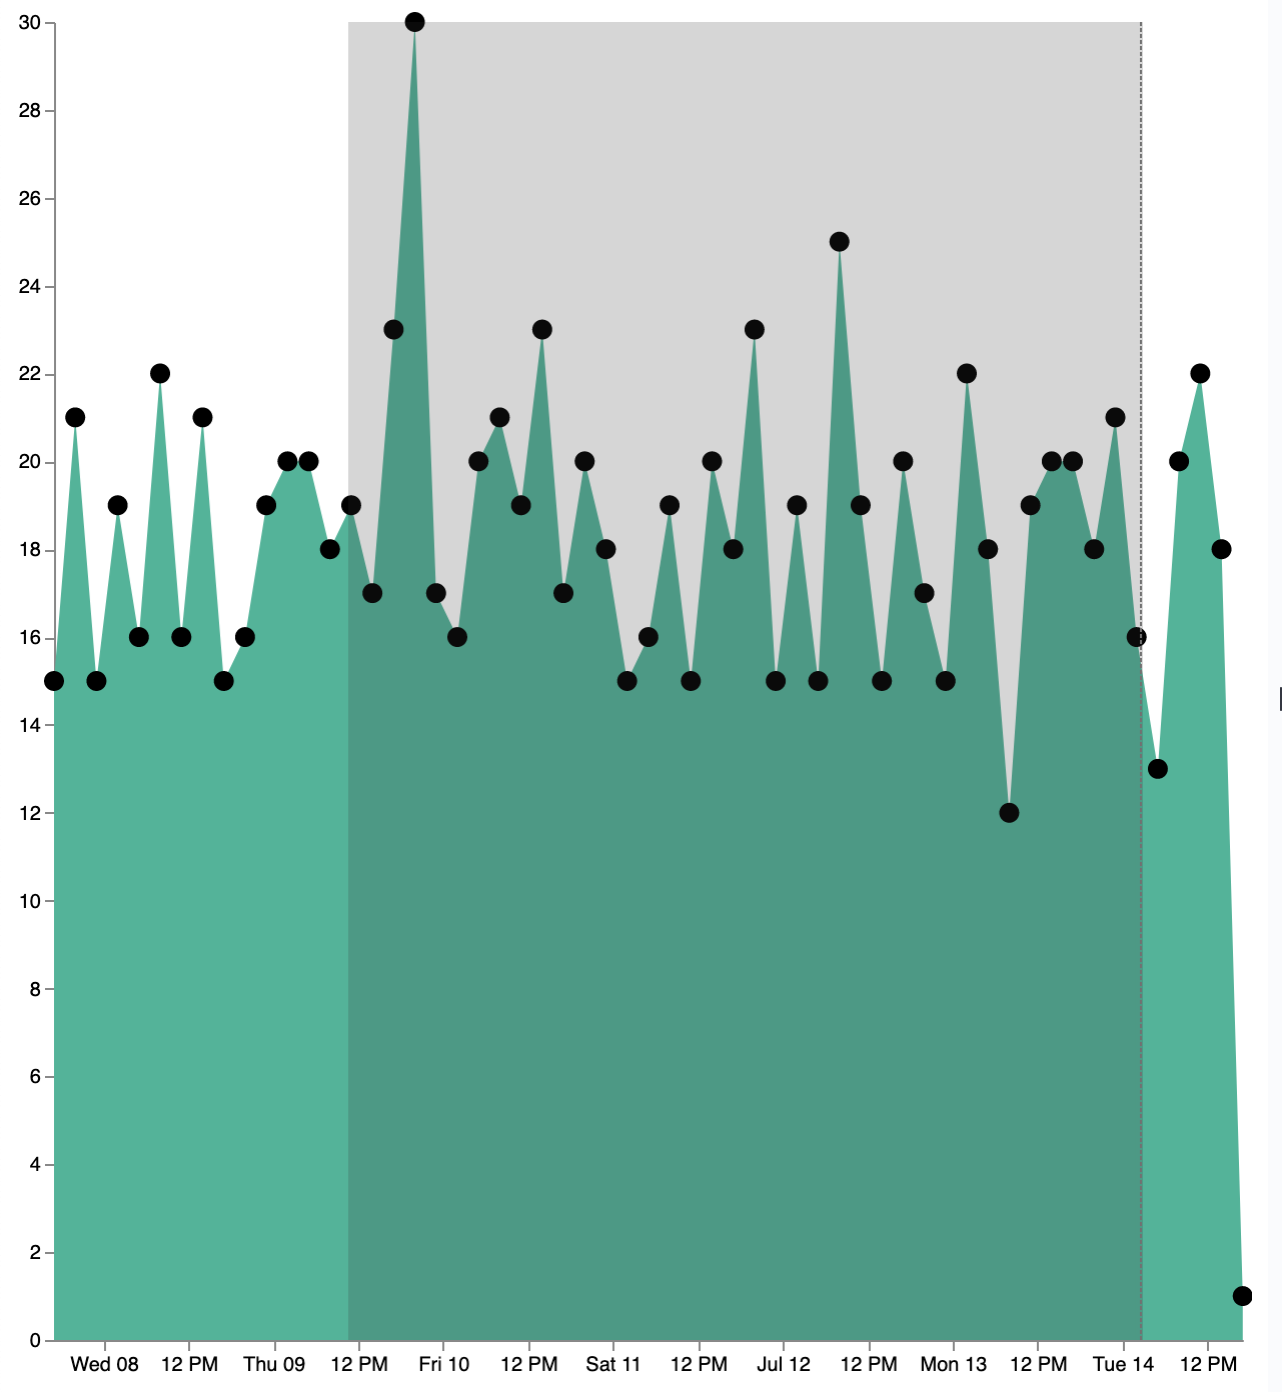
Next, add a new block to the marks section. This will show clickable points to filter for a specific
date:
  {
    name: point
    type: symbol
    style: ["point"]
    from: {
      data: source_0
    }
    encode: {
      update: {
        x: {
          scale: x
          field: key
        }
        y: {
          scale: y
          field: doc_count
        }
        size: {
          value: 100
        }
        fill: {
          value: black
        }
      }
    }
  }
Next, we will create a Vega signal to make the points clickable. You can access
the clicked datum in the expression used to update. In this case, you want
clicks on points to add a time filter with the 3-hour interval defined above.
  signals: [
    {
      name: point_click
      on: [{
        events: {
          source: scope
          type: click
          markname: point
        }
        update: '''kibanaSetTimeFilter(datum.key, datum.key + 3 * 60 * 60 * 1000)'''
      }]
    }
  ]
This event is using the Kibana custom function kibanaSetTimeFilter to generate a filter that
gets applied to the entire dashboard on click.
The mouse cursor does not currently indicate that the chart is interactive. Find the marks section,
and update the mark named point by adding cursor: { value: "pointer" } to
the encoding section like this:
  {
    name: point
    type: symbol
    style: ["point"]
    from: {
      data: source_0
    }
    encode: {
      update: {
        ...
        cursor: { value: "pointer" }
      }
    }
  }
Next, we will add a drag interaction which will allow the user to narrow into a specific time range in the visualization. This will require adding more signals, and adding a rectangle overlay:
The first step is to add a new signal to track the X position of the cursor:
    {
      name: currentX
      value: -1
      on: [{
        events: {
          type: mousemove
          source: view
        },
        update: "clamp(x(), 0, width)"
      }, {
        events: {
          type: mouseout
          source: view
        }
        update: "-1"
      }]
    }
Now add a new mark to indicate the current cursor position:
    {
      type: rule
      interactive: false
      encode: {
        update: {
          y: {value: 0}
          y2: {signal: "height"}
          stroke: {value: "gray"}
          strokeDash: {
            value: [2, 1]
          }
          x: {signal: "max(currentX,0)"}
          defined: {signal: "currentX > 0"}
        }
      }
    }
Next, add a signal to track the current selected range, which will update until the user releases the mouse button or uses the escape key:
    {
      name: selected
      value: [0, 0]
      on: [{
        events: {
          type: mousedown
          source: view
        }
        update: "[clamp(x(), 0, width), clamp(x(), 0, width)]"
      }, {
        events: {
          type: mousemove
          source: window
          consume: true
          between: [{
            type: mousedown
            source: view
          }, {
            merge: [{
              type: mouseup
              source: window
            }, {
              type: keydown
              source: window
              filter: "event.key === 'Escape'"
            }]
          }]
        }
        update: "[selected[0], clamp(x(), 0, width)]"
      }, {
        events: {
          type: keydown
          source: window
          filter: "event.key === 'Escape'"
        }
        update: "[0, 0]"
      }]
    }
Now that there is a signal which tracks the time range from the user, we need to indicate the range visually by adding a new mark which only appears conditionally:
    {
      type: rect
      name: selectedRect
      encode: {
        update: {
          height: {signal: "height"}
          fill: {value: "#333"}
          fillOpacity: {value: 0.2}
          x: {signal: "selected[0]"}
          x2: {signal: "selected[1]"}
          defined: {signal: "selected[0] !== selected[1]"}
        }
      }
    }
Finally, add a new signal which will update the Kibana time filter when the mouse is released while dragging:
    {
      name: applyTimeFilter
      value: null
      on: [{
        events: {
          type: mouseup
          source: view
        }
        update: '''selected[0] !== selected[1] ? kibanaSetTimeFilter(
               invert('x',selected[0]),
               invert('x',selected[1])) : null'''
      }]
    }
Putting this all together, your visualization now supports the main features of standard visualizations in Kibana, but with the potential to add even more control. The final Vega spec for this tutorial is here:
Expand final Vega spec
{
  $schema: "https://vega.github.io/schema/vega/v5.json"
  data: [
    {
      name: source_0
      url: {
        %context%: true
        %timefield%: order_date
        index: kibana_sample_data_ecommerce
        body: {
          aggs: {
            time_buckets: {
              date_histogram: {
                field: order_date
                fixed_interval: "3h"
                extended_bounds: {
                  min: {%timefilter%: "min"}
                  max: {%timefilter%: "max"}
                }
                min_doc_count: 0
              }
            }
          }
          size: 0
        }
      }
      format: { property: "aggregations.time_buckets.buckets" }
    }
  ]

  scales: [{
    name: x
    type: time
    range: width
    domain: {
      data: source_0
      field: key
    }
  }, {
    name: y
    type: linear
    range: height
    domain: {
      data: source_0
      field: doc_count
    }
  }]

  axes: [{
    orient: bottom
    scale: x
  }, {
    orient: left
    scale: y
  }]

  marks: [
    {
      type: area
      from: {
        data: source_0
      }
      encode: {
        update: {
          x: {
            scale: x
            field: key
          }
          y: {
            scale: y
            value: 0
          }
          y2: {
            scale: y
            field: doc_count
          }
        }
      }
    },
    {
      name: point
      type: symbol
      style: ["point"]
      from: {
        data: source_0
      }
      encode: {
        update: {
          x: {
            scale: x
            field: key
          }
          y: {
            scale: y
            field: doc_count
          }
          size: {
            value: 100
          }
          fill: {
            value: black
          }
          cursor: { value: "pointer" }
        }
      }
    },
    {
      type: rule
      interactive: false
      encode: {
        update: {
          y: {value: 0}
          y2: {signal: "height"}
          stroke: {value: "gray"}
          strokeDash: {
            value: [2, 1]
          }
          x: {signal: "max(currentX,0)"}
          defined: {signal: "currentX > 0"}
        }
      }
    },
    {
      type: rect
      name: selectedRect
      encode: {
        update: {
          height: {signal: "height"}
          fill: {value: "#333"}
          fillOpacity: {value: 0.2}
          x: {signal: "selected[0]"}
          x2: {signal: "selected[1]"}
          defined: {signal: "selected[0] !== selected[1]"}
        }
      }
    }
  ]

  signals: [
    {
      name: point_click
      on: [{
        events: {
          source: scope
          type: click
          markname: point
        }
        update: '''kibanaSetTimeFilter(datum.key, datum.key + 3 * 60 * 60 * 1000)'''
      }]
    }
    {
      name: currentX
      value: -1
      on: [{
        events: {
          type: mousemove
          source: view
        },
        update: "clamp(x(), 0, width)"
      }, {
        events: {
          type: mouseout
          source: view
        }
        update: "-1"
      }]
    }
    {
      name: selected
      value: [0, 0]
      on: [{
        events: {
          type: mousedown
          source: view
        }
        update: "[clamp(x(), 0, width), clamp(x(), 0, width)]"
      }, {
        events: {
          type: mousemove
          source: window
          consume: true
          between: [{
            type: mousedown
            source: view
          }, {
            merge: [{
              type: mouseup
              source: window
            }, {
              type: keydown
              source: window
              filter: "event.key === 'Escape'"
            }]
          }]
        }
        update: "[selected[0], clamp(x(), 0, width)]"
      }, {
        events: {
          type: keydown
          source: window
          filter: "event.key === 'Escape'"
        }
        update: "[0, 0]"
      }]
    }
    {
      name: applyTimeFilter
      value: null
      on: [{
        events: {
          type: mouseup
          source: view
        }
        update: '''selected[0] !== selected[1] ? kibanaSetTimeFilter(
               invert('x',selected[0]),
               invert('x',selected[1])) : null'''
      }]
    }
  ]
}