Add your data
editAdd your data
editTo start working with your data in Kibana, use one of the many ingest options, available from the home page. You can collect data from an app or service, or upload a file that contains your data. If you’re not ready to use your own data, add a sample data set and give Kibana a test drive.
Add data
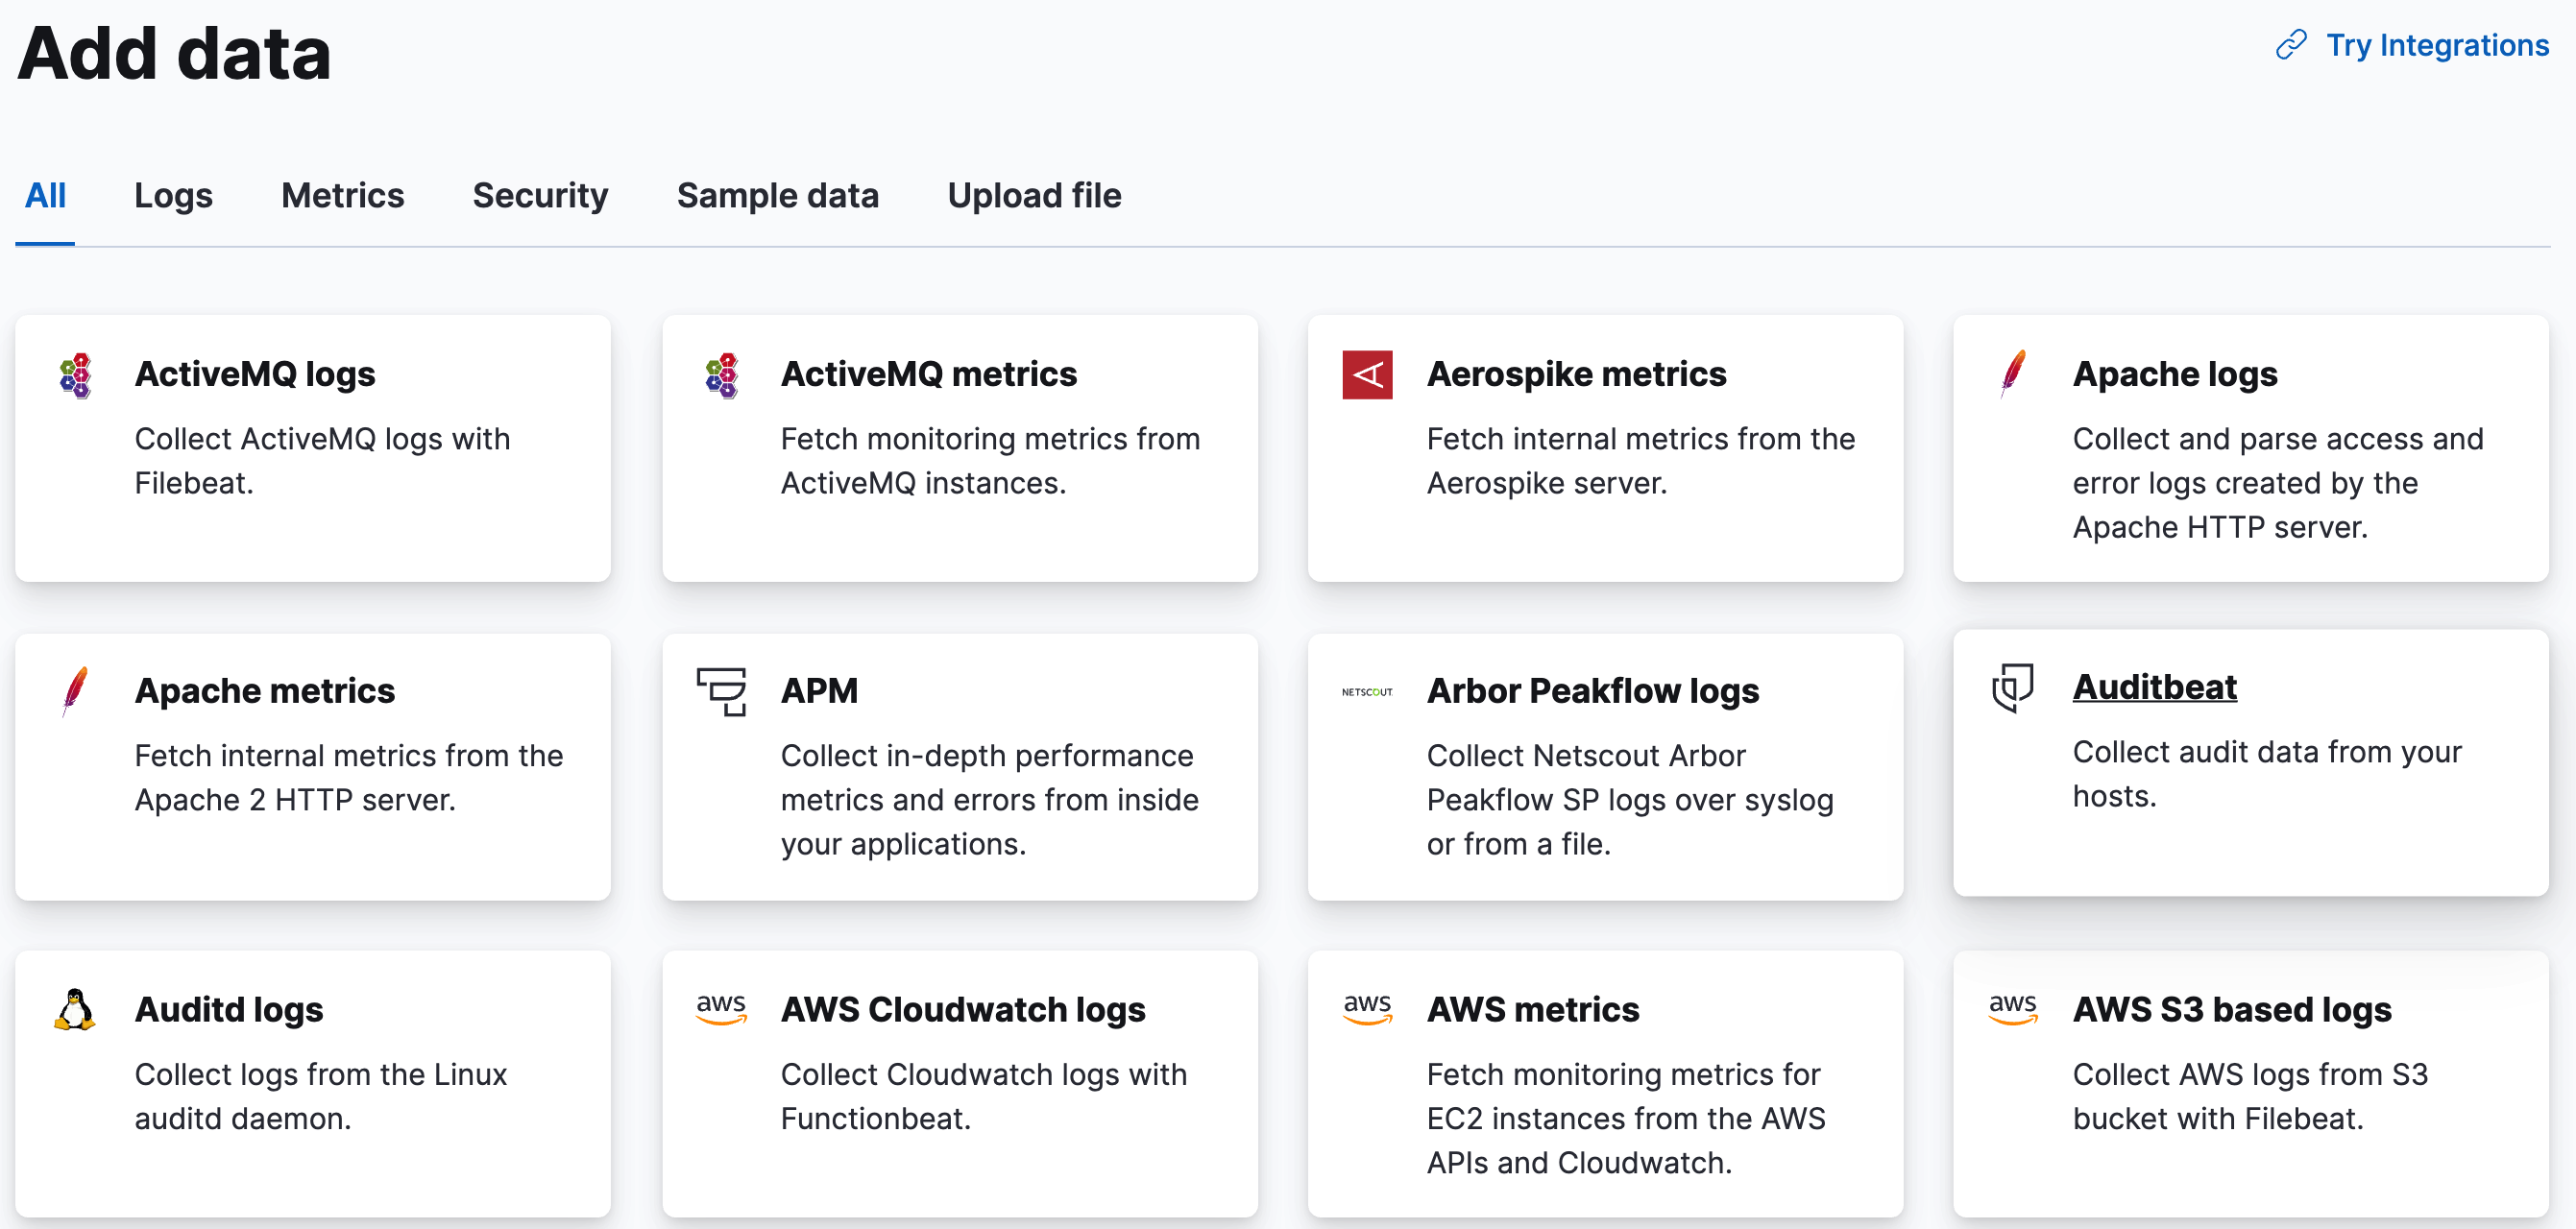
editWant to ingest logs, metrics, security, or application data? Install and configure a Beats data shipper or other module to periodically collect the data and send it to Elasticsearch. You can then use the pre-built dashboards to explore and analyze the data.
Add Elastic Agent
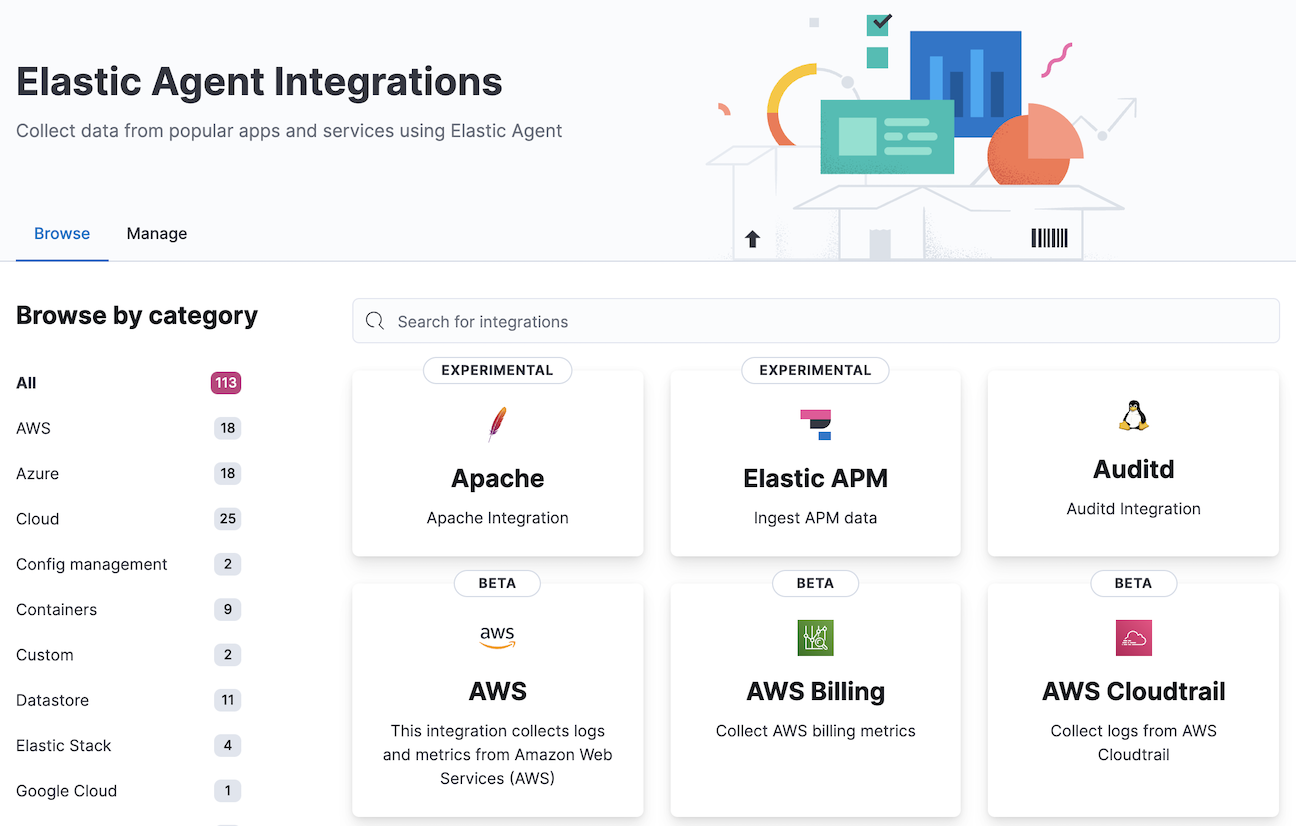
editElastic Agent is the next generation of data integration modules, offering a centralized way to set up your integrations.
With Fleet, you can add and manage integrations for popular services and platforms, providing an easy way to collect your data, and manage Elastic Agent installations in standalone or Fleet mode. The integrations ship with dashboards and visualizations, so you can quickly get insights into your data, and Fleet mode offers several advantages:
- A central place to configure and monitor your Elastic Agents.
- An overview of the data ingest in your Elasticsearch cluster.
- Multiple integrations to collect and transform data.
To get started, refer to Quick start: Get logs and metrics into the Elastic Stack.
Upload a file
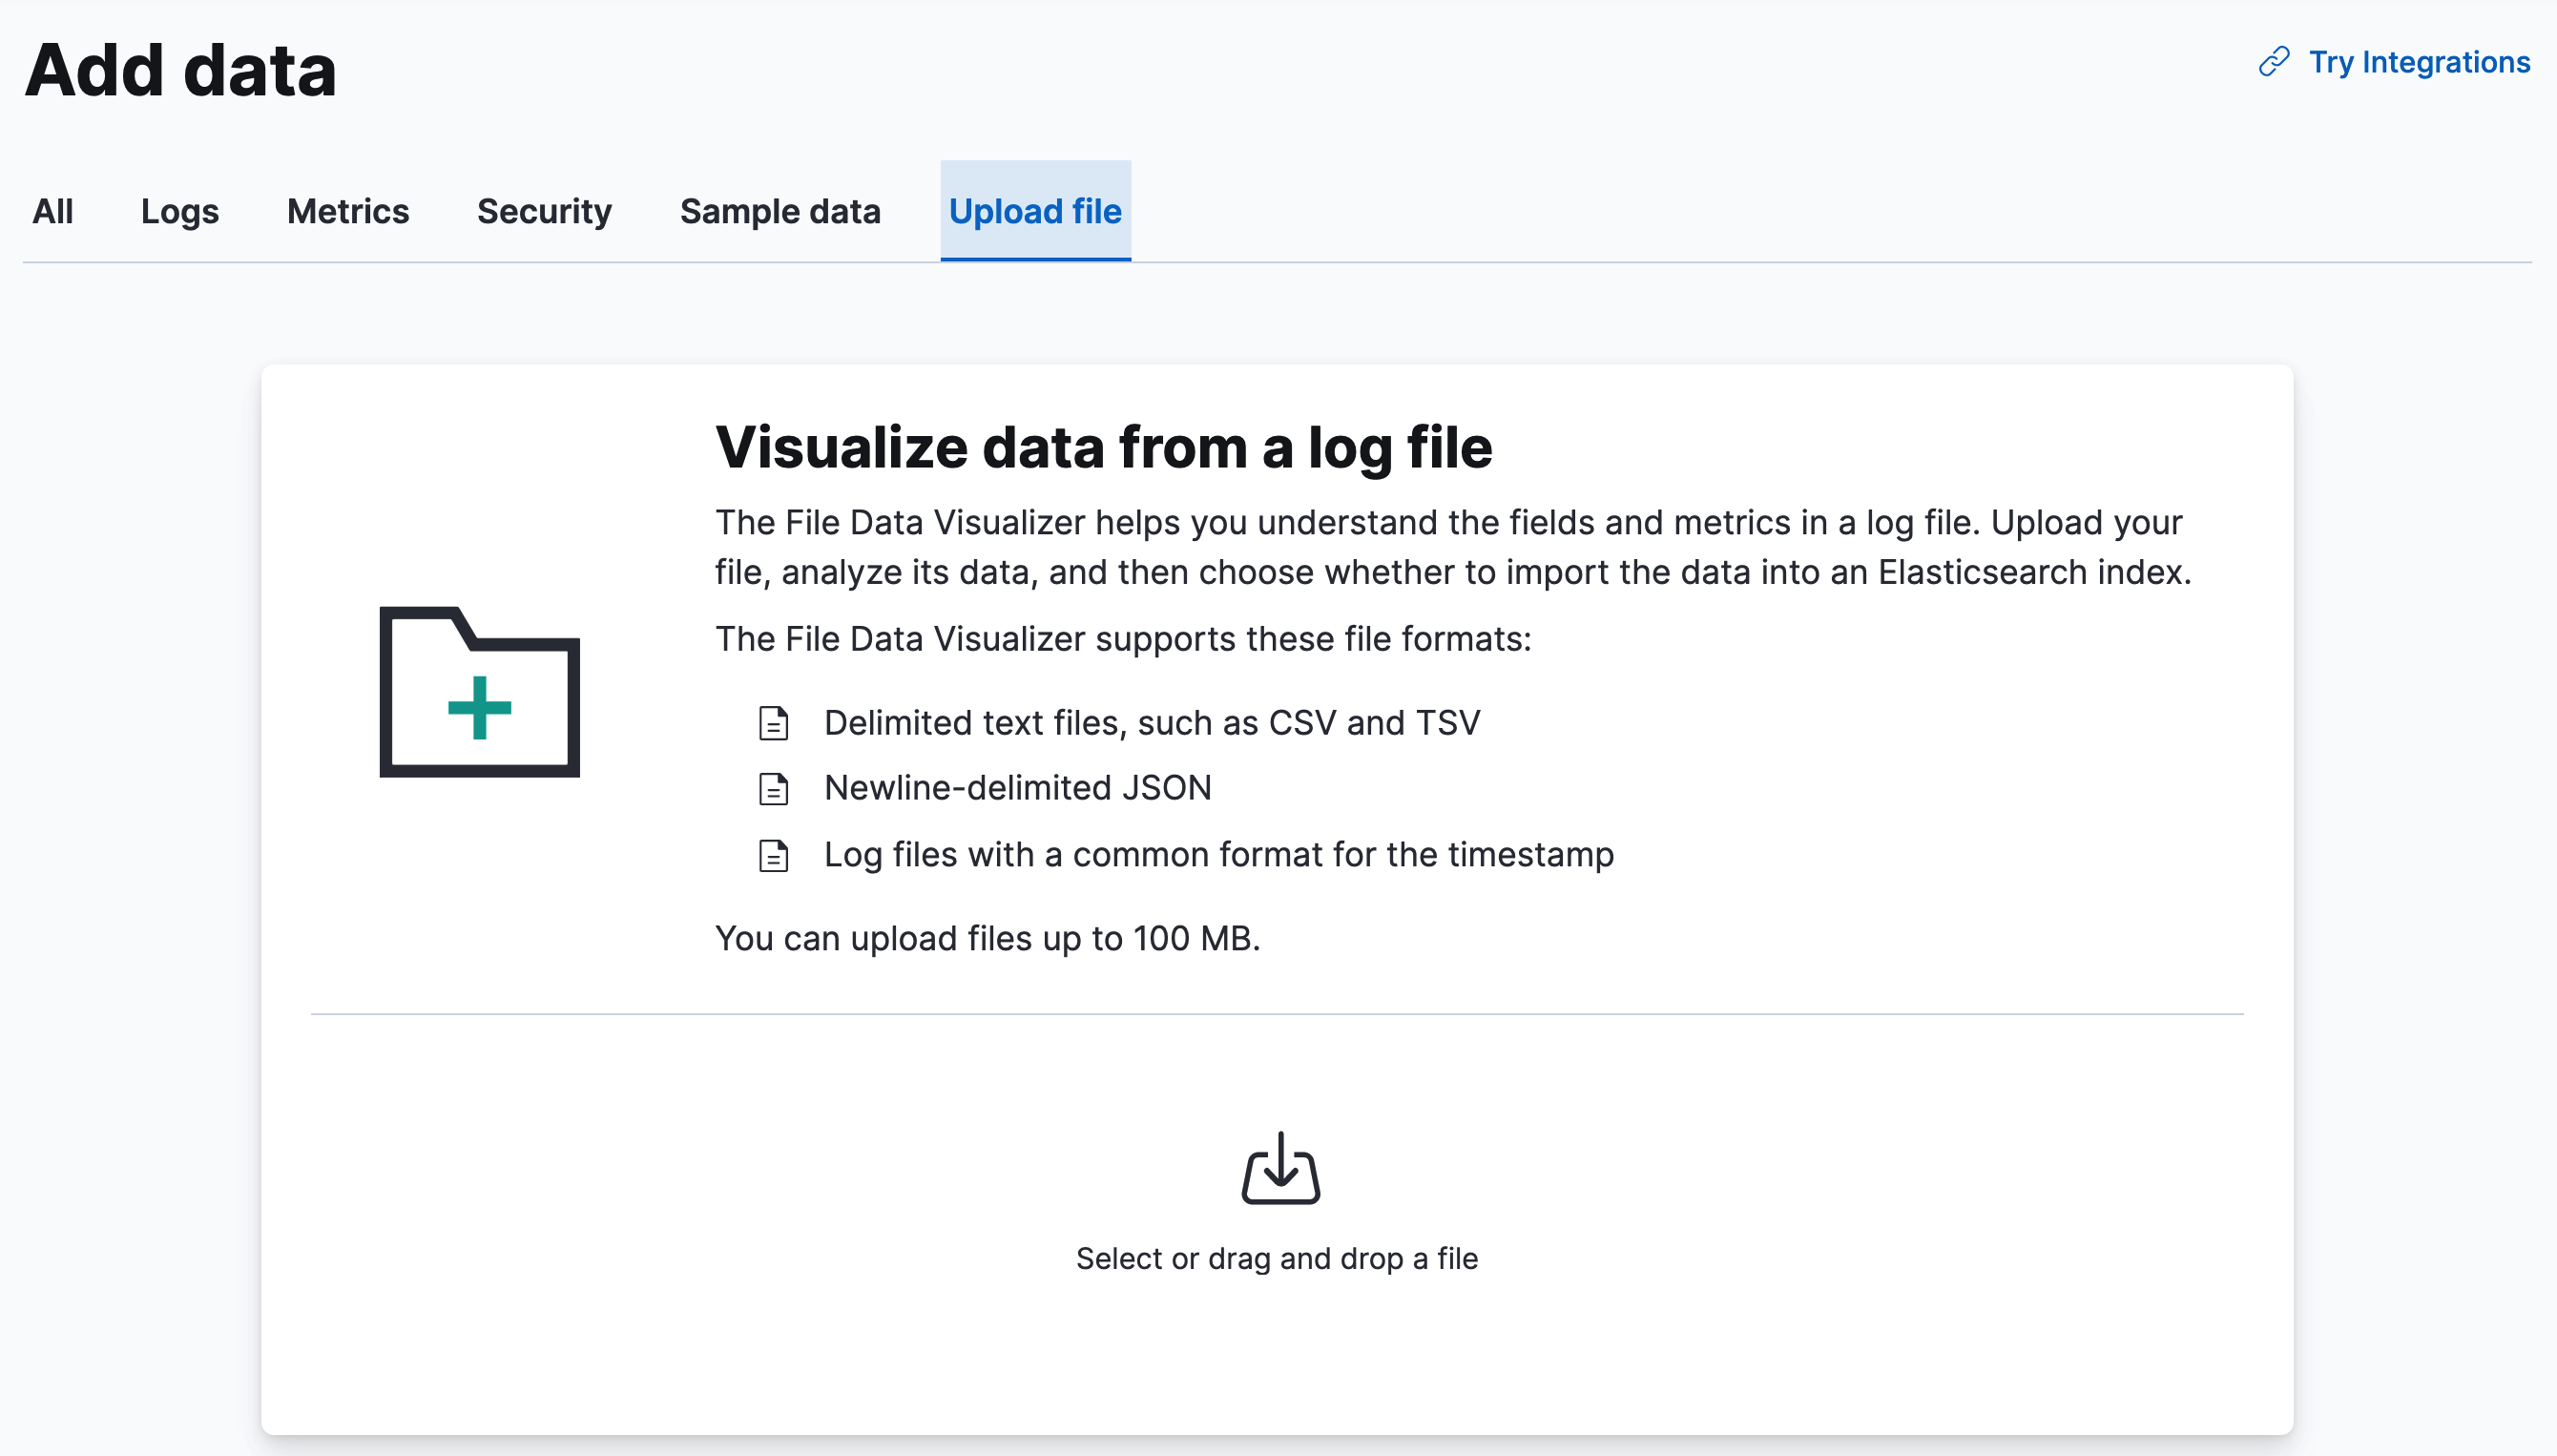
editIf you have a log file or delimited CSV, TSV, or JSON file, you can upload it, view its fields and metrics, and optionally import it into Elasticsearch.
This feature is not intended for use as part of a repeated production process, but rather for the initial exploration of your data.
You can upload a file up to 100 MB. This value is configurable up to 1 GB in Advanced Settings. To upload a file with geospatial data, refer to Import geospatial data.
The Elastic Stack security features provide roles and privileges that control which users can upload files. To upload a file in Kibana and import it into an Elasticsearch index, you’ll need:
-
allKibana privileges for Discover -
manage_pipelineormanage_ingest_pipelinescluster privilege -
create,create_index,manage, andreadindex privileges for the index
You can manage your roles, privileges, and spaces in Stack Management in Kibana. For more information, refer to Kibana role management.
Additional options for loading your data
editIf the Kibana ingest options don’t work for you, you can index your data into Elasticsearch with REST APIs or client libraries. After you add your data, you’re required to create an index pattern to tell Kibana where to find the data.
- To add data for Elastic Observability, refer to Send data to Elasticsearch.
- To add data for Elastic Security, refer to Ingest data to Elastic Security.