- Kibana Guide: other versions:
- What is Kibana?
- What’s new in 7.15
- Kibana concepts
- Quick start
- Set up
- Install Kibana
- Configure Kibana
- Alerting and action settings
- APM settings
- Banners settings
- Development tools settings
- Graph settings
- Fleet settings
- i18n settings
- Logging settings
- Logs settings
- Metrics settings
- Machine learning settings
- Monitoring settings
- Reporting settings
- Secure settings
- Search sessions settings
- Security settings
- Spaces settings
- Task Manager settings
- Telemetry settings
- URL drilldown settings
- Start and stop Kibana
- Access Kibana
- Securing access to Kibana
- Add data
- Upgrade Kibana
- Configure security
- Configure reporting
- Configure monitoring
- Production considerations
- Discover
- Dashboard and visualizations
- Canvas
- Maps
- Build a map to compare metrics by country or region
- Track, visualize, and alert on assets in real time
- Map custom regions with reverse geocoding
- Heat map layer
- Tile layer
- Vector layer
- Plot big data
- Search geographic data
- Configure map settings
- Connect to Elastic Maps Service
- Import geospatial data
- Troubleshoot
- Reporting and sharing
- Machine learning
- Graph
- Alerting
- Observability
- APM
- Security
- Dev Tools
- Fleet
- Osquery
- Stack Monitoring
- Stack Management
- REST API
- Get features API
- Kibana spaces APIs
- Kibana role management APIs
- User session management APIs
- Saved objects APIs
- Index patterns APIs
- Alerting APIs
- Action and connector APIs
- Import and export dashboard APIs
- Logstash configuration management APIs
- Shorten URL
- Get Task Manager health
- Upgrade assistant APIs
- Kibana plugins
- Accessibility
- Release notes
- Developer guide
IMPORTANT: No additional bug fixes or documentation updates
will be released for this version. For the latest information, see the
current release documentation.
Heat map layer
editHeat map layer
editHeat map layers cluster point data to show locations with higher densities.

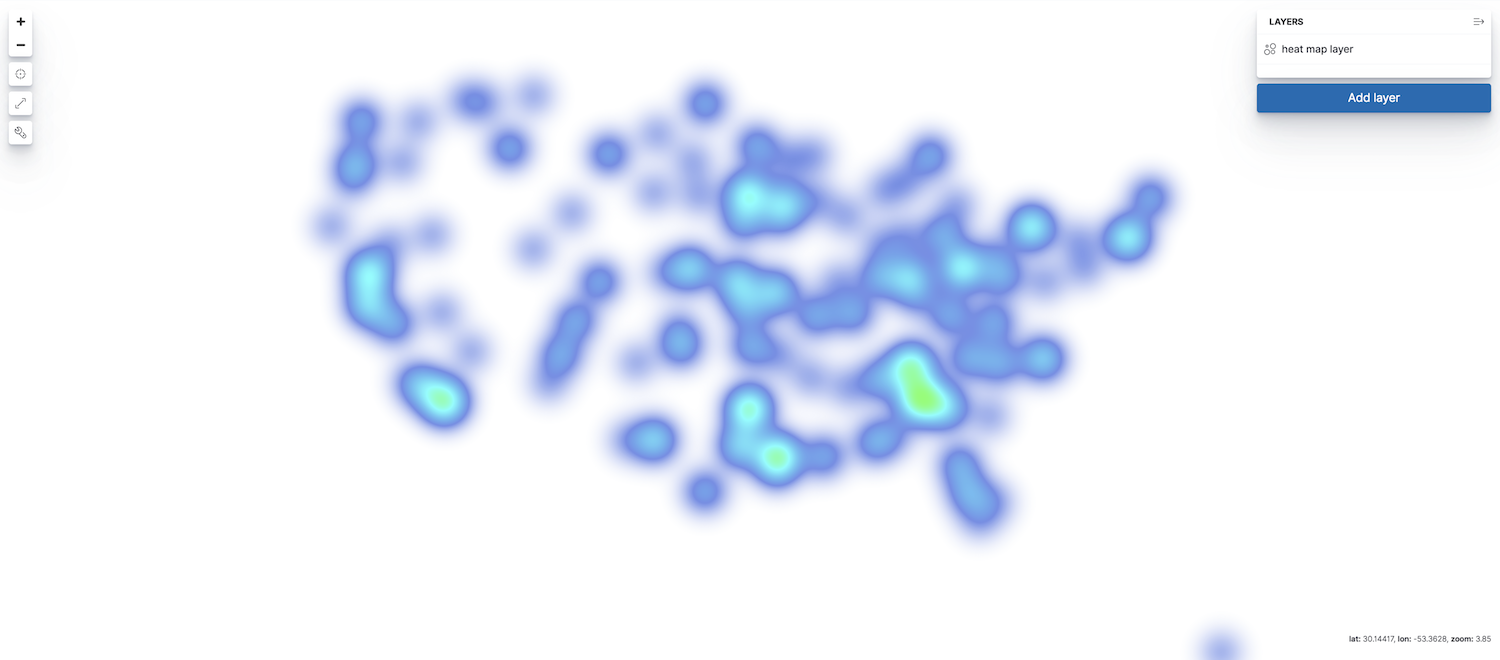
To add a heat map layer to your map, click Add layer, then select Heat map. The index must contain at least one field mapped as geo_point or geo_shape.
Only count, sum, unique count metric aggregations are available with the grid aggregation source and heat map layers. Average, min, and max are turned off because the heat map will blend nearby values. Blending two average values would make the cluster more prominent, even though it just might literally mean that these nearby areas are average.
Was this helpful?
Thank you for your feedback.