Uptime monitoring
editUptime monitoring
editThe Uptime app is for viewing result data from lightweight monitors running through
Heartbeat and configured with a traditional heartbeat.yml file.
This is for TCP, HTTP or ICMP monitors that you have configured and run from your own
infrastructure with Heartbeat natively.
For browser-based monitors, a richer management and reporting experience, and more capabilities such as triaging and responding to alerts, use the Synthetics app instead of the Uptime app.
Note that the Uptime app is hidden from the interface when there is no recent Heartbeat data. To see the app, you may need to turn on the Always show legacy Uptime app setting (observability:enableLegacyUptimeApp) under Kibana Advanced Settings. To learn how, refer to Advanced Settings.
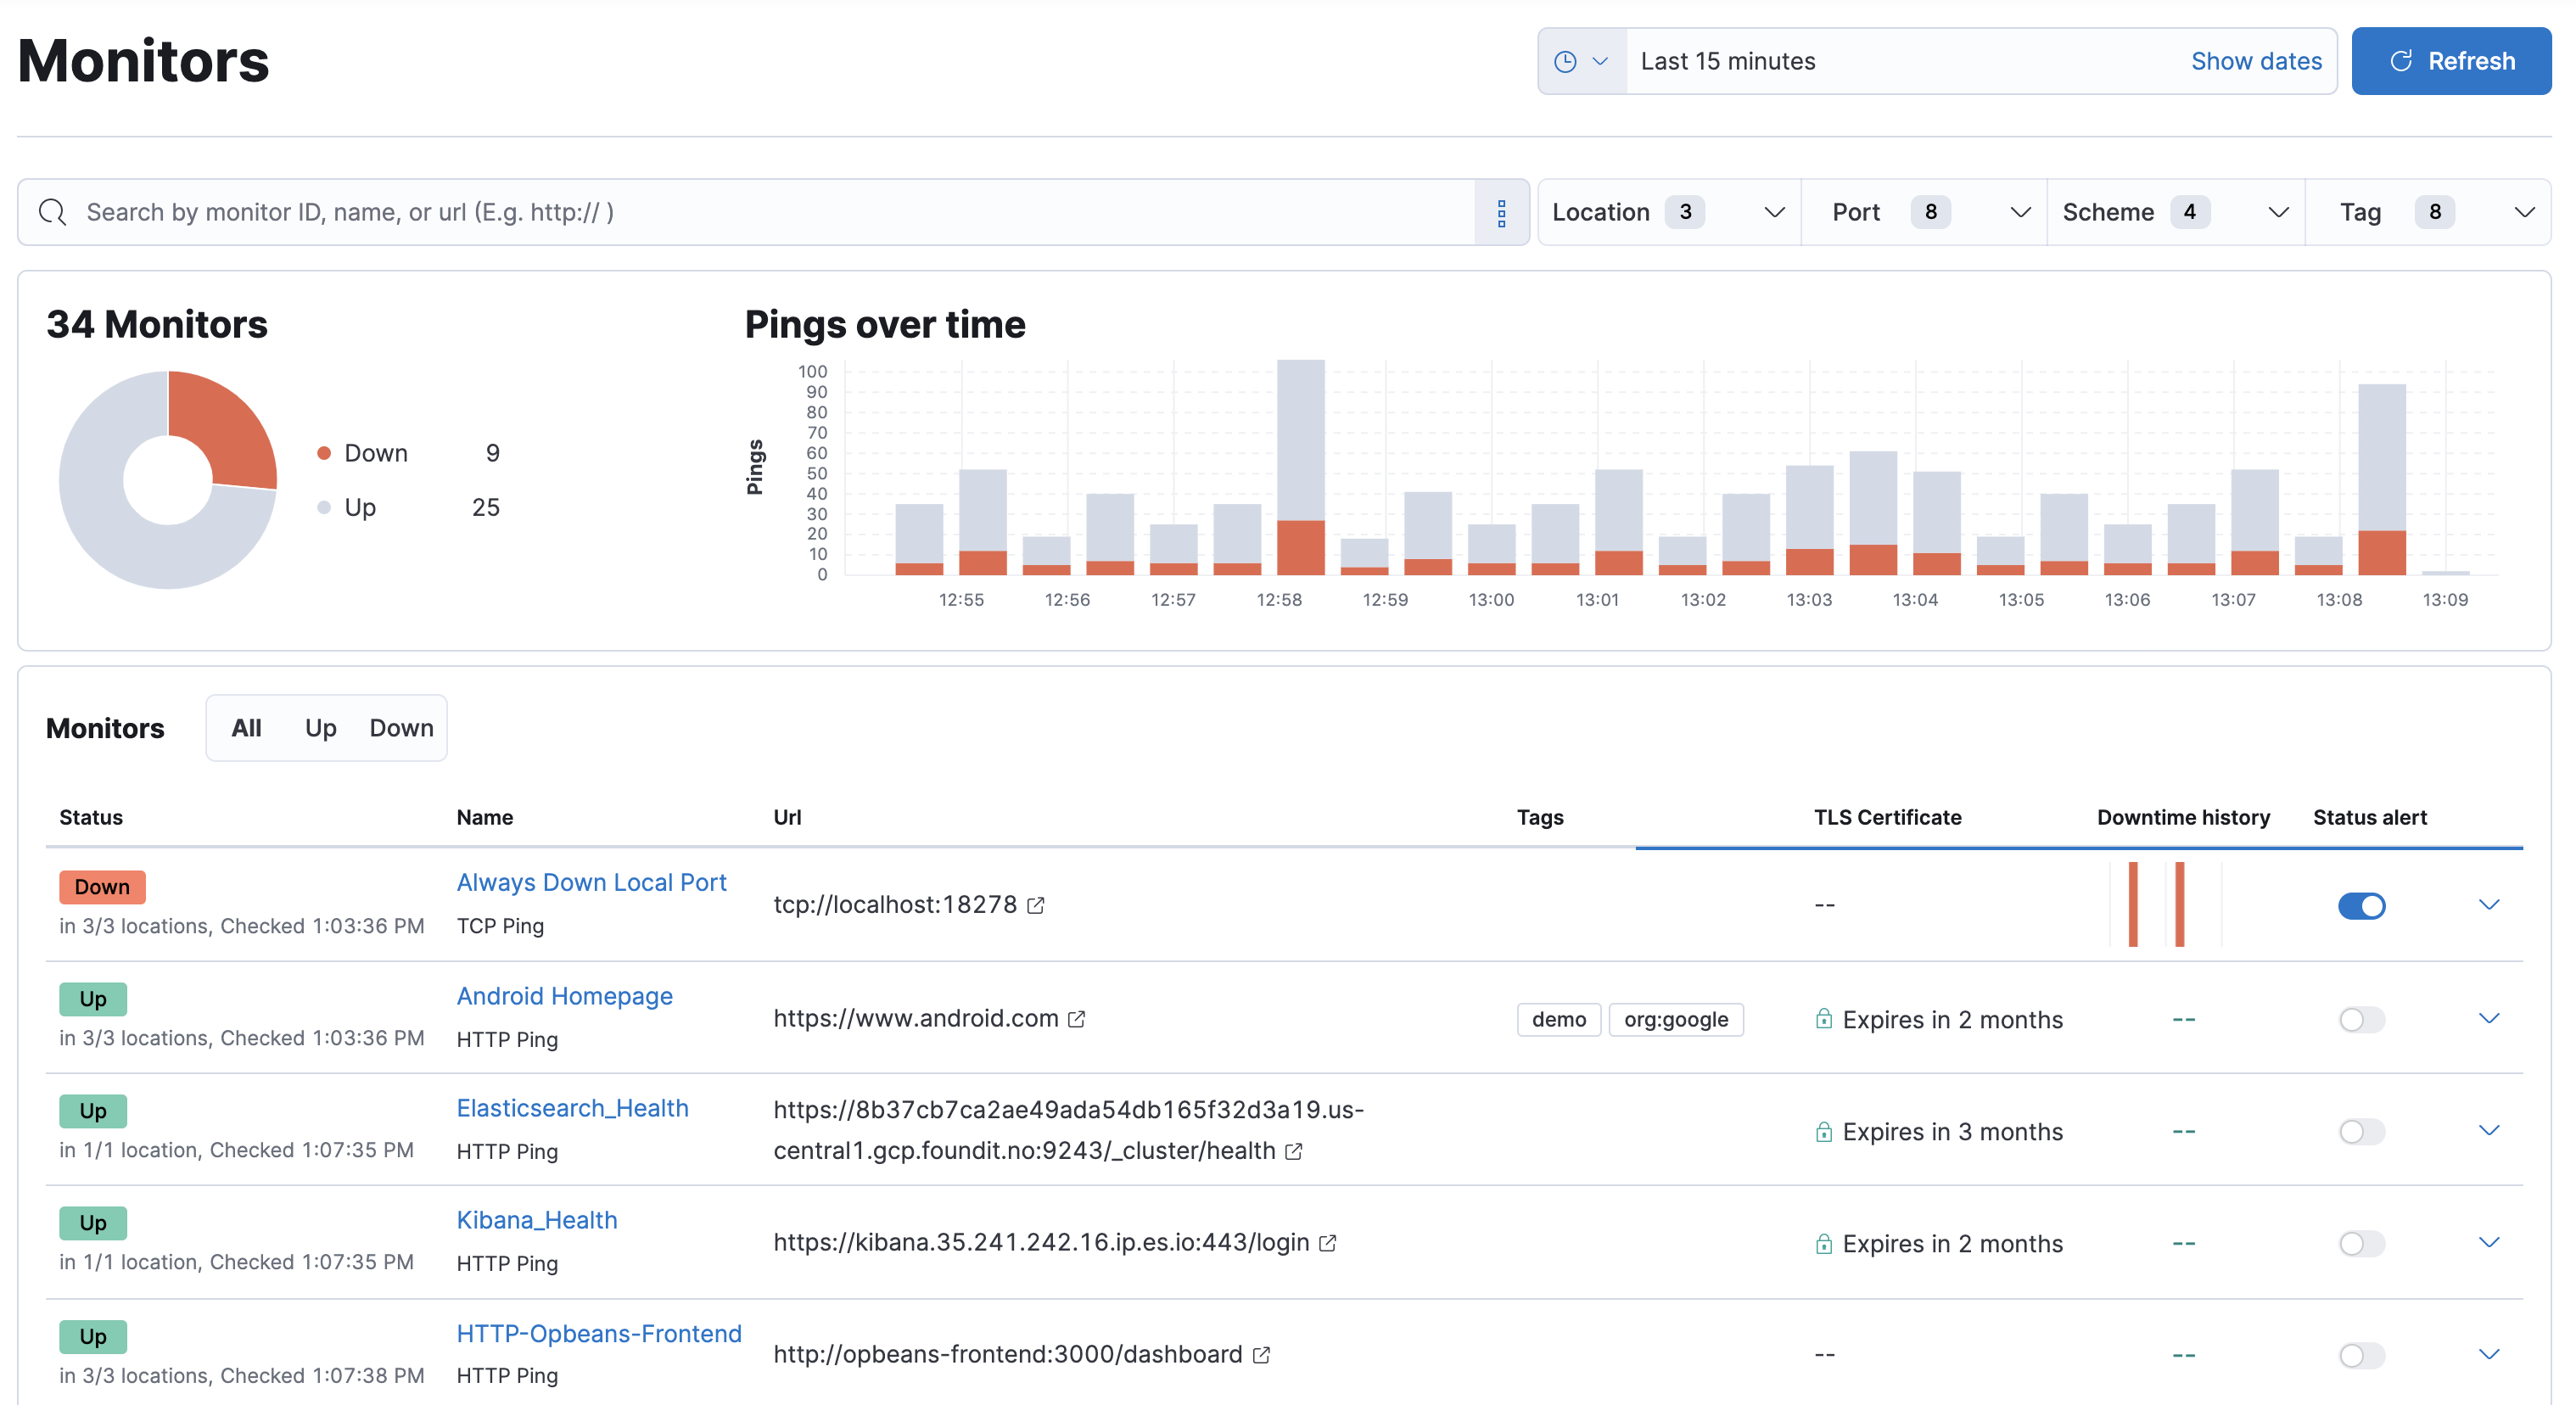
The Uptime app uses Elastic Agent to periodically check the status of your services and applications. Monitor the availability of network endpoints and services using Lightweight HTTP/S, TCP, and ICMP monitors.
Lightweight HTTP/S, TCP, and ICMP monitors
editIn the Uptime app, you can monitor the status of network endpoints using the following lightweight checks:
HTTP monitor |
Monitor your website. The HTTP monitor checks to make sure specific endpoints return the correct status code and display the correct text. |
ICMP monitor |
Check the availability of your hosts. The ICMP monitor uses ICMP (v4 and v6) Echo Requests to check the network reachability of the hosts you are pinging. This will tell you whether the host is available and connected to the network, but doesn’t tell you if a service on the host is running or not. |
TCP monitor |
Monitor the services running on your hosts. The TCP monitor checks individual ports to make sure the service is accessible and running. |
To set up your first monitor, refer to Get started with Uptime.
TLS Certificates
editThe TLS Certificates page in the Uptime app lists the TLS certificates that are being monitored and shows the TLS certificate data in your indices.
In addition to the common name, associated monitors, issuer information, and SHA fingerprints, an assigned status is derived from the threshold values in the Settings page.
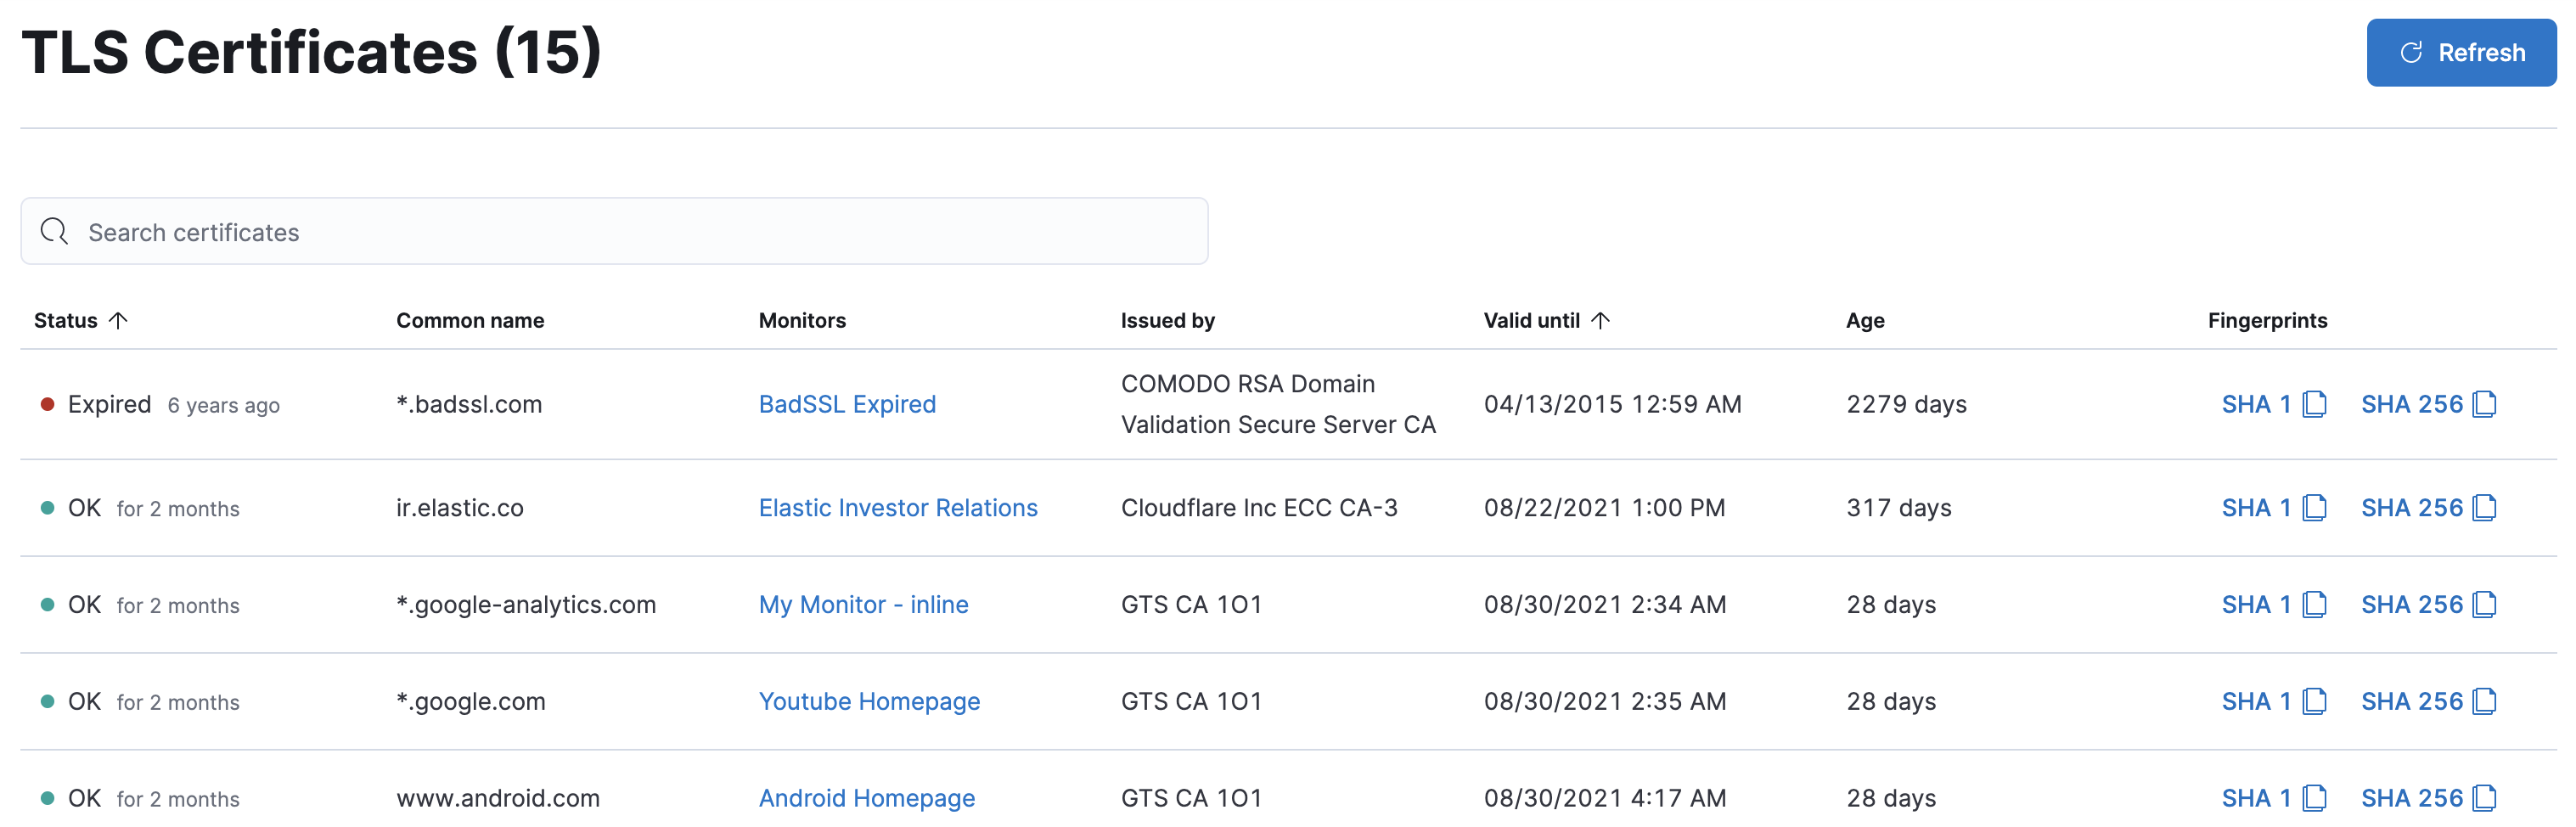
The table entries can be sorted by status and valid until. You can use the search bar at the top of the view to find values in most of the TLS-related fields in your Uptime indices.
Additionally, you can select the Alerts and rules dropdown at the top of the page, and create a TLS rule to receive an alert when your certificate is about to expire.