What’s new in 8.16
editWhat’s new in 8.16
editHere are the highlights of what’s new and improved in 8.16. For detailed information about this release, check the release notes.
Previous versions: 8.15 | 8.14 | 8.13 | 8.12 | 8.11 | 8.10 | 8.9 | 8.8 | 8.7 | 8.6 | 8.5 | 8.4 | 8.3 | 8.2 | 8.1 | 8.0
Solution-oriented navigation
editOn Elastic Cloud Hosted deployments running on version 8.16, you can now navigate Kibana using a lighter, solution-oriented left navigation menu, called Solution view.
There are four selectable solution views: Search, Observability, Security, and Classic. Search, Observability, and Security are the new navigation menus. Each of those brings simplicity by focusing the left navigation menu on a relevant subset of features, scoped to its associated use cases, and offers a dedicated home page. Classic has the same navigation menu as 8.15 and before.
Each space has its own solution view setting which determines the navigation experience for all users of that space.
When creating a new deployment, you will now be asked to choose between one of the 3 new solution views for your default space. If you prefer to stick with the classic, multi-layered navigation, you can do so once the deployment is created by navigating to your space settings.
Deployments upgrading from a previous version to 8.16 keep the classic navigation. Admins can enable one of the new solution views from the space settings.
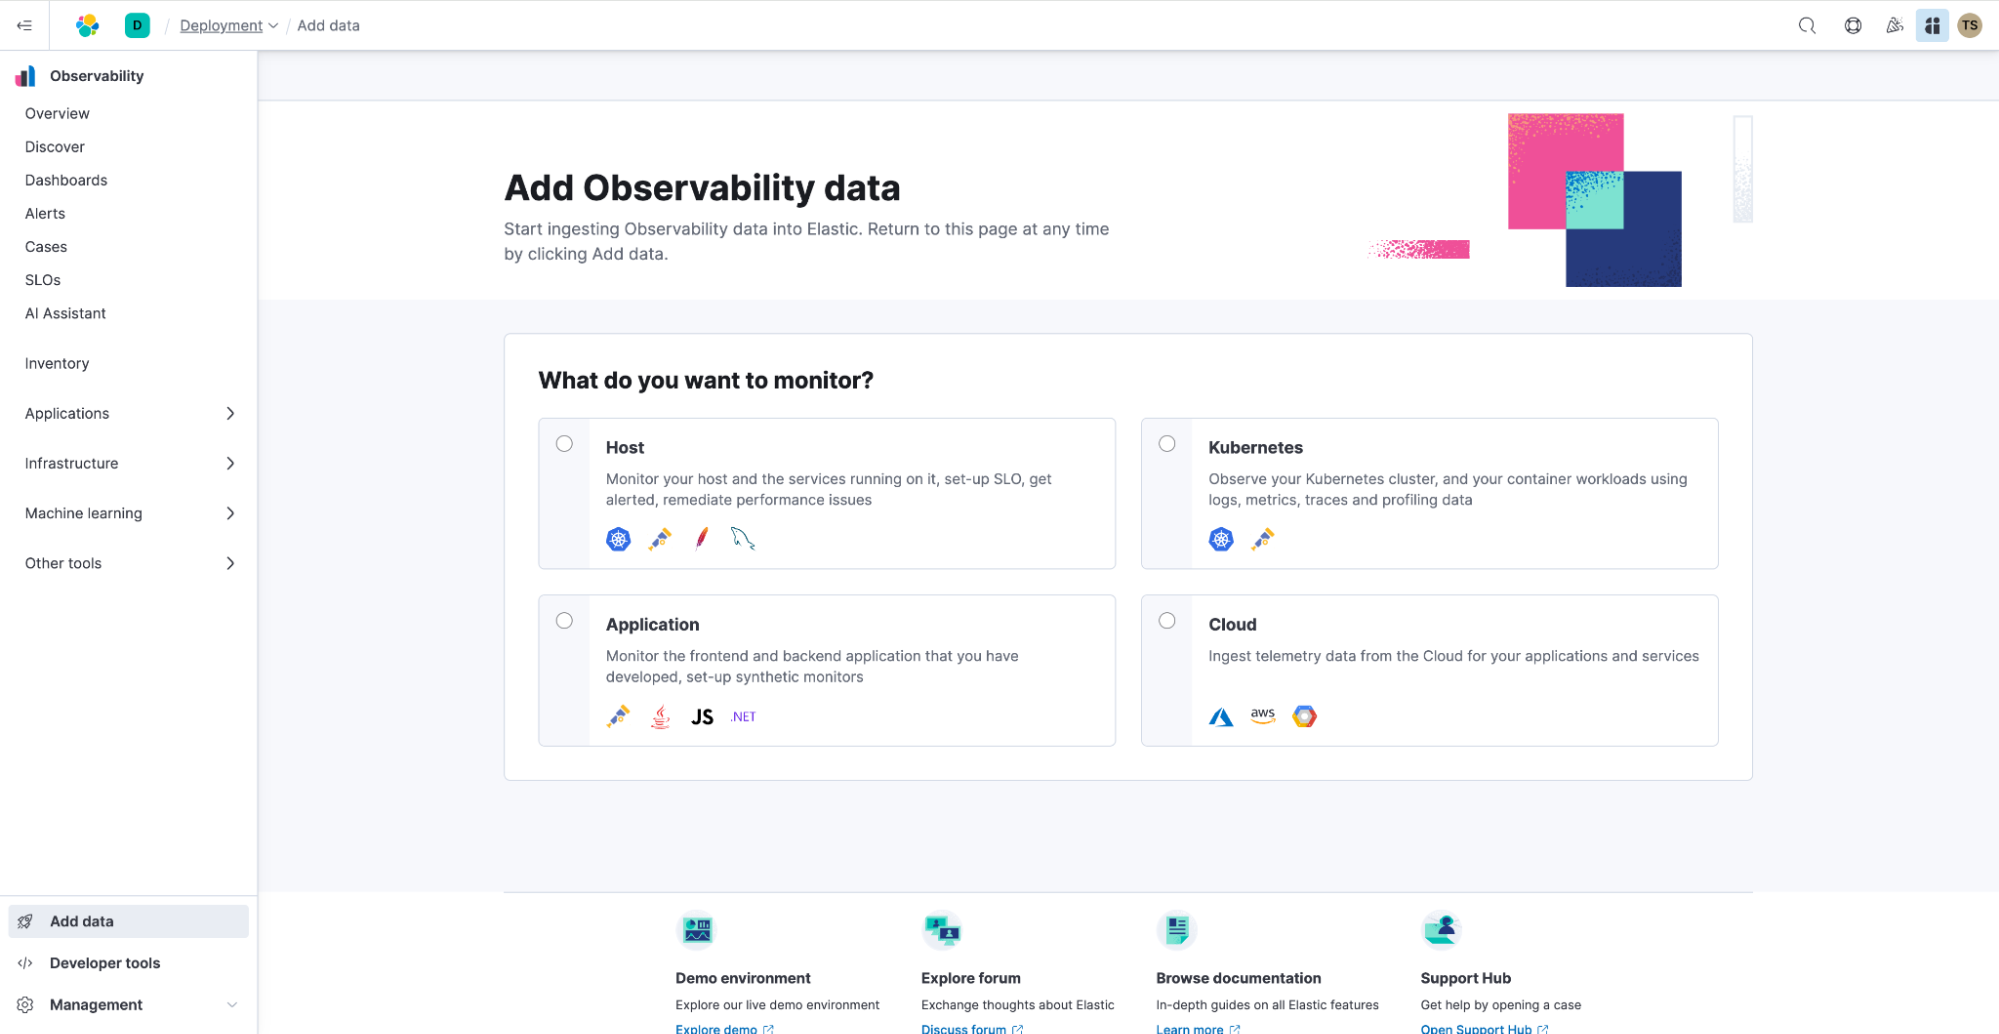
The Observability solution view and its Home page.
Discover and ES|QL
editContextual Data presentation
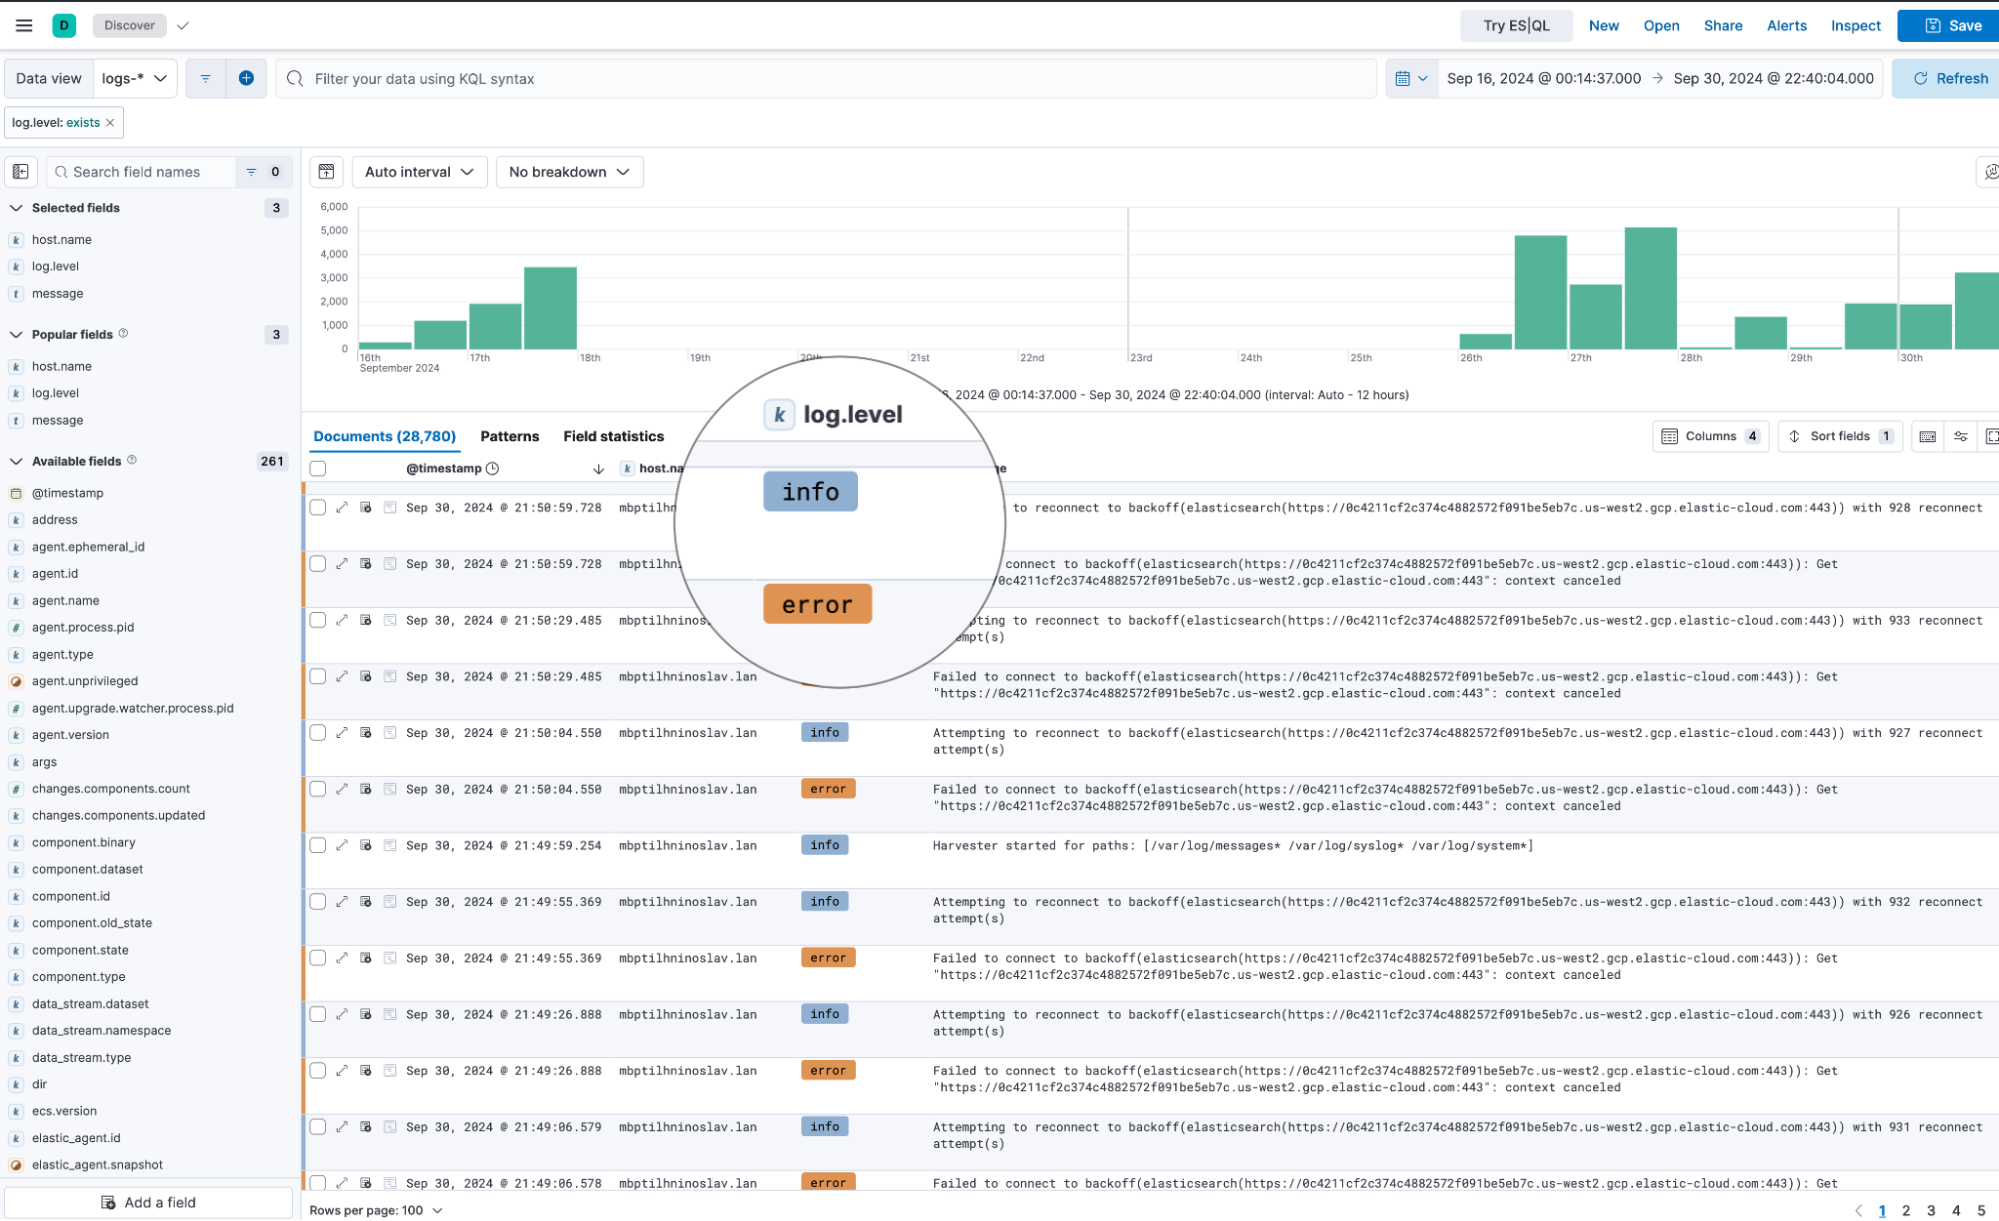
editIn this release, Discover introduces enhanced contextual data presentation. Previously, you needed to manually select relevant fields and set up your workspace before diving into data exploration. Now, Discover automatically tailors the user experience based on the data being explored, powered by a scalable contextual architecture. For example, when analyzing logs, you’ll see a log.level field rendered directly in the table, a custom Logs overview in the document viewer, and log.level indicators on individual rows.
Recommended ES|QL queries
editWriting ES|QL queries just got easier. Many users face challenges when authoring queries, and even more so when unfamiliar with the syntax or data structure. This can lead to inefficiencies in data analysis and visualization. We want to reduce the time it takes to create queries and to lower the learning curve for both new and existing users by suggesting recommended queries within the ES|QL Help menu and from the auto-complete.
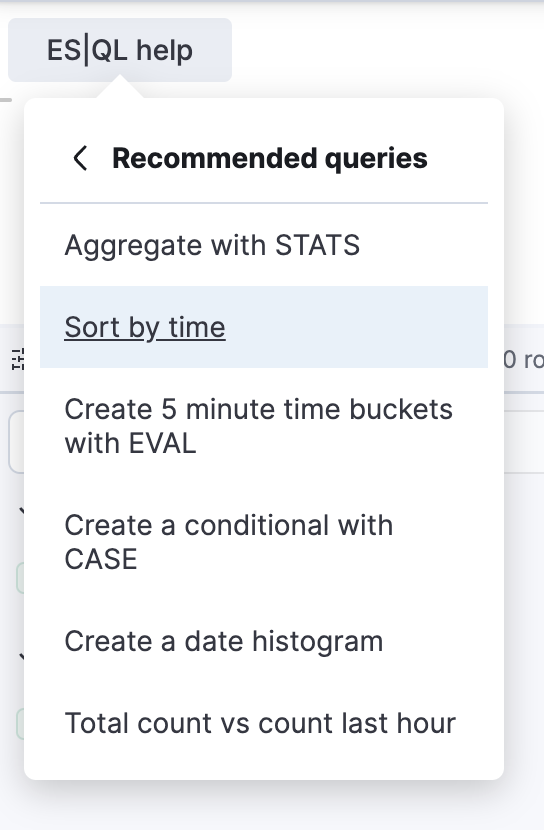
Recommended ES|QL queries from the ES|QL help menu
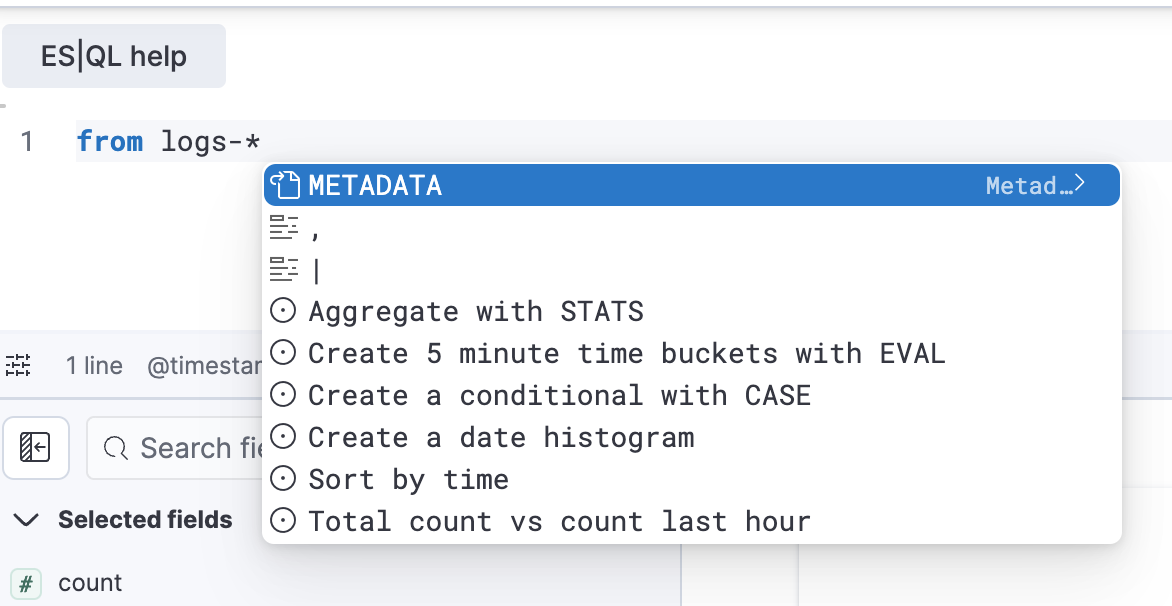
Recommended ES|QL queries from auto-complete suggestions
Dashboards
editManage dashboards more easily and efficiently
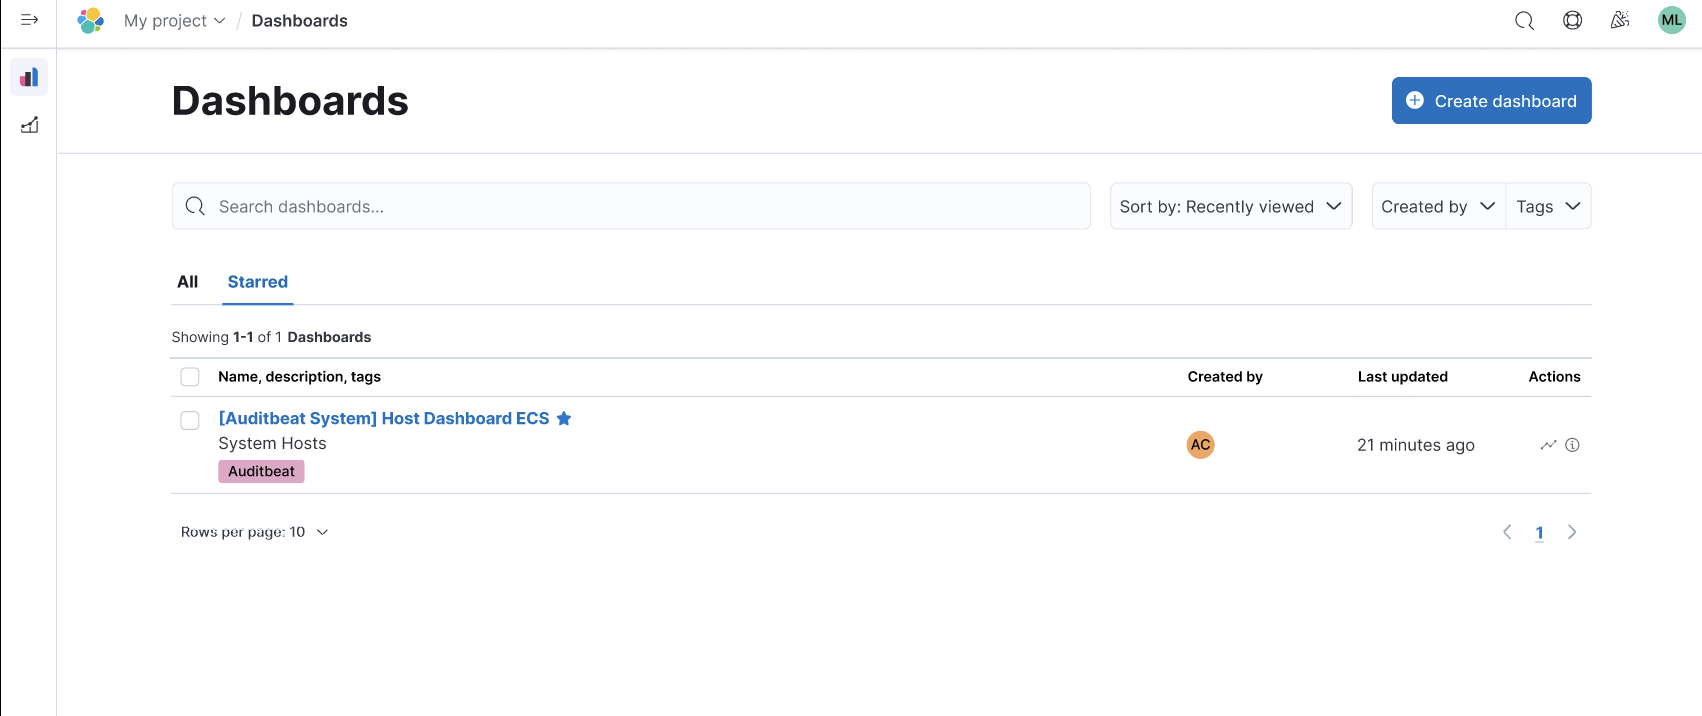
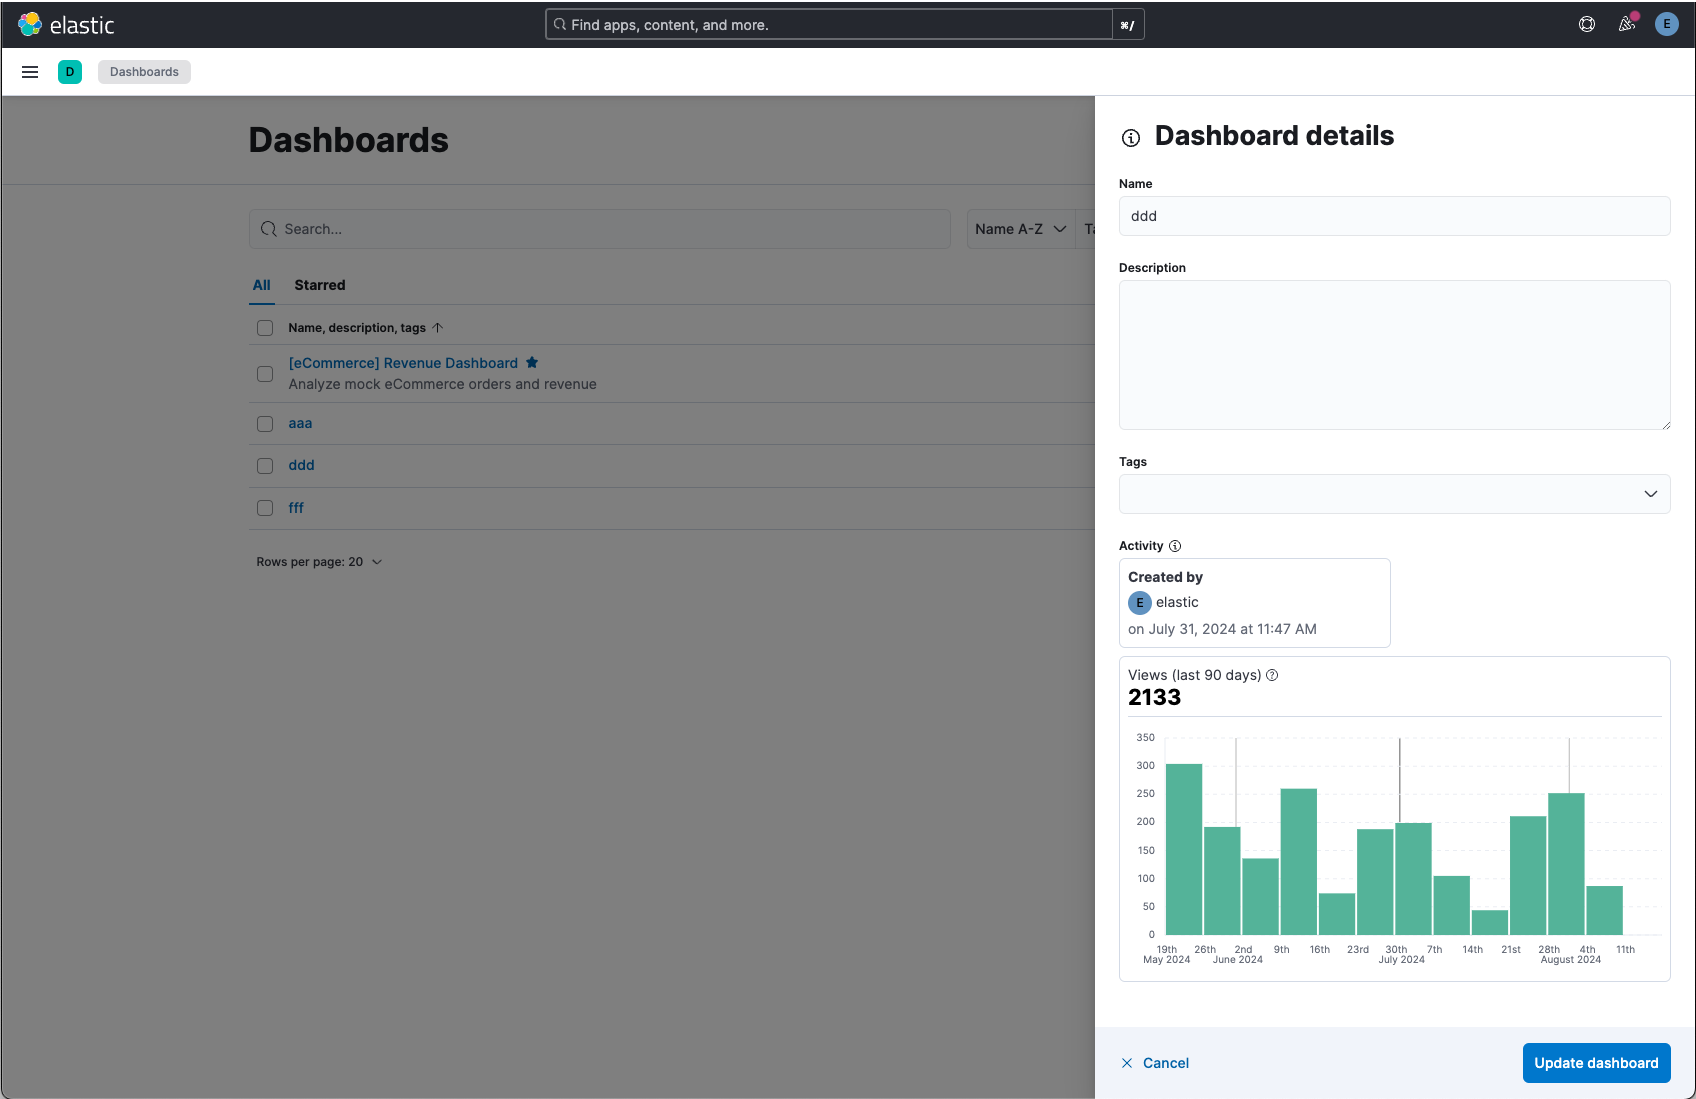
editAs part of a series of improvements to help you find and manage your dashboards started in version 8.15, the new default way to sort your dashboards is by recently viewed, and we are adding an option to star your favorite dashboards, as well as some statistics to monitor the usage of your dashboards.
You can find your favorite dashboards in the new Starred tab.
By opening a dashboard’s details using the “info” icon from the dashboard list view, you can now get a sense of the popularity of that dashboard with a histogram showing how many times the dashboard was viewed in the last 90 days.
Log Pattern Analysis dashboard panels
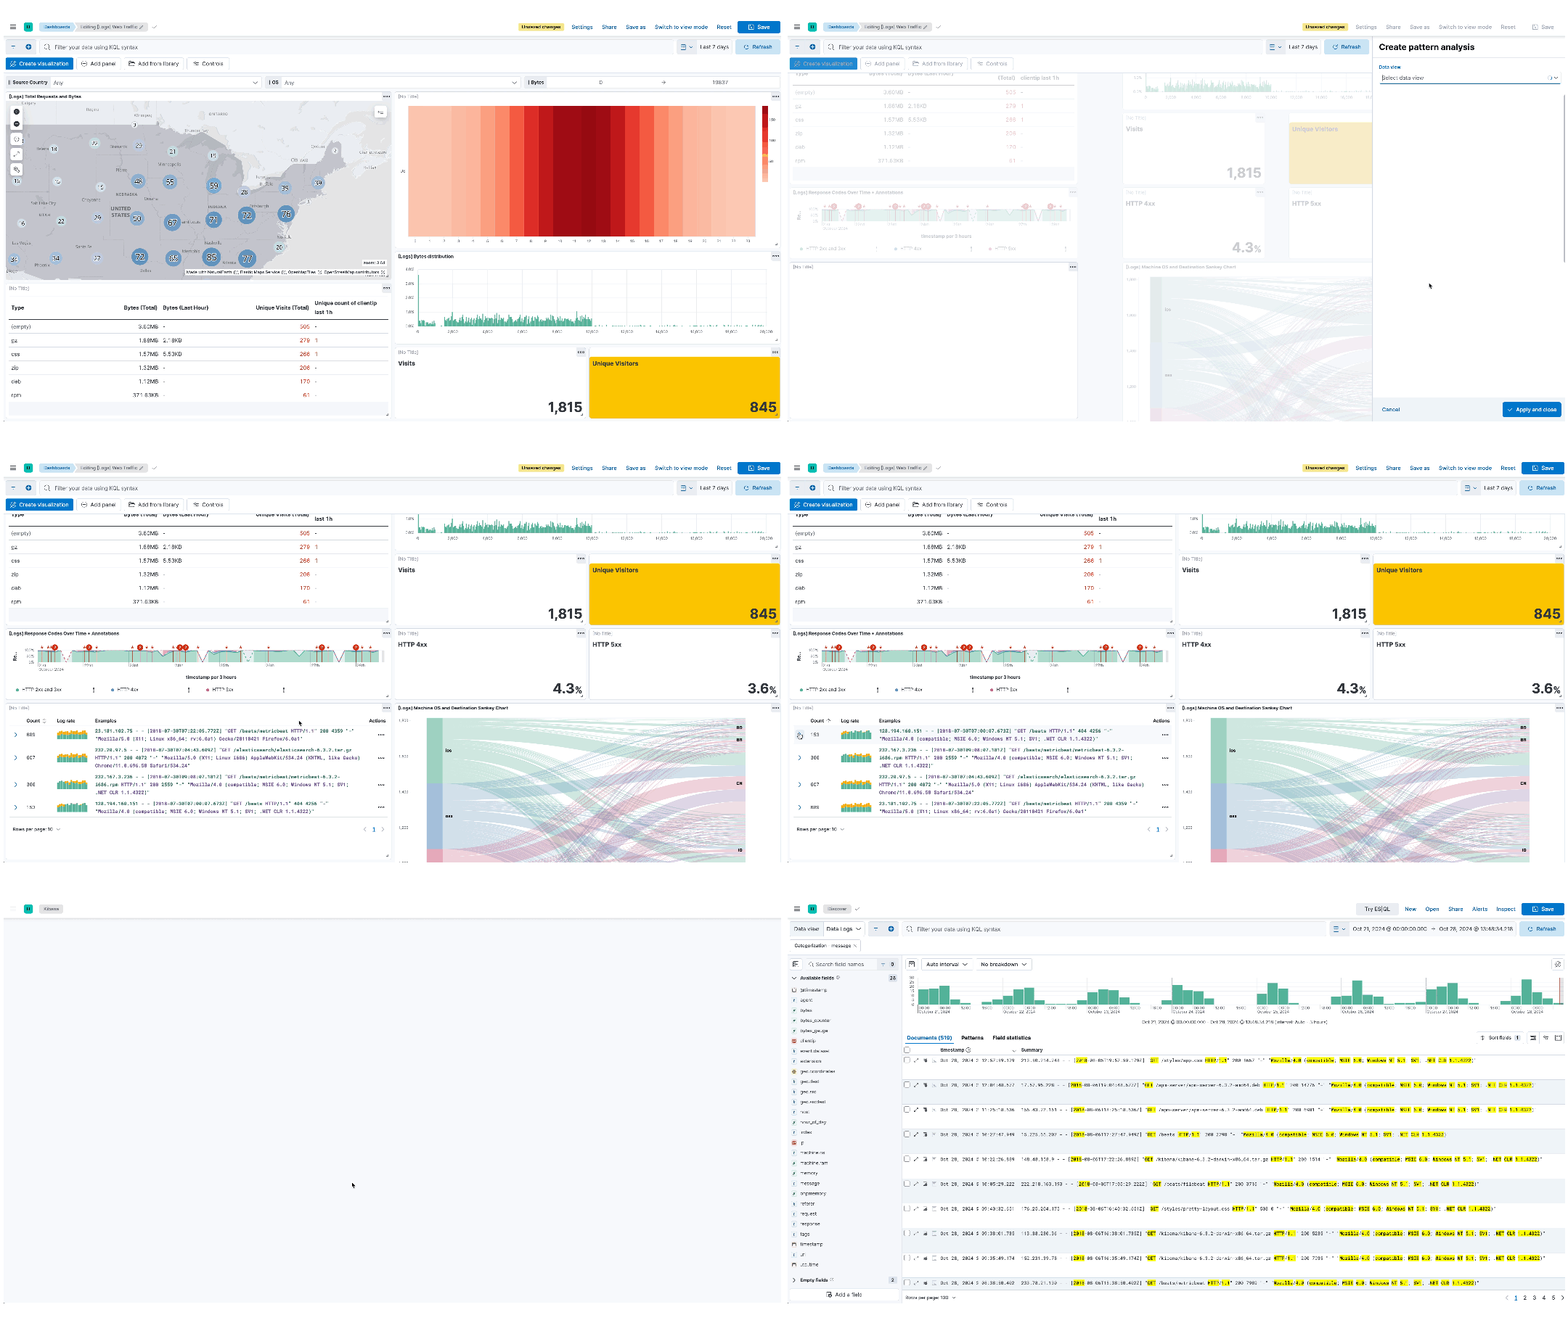
editLog Pattern Analysis panels are now available for you to add to your dashboards, making AIOps even more embedded in your workflows and where you need it. When filtering patterns, the dashboard’s data adjusts accordingly. You can also choose the filtering to transition you into Discover for further exploration.
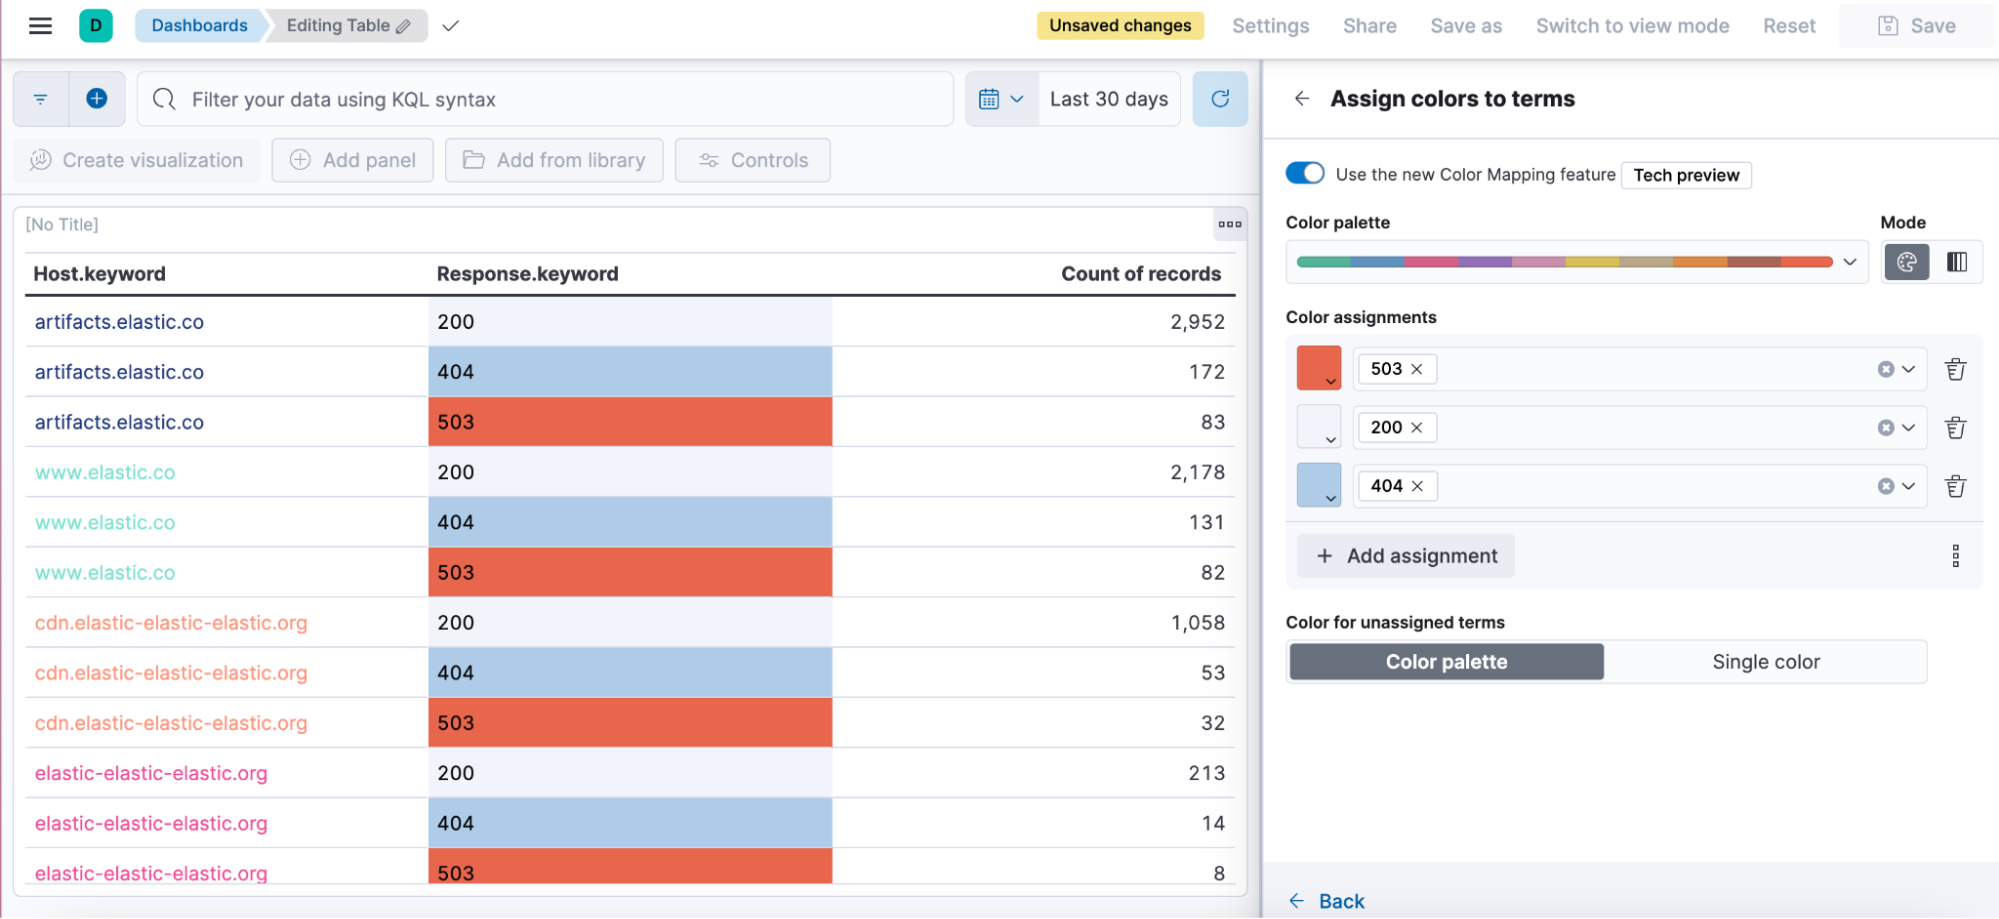
Color text values in tables
editPreviously, you could only decide to color numeric values in tables. We’re adding the ability to also color your string values. You can decide whether you want to color the whole cell, or only the text.
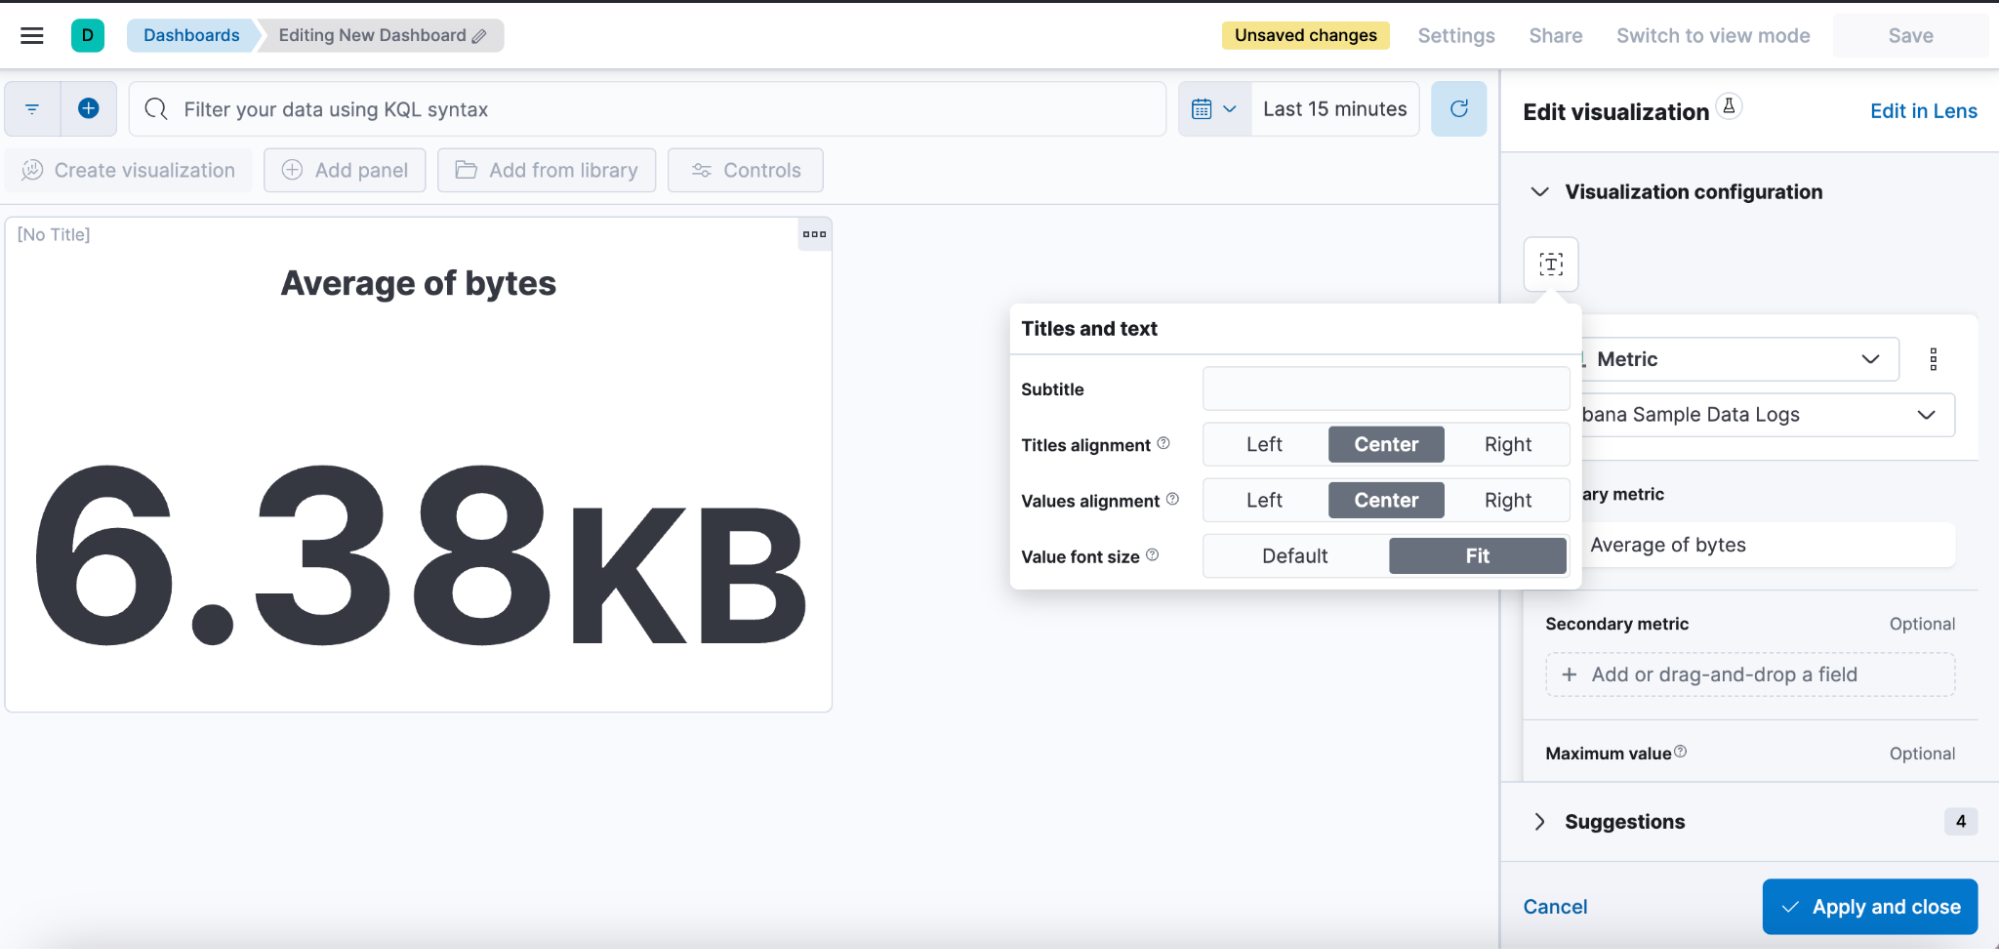
Formatting options for your metrics
editWe’ve received a lot of feedback asking for more flexibility to customize the appearance of your metrics. In this version, we are adding the ability to customize the title and value alignment, as well as the font size. Selecting the Fit option will adjust the font size and make the metric value occupy the entire panel.
Managing Kibana and data
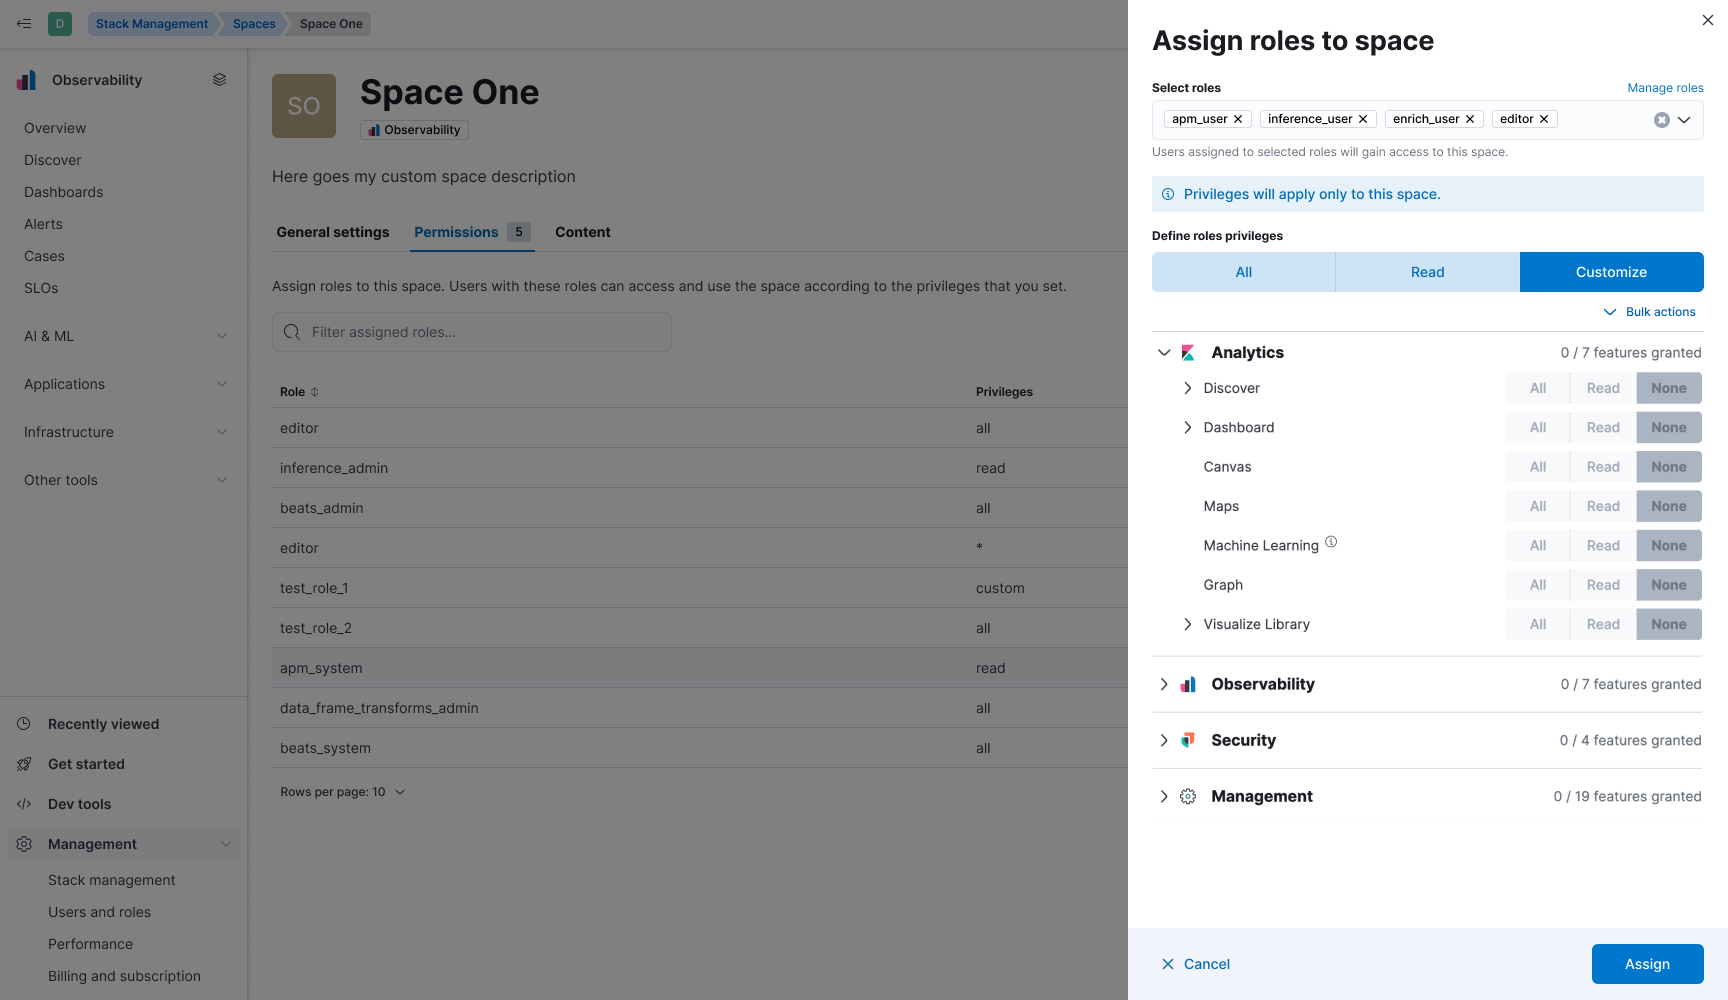
editEdit space access from the space settings
editAs an admin, you can now assign roles to and edit role permissions on a given space directly from the settings of that space.
Prior to 8.16, you could only do this from the role settings, which was counterintuitive.
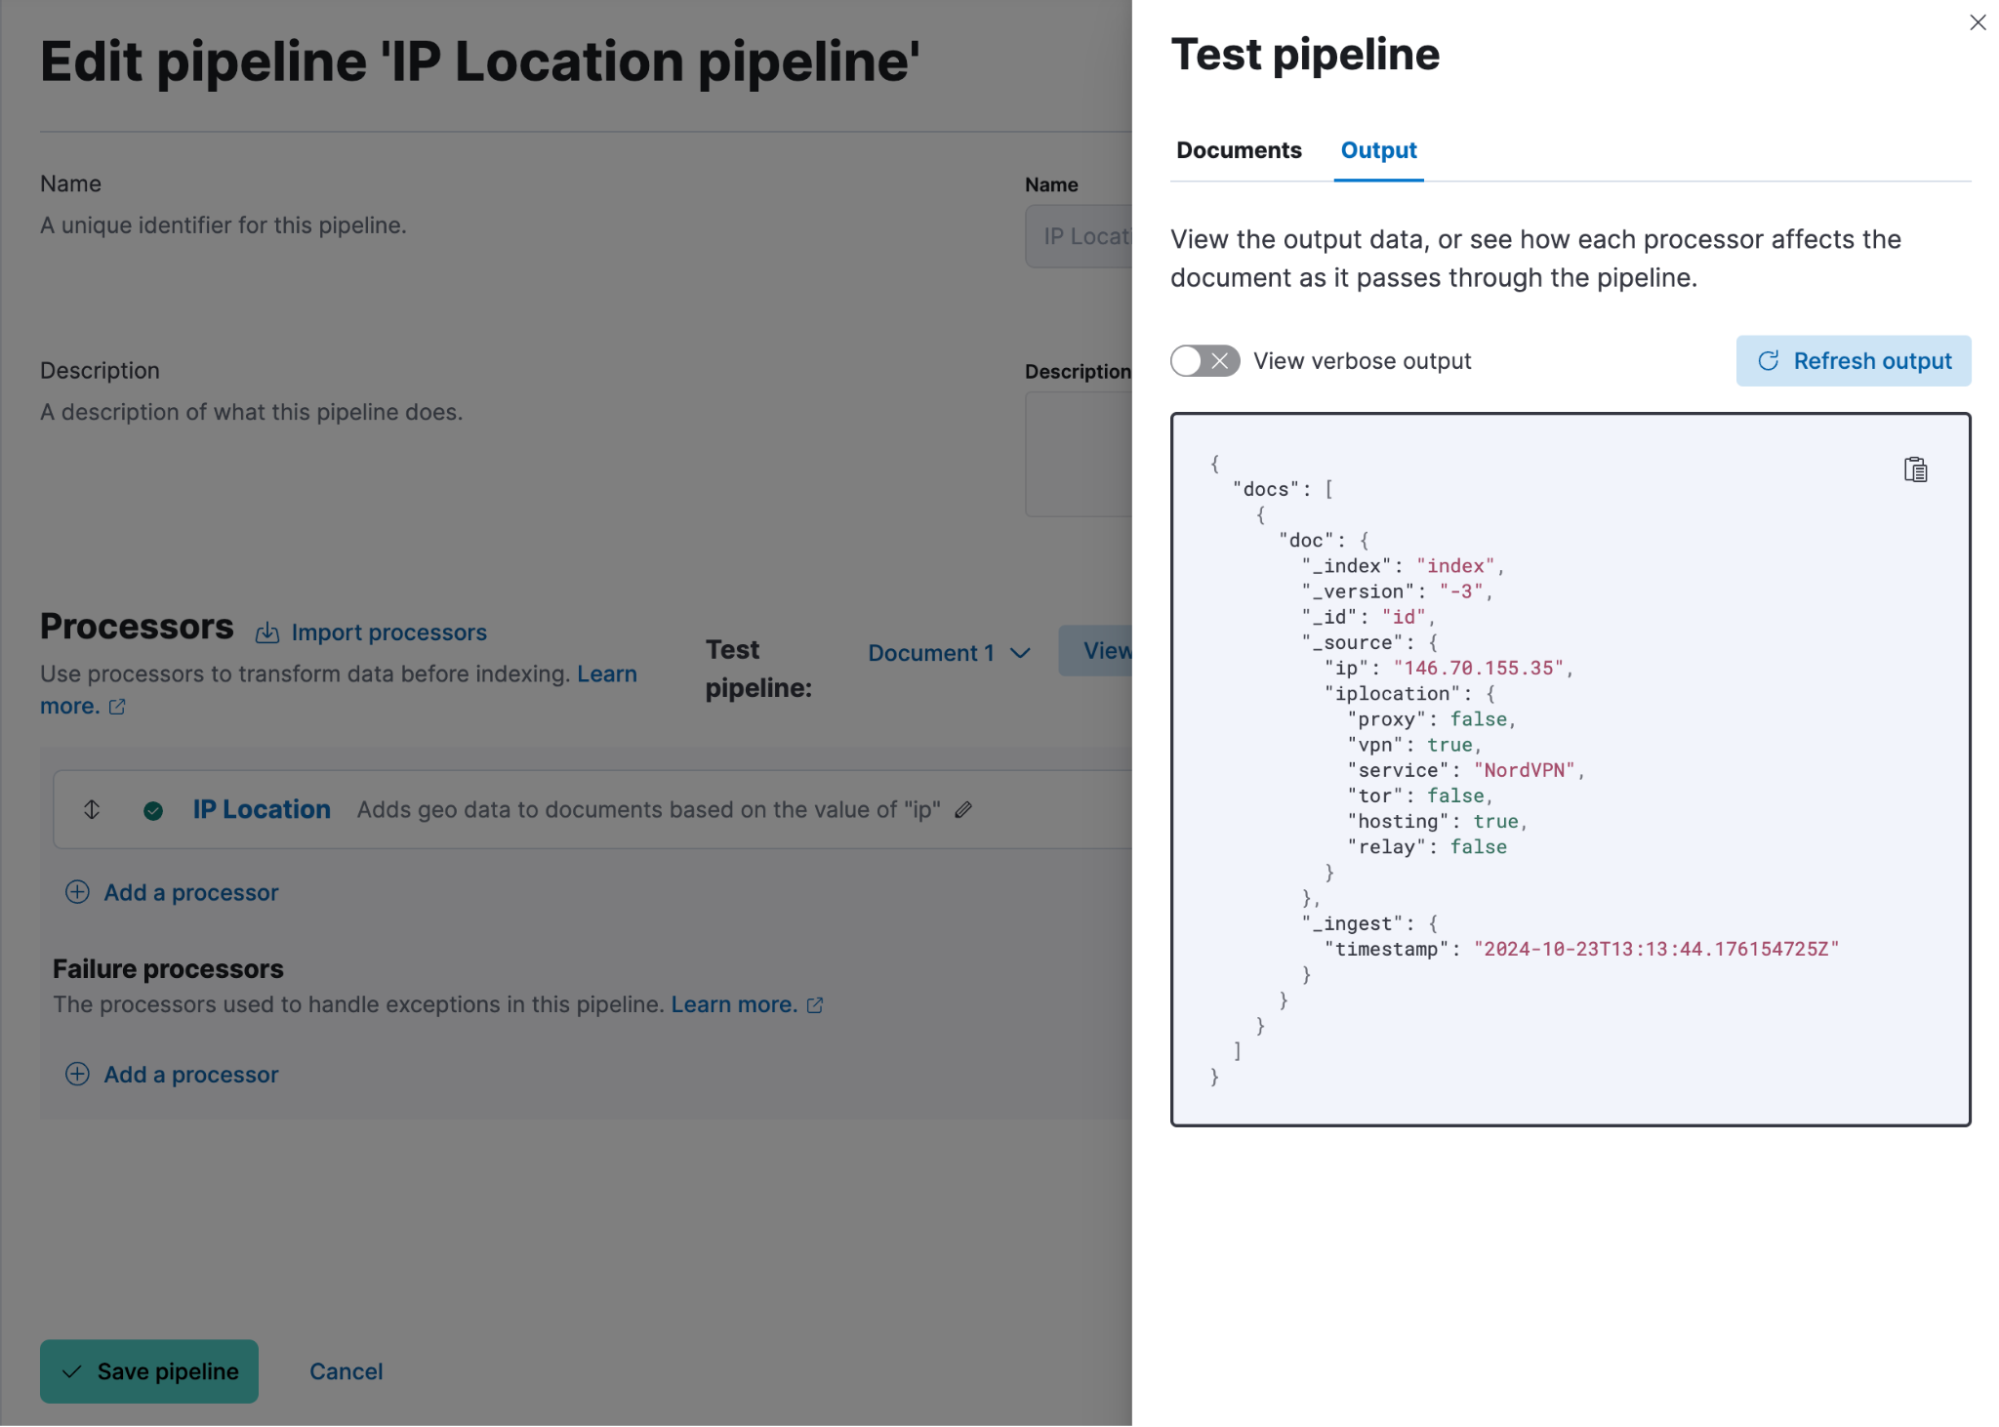
New IP Location processor
editEnhancing location information based on IP addresses just got easier with the new IP Location processor. In addition to the existing free GeoLite offerings from MaxMind, we have integrated with MaxMind’s premium GeoIP databases for users who have licensed MaxMind’s products. If you’re an Enterprise Elastic customer, you now have an additional third-party product, IP Info, available for use as well. These additional data sources provide improved options for enriching data with location information associated with IP addresses to improve telemetry and insights. To utilize these features beyond the free MaxMind GeoIP database, you will need to have licensed premium MaxMind products and/or the IP Info database.
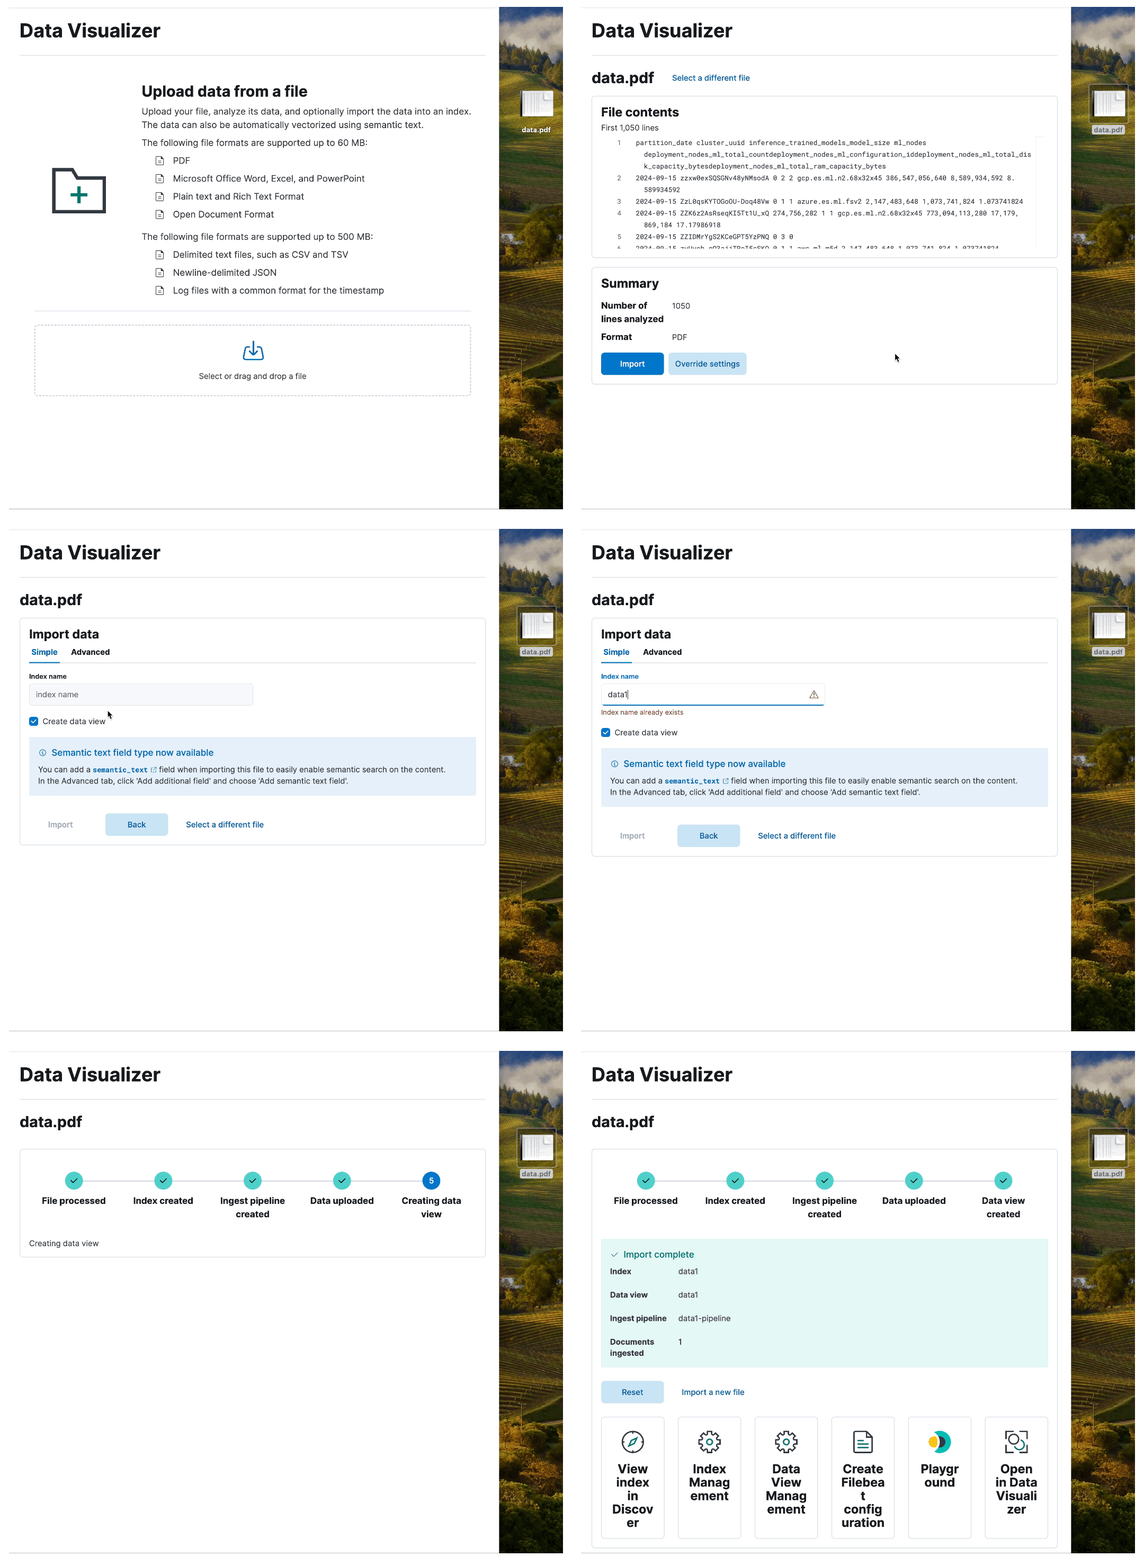
File uploader PDF support
editThe file uploader provides a quick way to upload data and start using Elastic. In 8.16, we are improving it to allow you to upload data from PDF files.
Developer Tools Console redesign
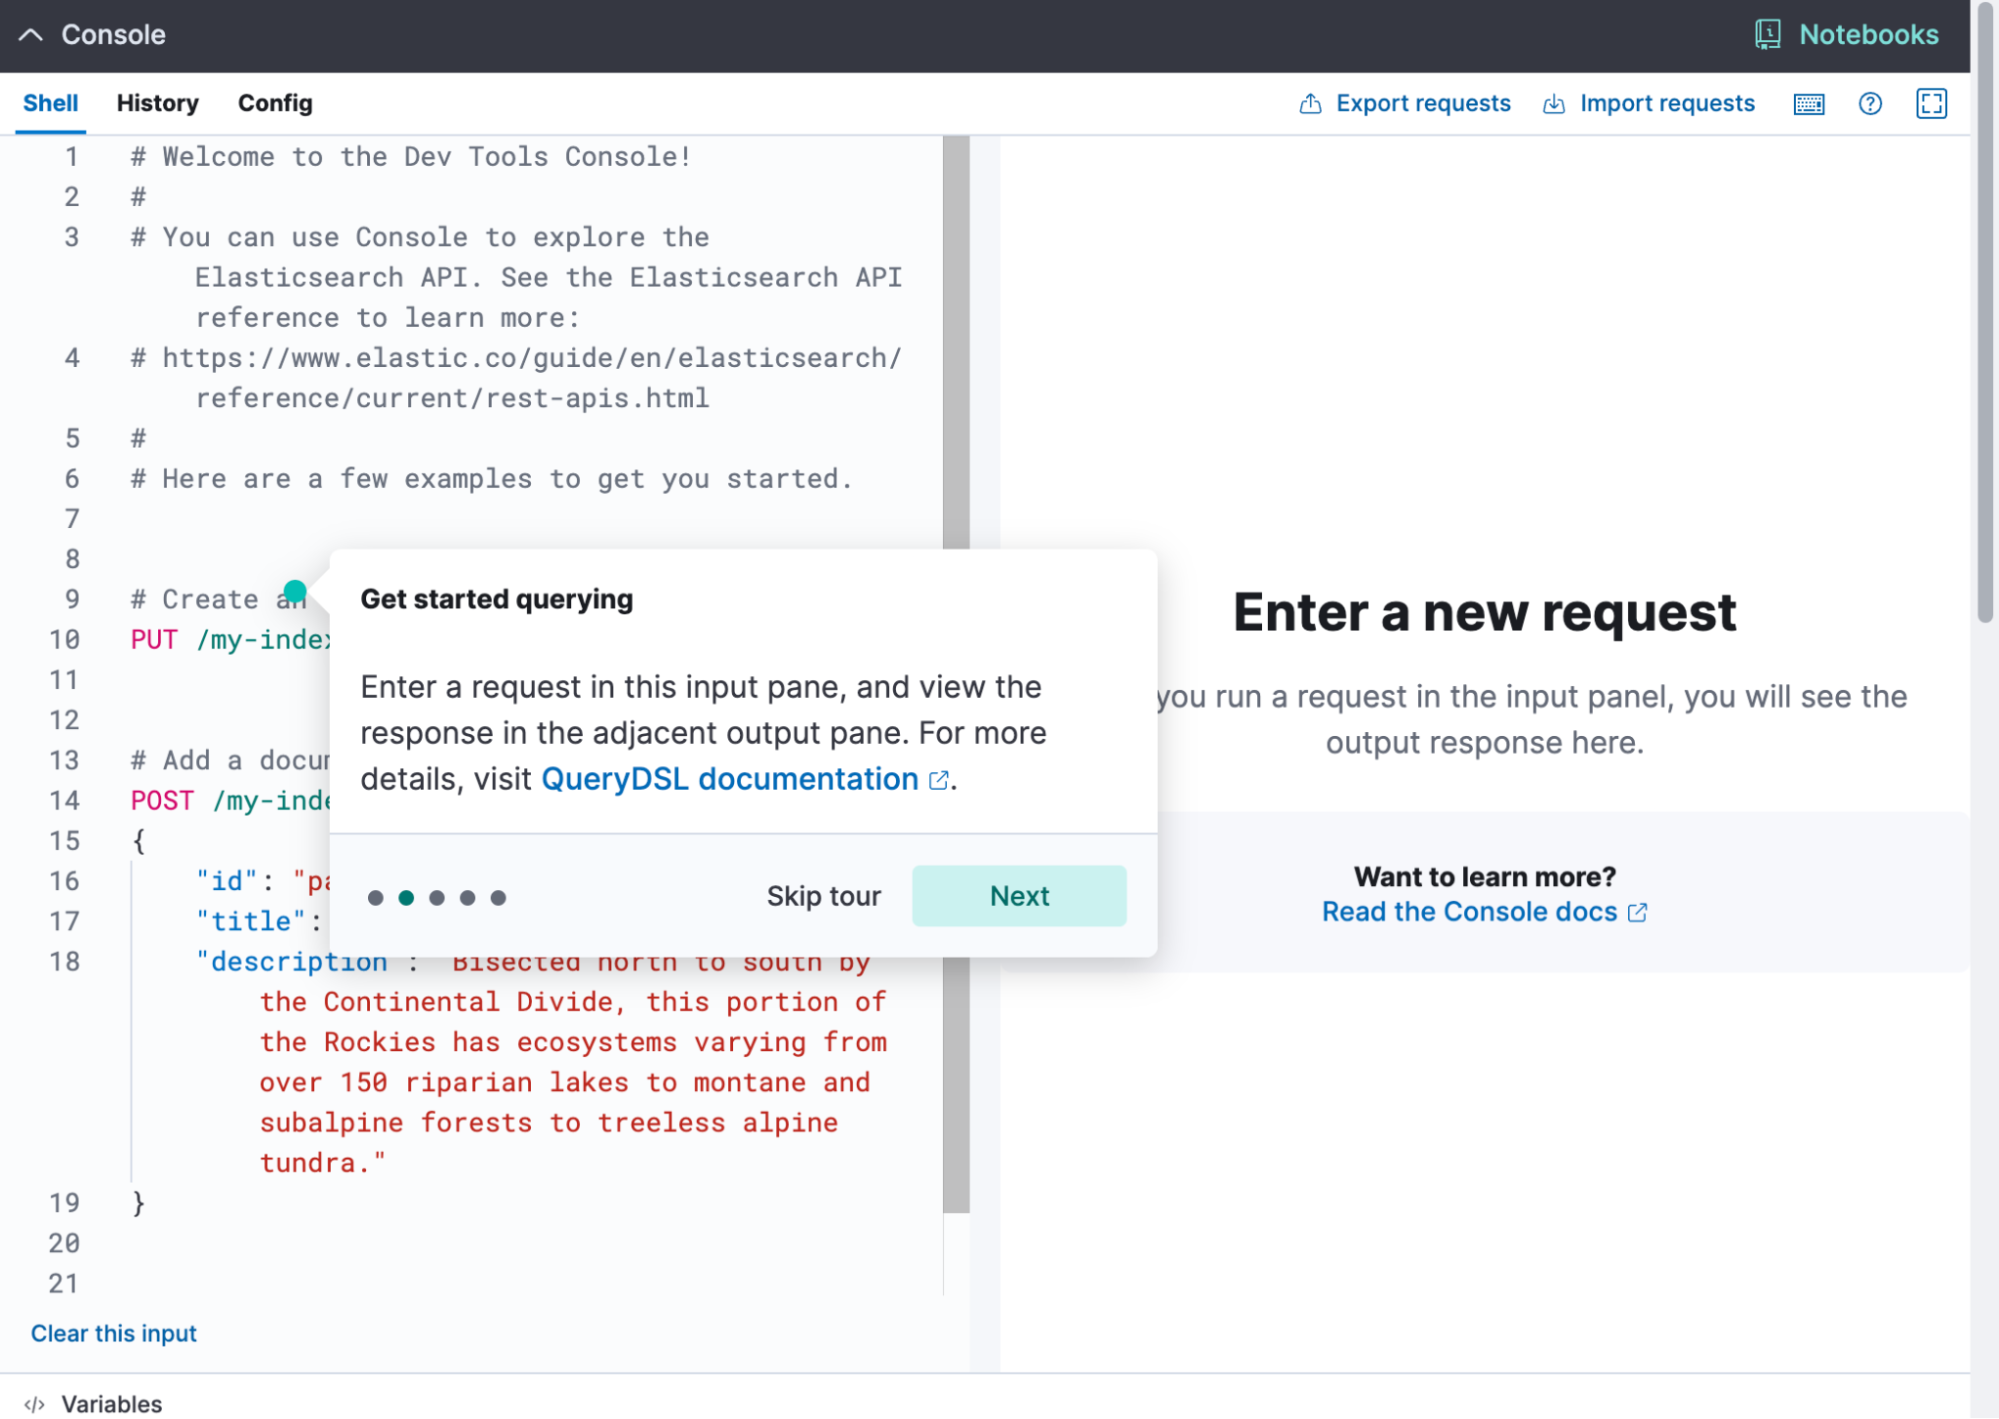
editWe’re excited to introduce a number of improvements to the overall user experience on one of our most popular features: Console. If you’re new to Console, you will be welcomed by an onboarding tour that will help you get started quickly with your first requests. And if you’re already a regular Console user, you will notice a variety of new features, including the ability to copy outputs to the clipboard, import and export request files, enjoy improved responsiveness, and other quality of life improvements.
Machine Learning
editThe Inference API is now Generally Available
editStarting in 8.16, the Inference API is now GA, offering production-level stability, robustness and performance. Elastic’s Inference API integrates the state-of-the-art in AI inference, including ELSER, your Elastic hosted models and an increasing array of external models and tasks in a unified, lean syntax. Used with semantic_text or the vector fields supported by the Elastic vector database, you can perform AI search, reranking, and completion with simplicity. In 8.16, we’re also adding streamed completions for improved flows and real time interactions and GenAI experiences.
ELSER and trained models adaptive resources and chunking strategies
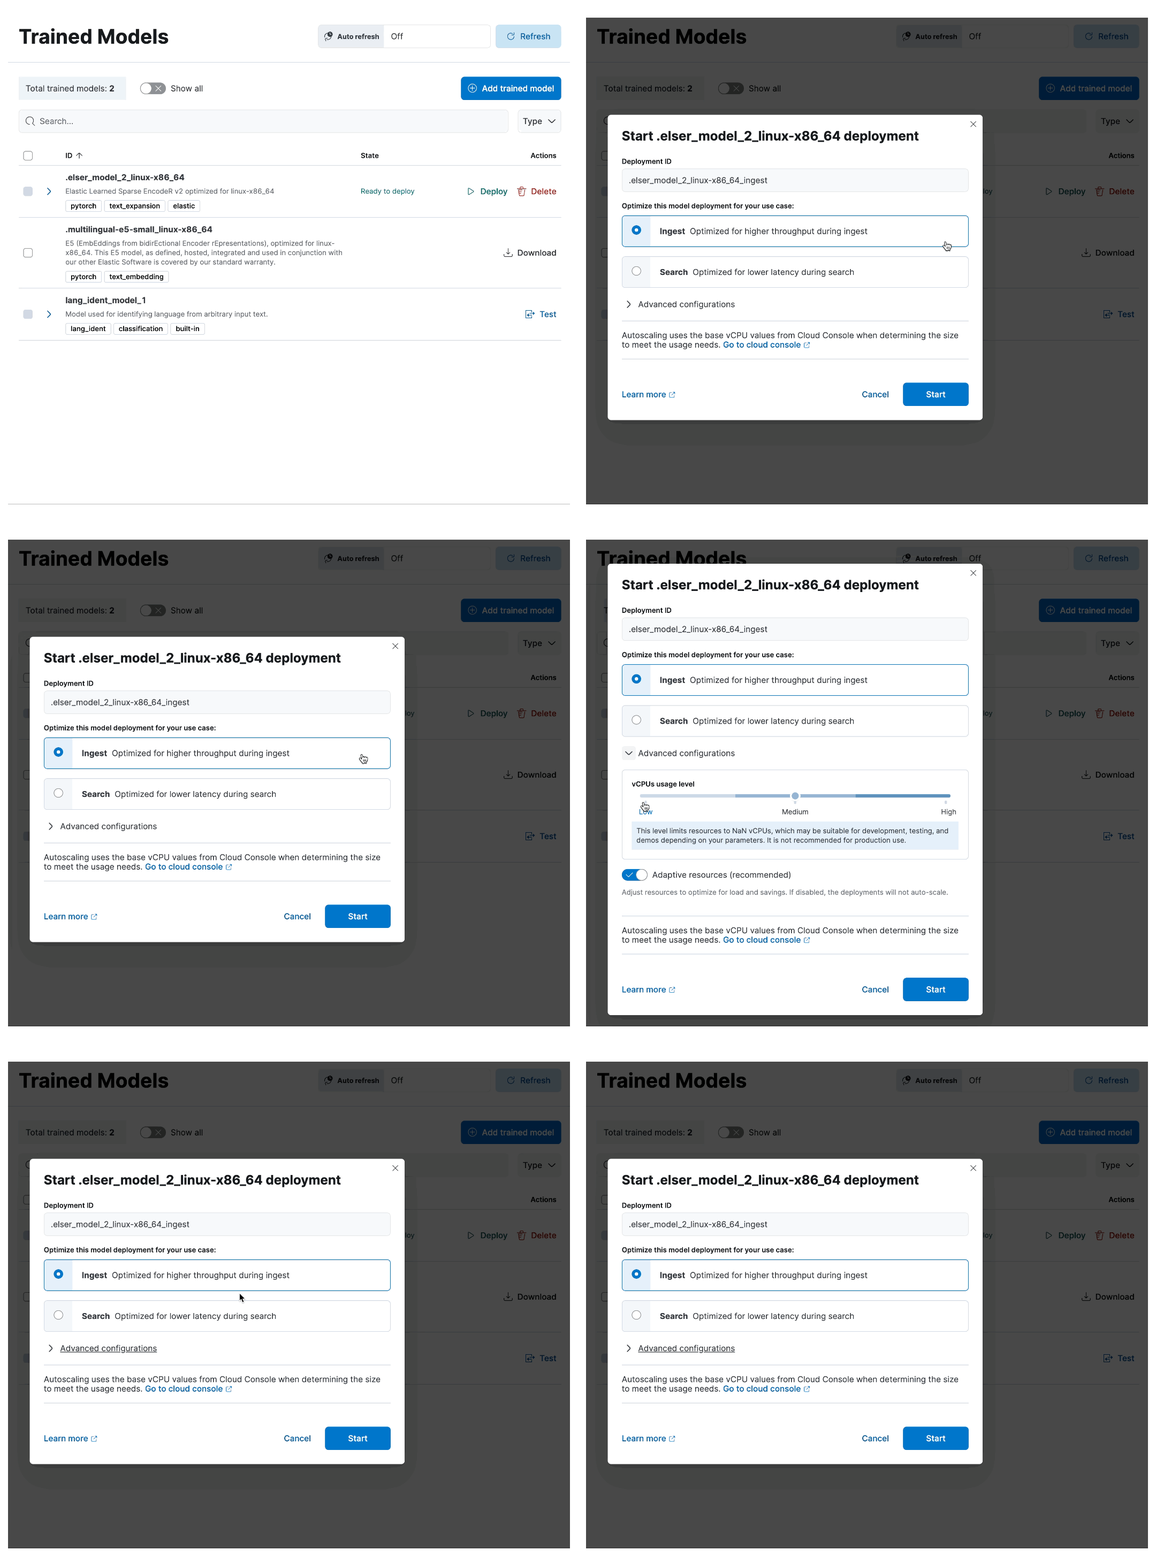
editFrom 8.16, ELSER and the other AI search and NLP models you use in Elastic automatically adapt resource consumption according to the inference load, providing the performance you need during peak times and reducing the cost during slow periods, all the way down to zero cost during idle times.
We’re also improving the UX through which you deploy your models. You can provision search-optimized and ingest-optimized model deployments with a one-click selection. An optimized configuration is created without the need to specify parameters such as threads and allocations. Combined with the flexibility of ML auto-scaling on Elastic Cloud and the incredible elasticity of Elastic Cloud Serverless, you are in full control of both performance and cost.
In addition, from 8.16 you can choose between a word or sequence-based chunking strategy to use with your trained models, and you can also customize the maximum size and overlap parameters. A suitable chunking strategy can result in gains depending on the model you use, the length and nature of the texts and the length and complexity of the search queries.
Support for Daylight Saving Time changes in Anomaly Detection
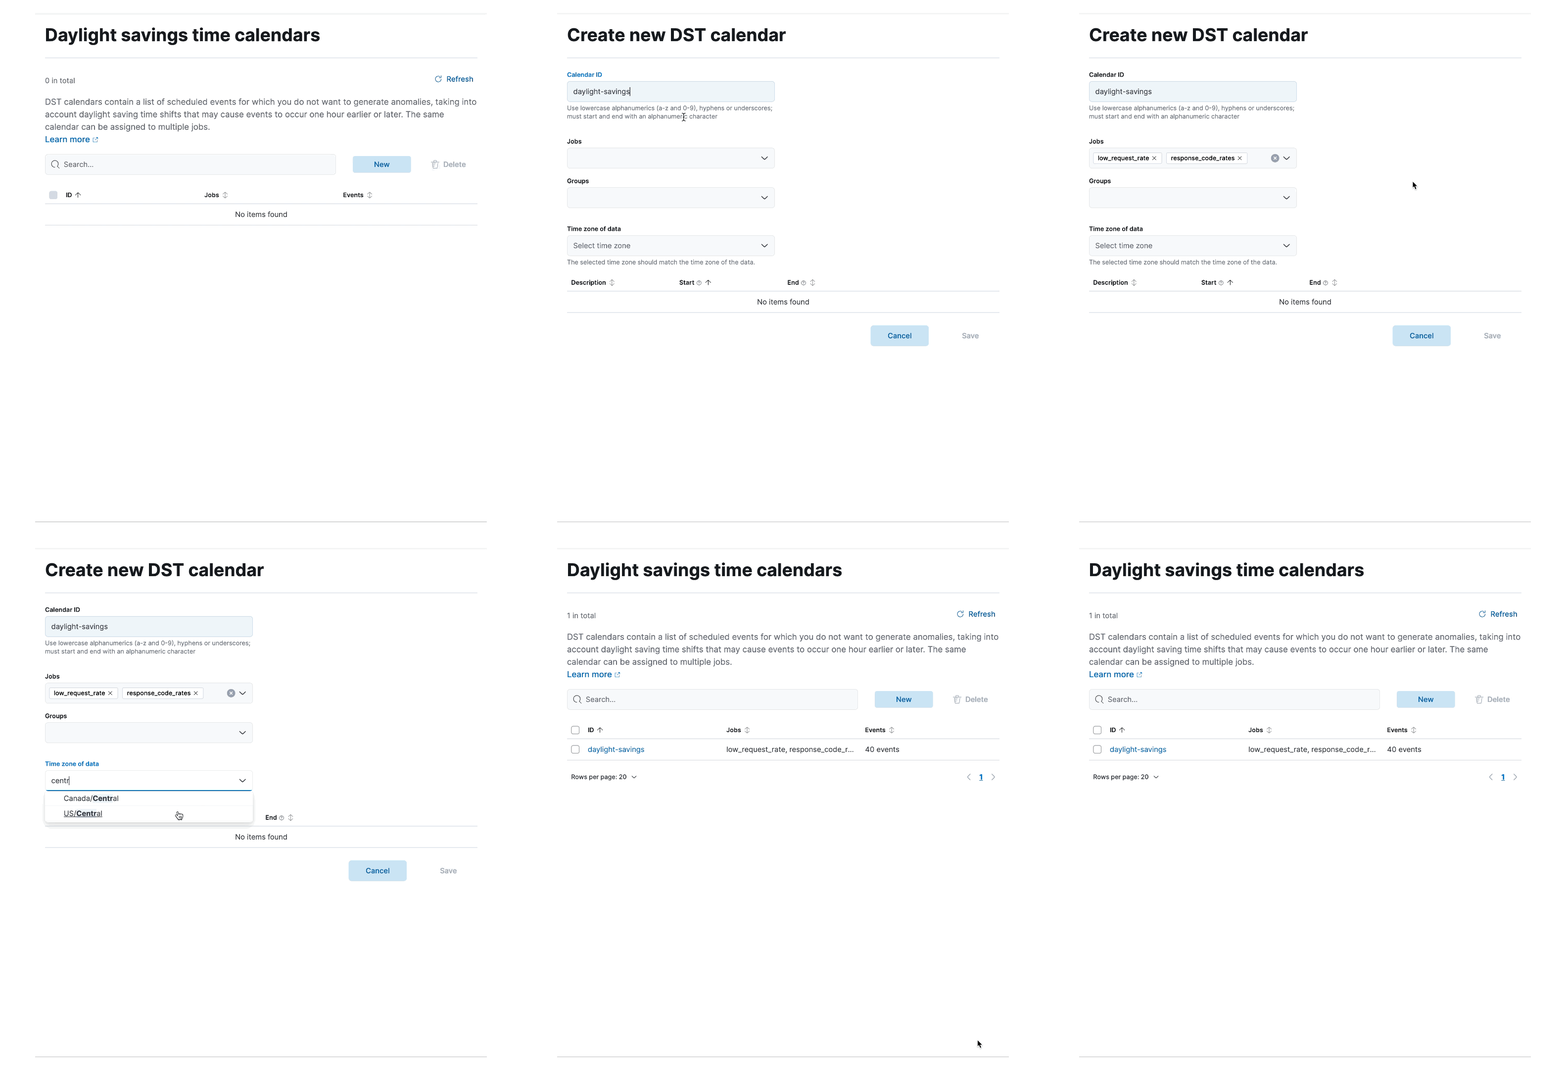
editIn 8.16, we are introducing support for DST changes in Anomaly Detection. Set up a DST calendar by selecting the right timezone and apply it to your anomaly detection jobs individually or in groups. This feature eliminates any false positives that you may have experienced previously due to Daylight Saving Time changes, and works without the need for your intervention for many years ahead.
