What’s new in 8.13
editWhat’s new in 8.13
editHere are the highlights of what’s new and improved in 8.13. For detailed information about this release, check the release notes.
Previous versions: 8.12 | 8.11 | 8.10 | 8.9 | 8.8 | 8.7 | 8.6 | 8.5 | 8.4 | 8.3 | 8.2 | 8.1 | 8.0
Discover
editEmpty fields improvements in Discover, Lens & ES|QL
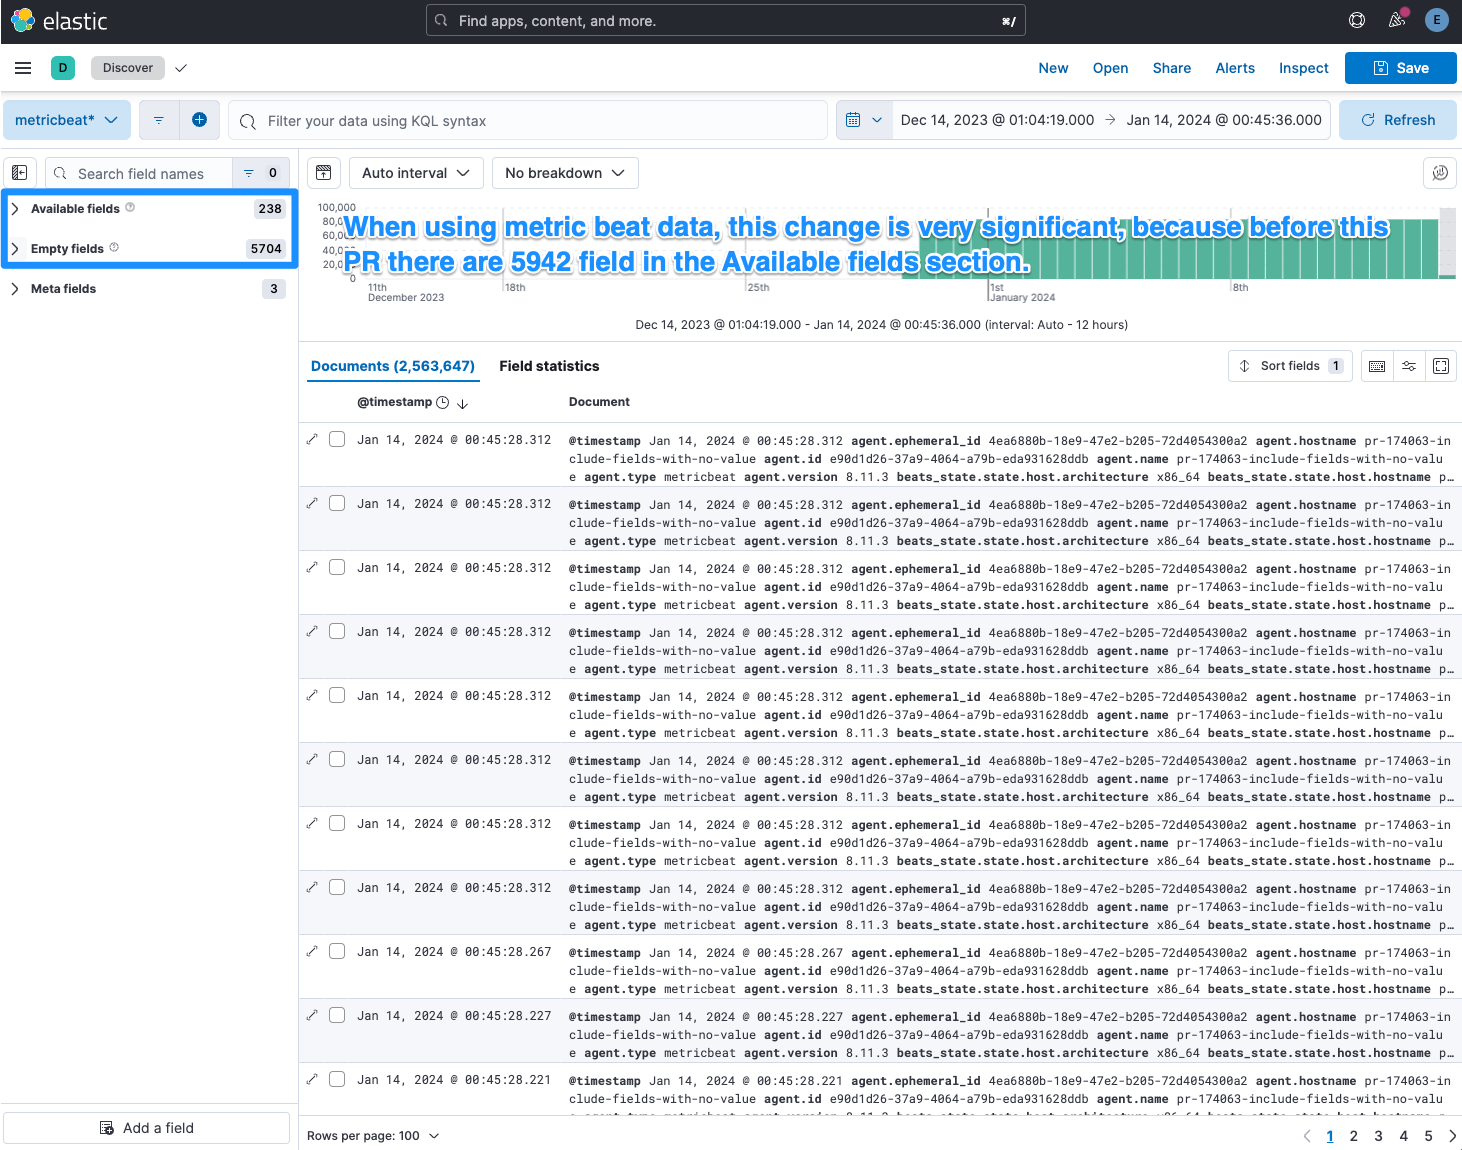
editNavigating through extensive data can often lead users to encounter numerous Empty fields within their field lists, making it challenging to identify and access valuable data efficiently. To address this issue, we’ve focused our efforts on enhancing the Empty fields category. Our solution simplifies the process of finding and accessing fields that contain meaningful data, ensuring a more streamlined and productive data exploration experience for our users.
In some cases this can have a huge impact on field lists that target indices with many fields, such as in the below example where the field list was reduced from 5,492 fields down to only 238.
Discover enhancements
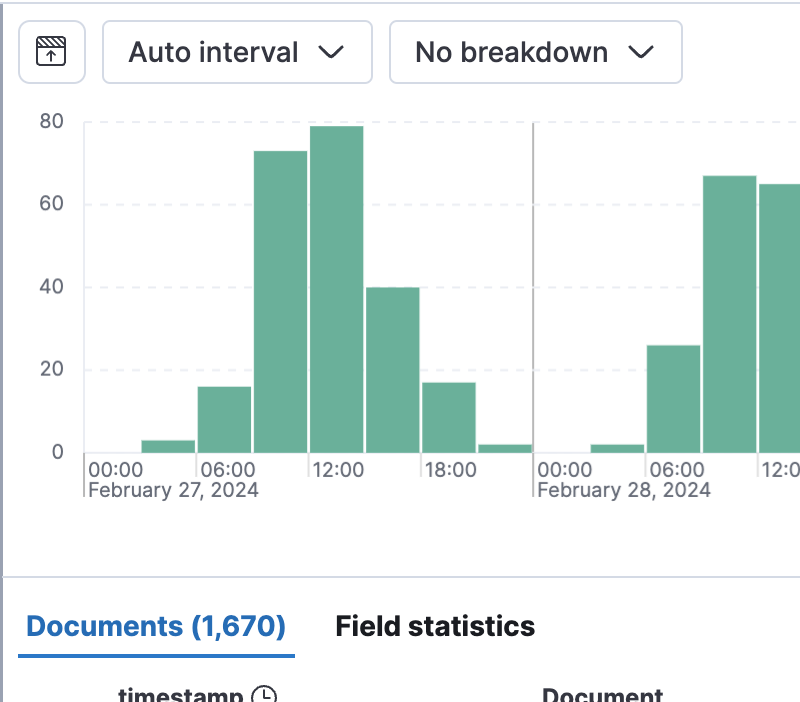
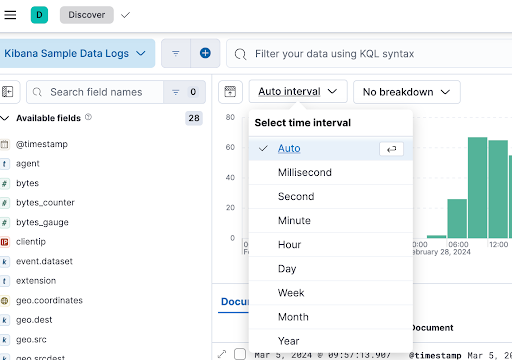
editImproving the experience in Discover when users are exploring their data helps them find insights quickly. In 8.13 we added the Auto Interval to the Histogram, which allows users to quickly select a Time Interval. We also enhanced the UI by moving the count of documents to the table and new panel toggle buttons for toggling fields sidebar and histogram.
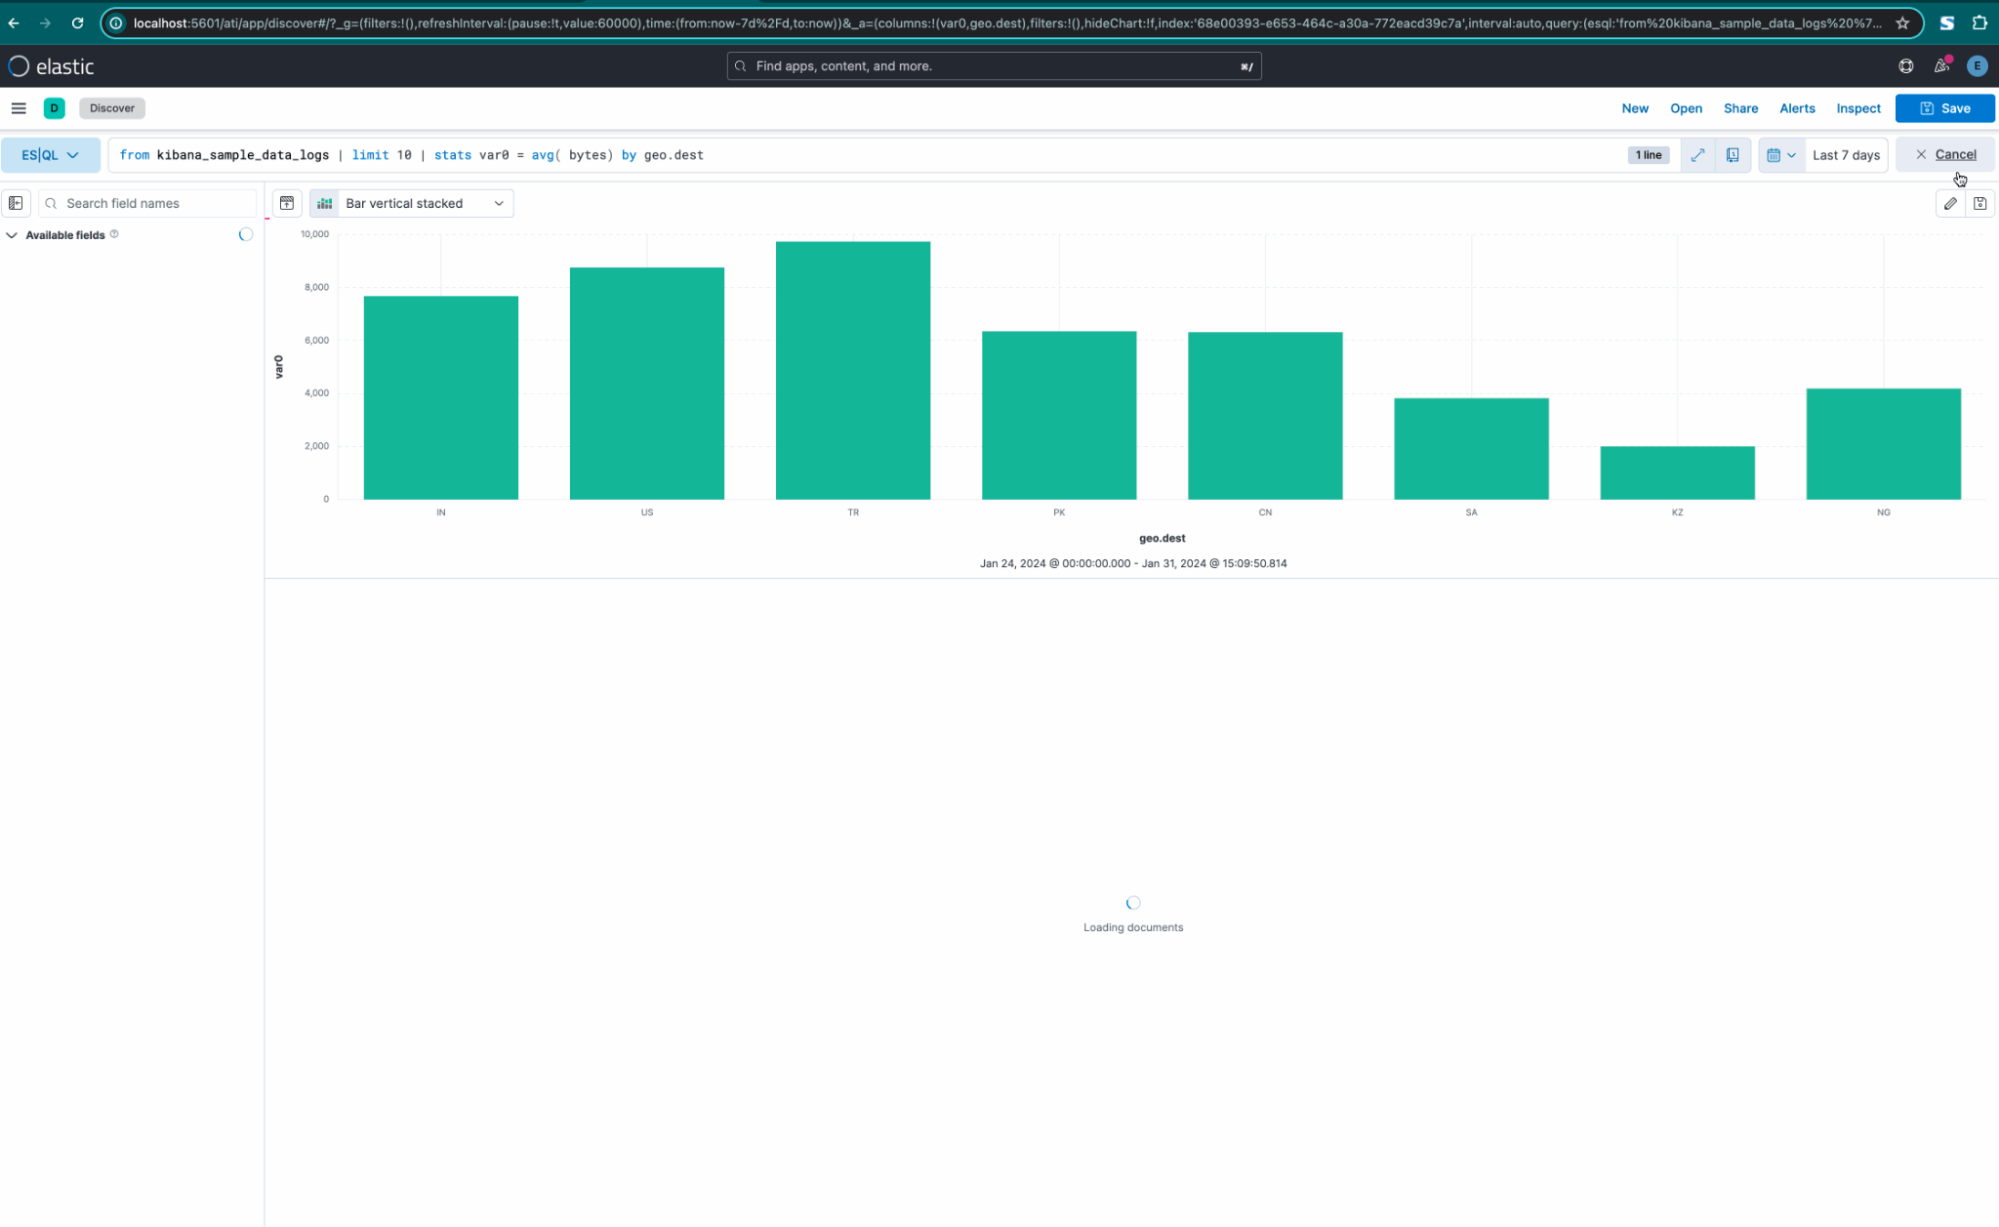
Cancellation of the ES|QL long-running query
editYou can now cancel a long-running ES|QL query from the UI.
Better validation and autocomplete when writing ES|QL queries
editAutocomplete and validation are important tools to ensure the user’s ES|QL is correct and can be executed without errors. With these improvements, we are speeding up their workflow and increasing the quality of the improvements.
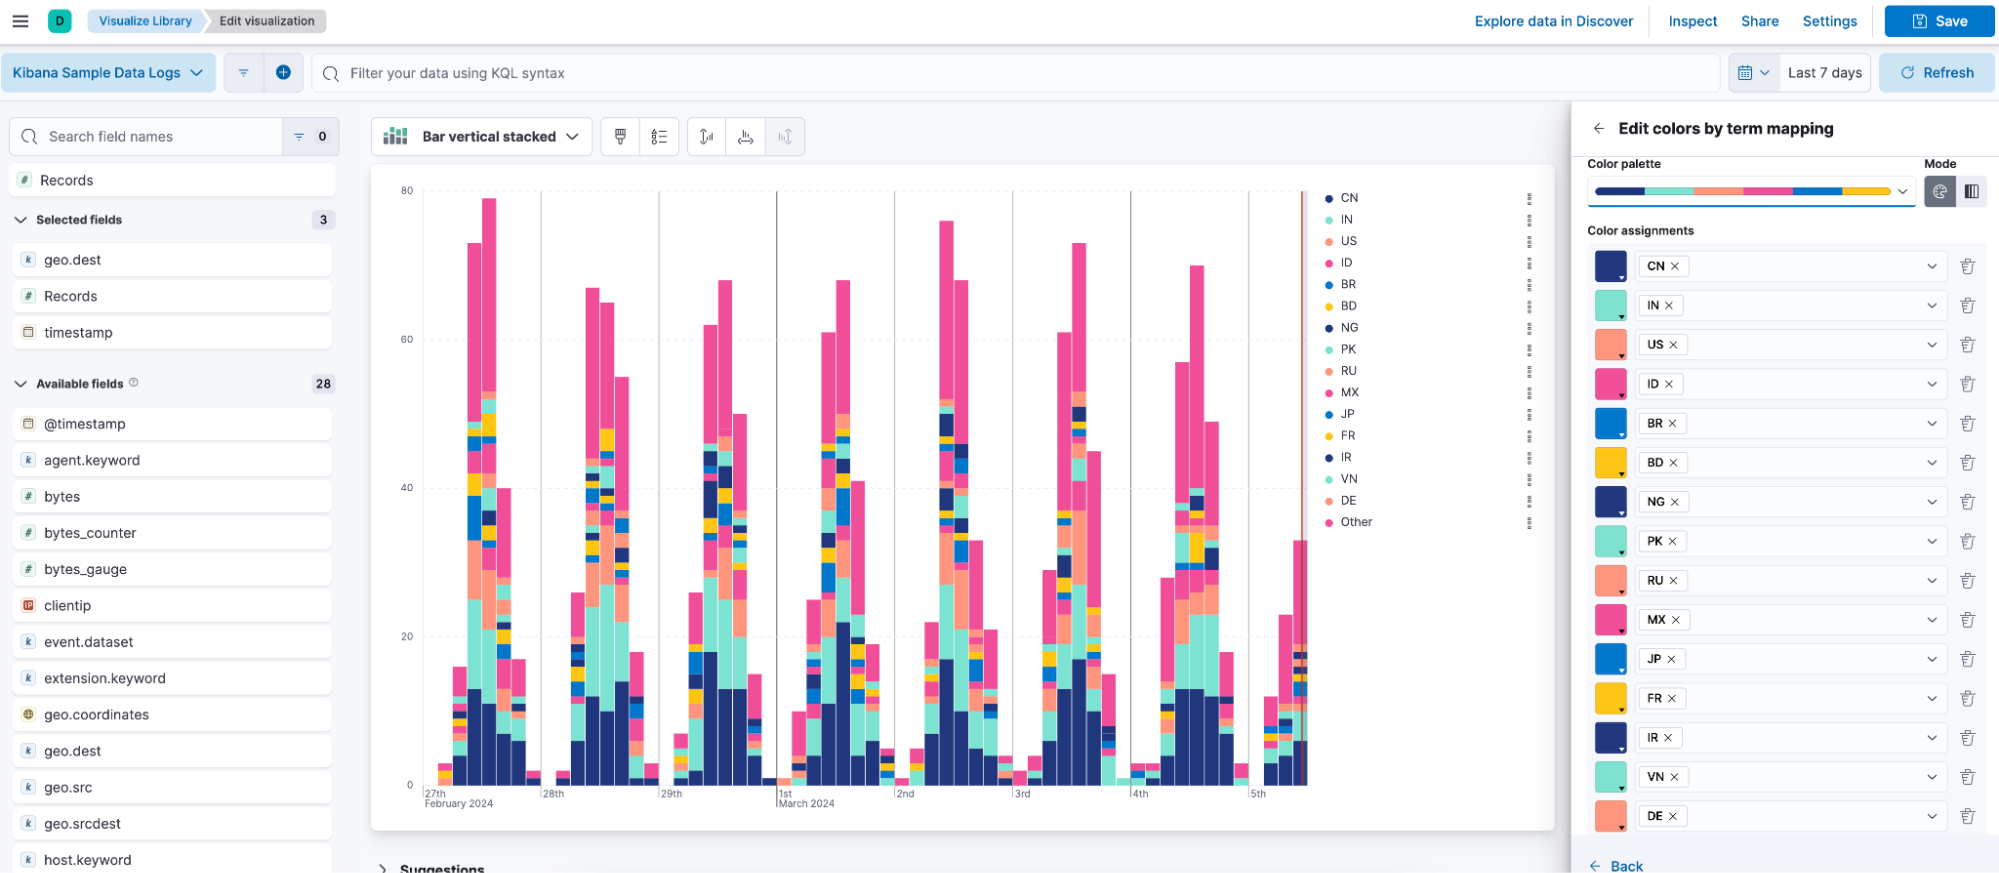
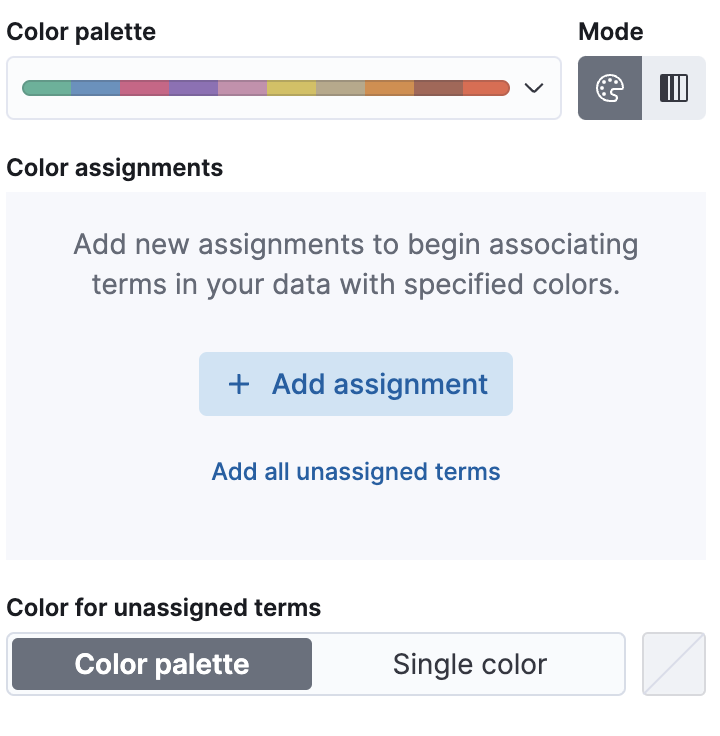
Color all terms in new color mapping
editIn our latest update, based on early feedback, we’ve enhanced the user experience with our new color mapping feature introducing a more intuitive default option. Now users can either assign a single color or enable color looping for unassigned terms, providing greater flexibility and a cleaner interface for term assignments. Additionally we’ve eliminated the maximum limit on assignments, allowing for more comprehensive customization. It’s important to note that looping colors or using more than 10 colors can be effective in certain scenarios. However, we recommend limiting the number of colors used to prevent potential misinterpretation of your charts. This update aims to make color mapping more user-friendly and adaptable to your needs.
Visualizing an ES|QL query in Observability AI assistant
editThe Observability AI assistant in 8.13 comes with great improvements in query generation and performance. Users can now visualize the generated ES|QL queries, edit them using the inline editing flyout, and embed them in a dashboard.
Cross-cluster search support in ES|QL and in Kibana
editCross-cluster searches are now supported in ES|QL and in Kibana the feature has been introduced for both validation and autocomplete. The autocomplete feature will show some documentation about the specific settings when navigating the suggestions.
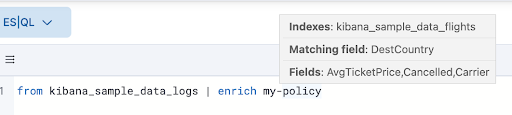
Quick fix to help users write ES|QL
editQuick fix helps users when they have misspelled a field, index, or policy name (maybe pasting a query from somewhere else) in ES|QL mode.
Create ES|QL charts directly from a dashboard
editNow you can create ES|QL charts directly from a dashboard, without the need to go through Discover. Previously, to add a chart to your dashboard, you had to first create it in Discover using ES|QL and then save it to the dashboard. This update streamlines the process, allowing you to instantly add ES|QL charts right from your dashboard!
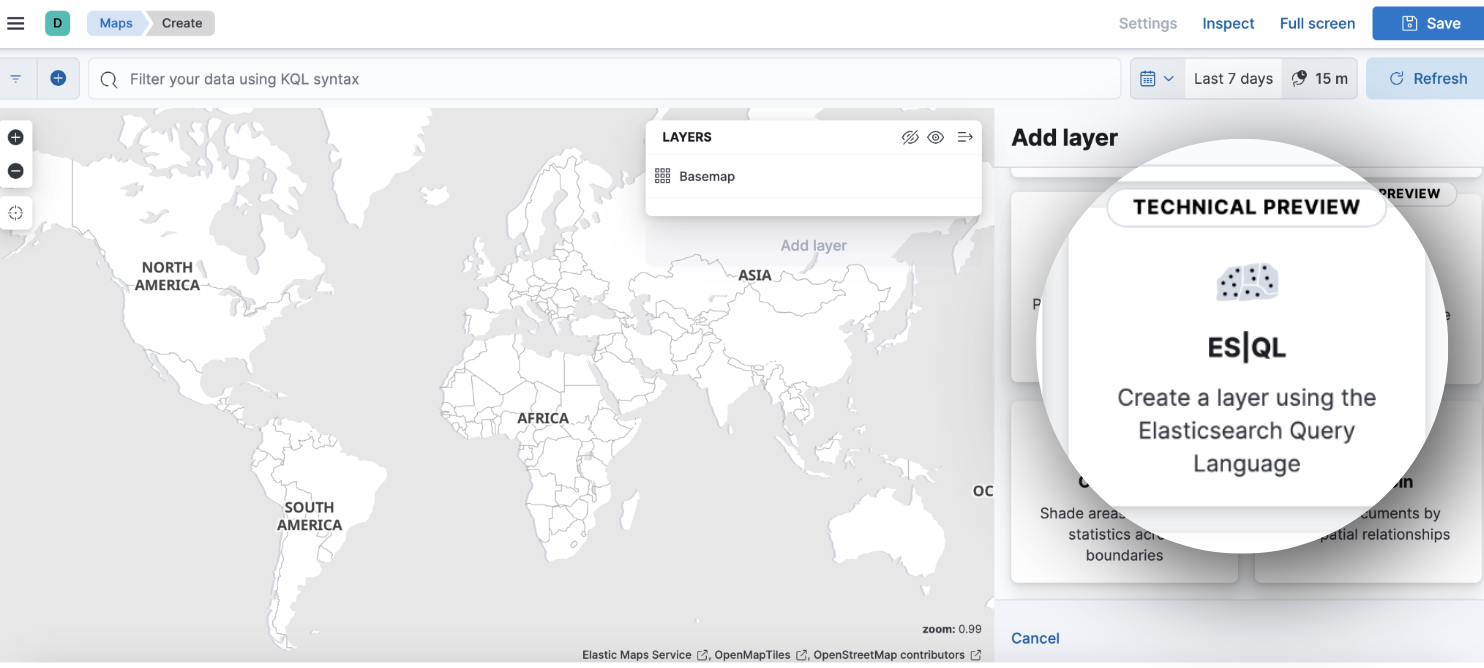
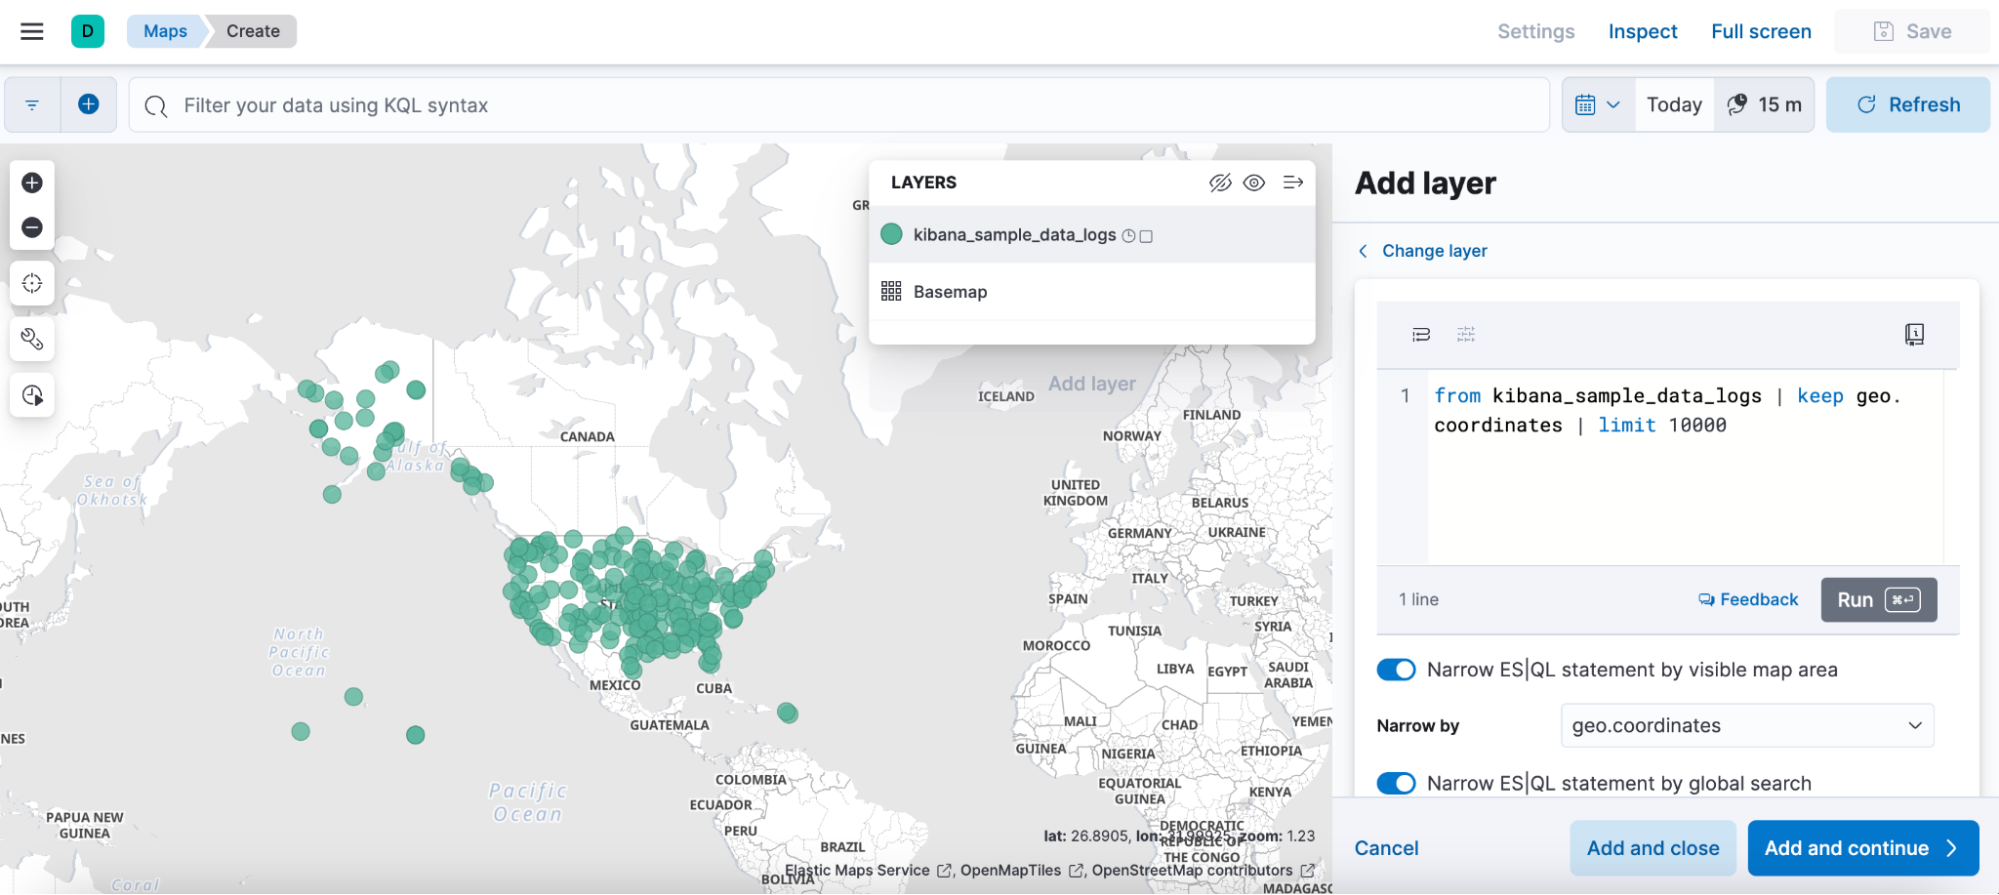
ES|QL in Maps
editYou can now create a new documents layer in map using our recently launched ElasticSearch Query Language (ES|QL). You can query your data directly from Elasticsearch and leverage the benefits that ES|QL brings such as speed and flexible data transformations to your maps.
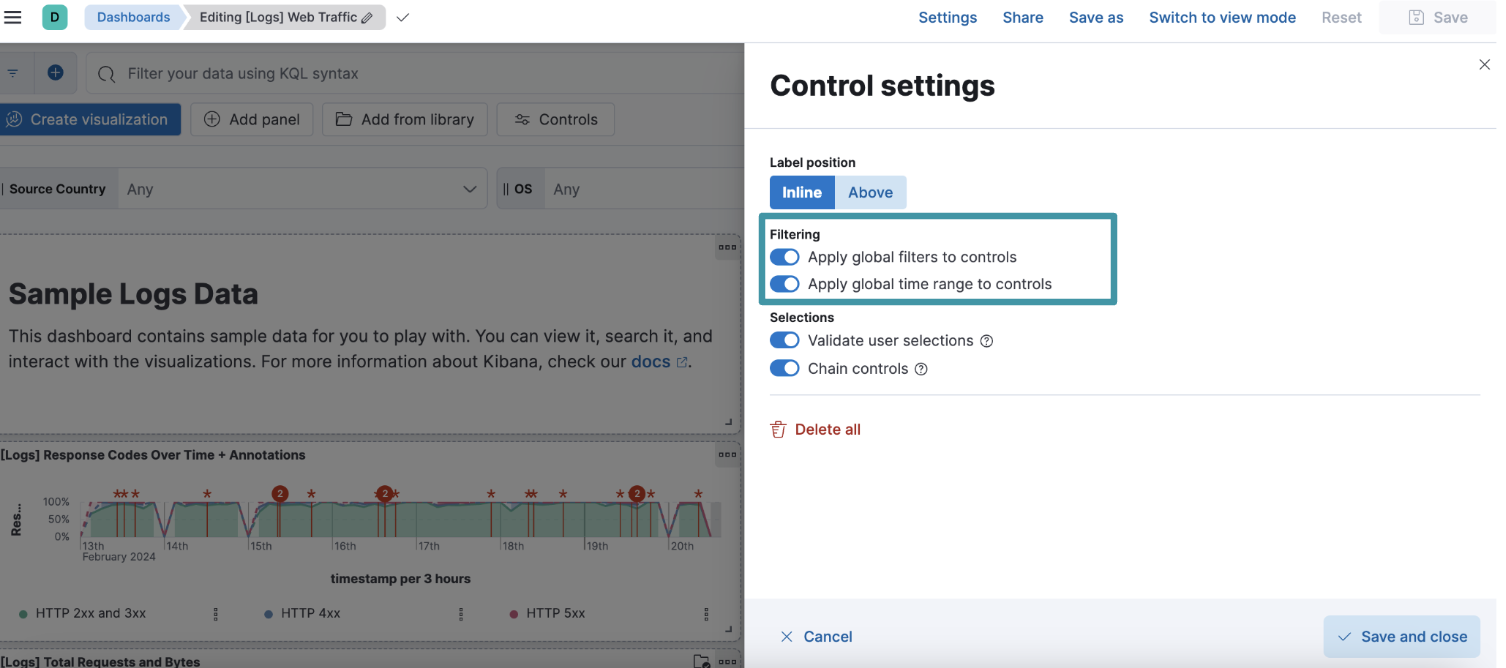
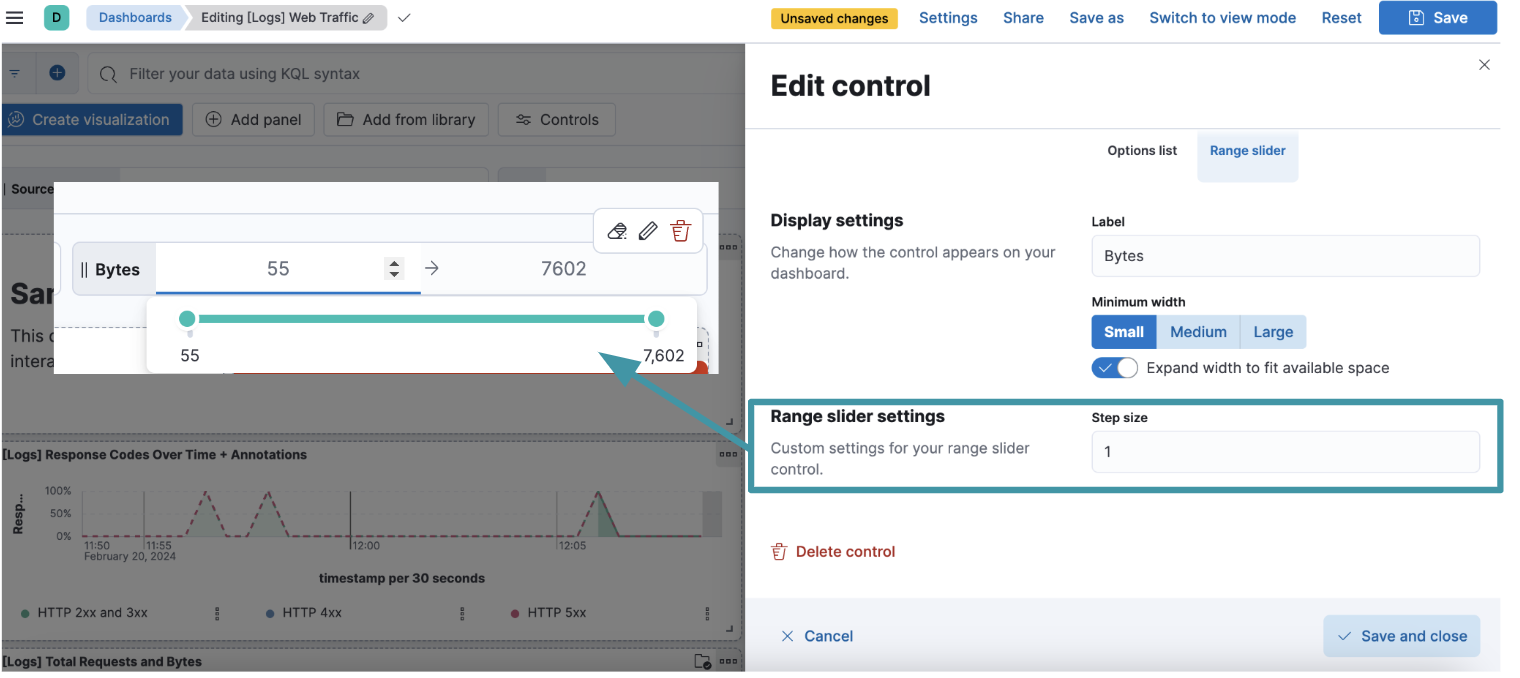
Controls configuration
editWe added some improvements to controls for you to easily filter and interact with your dashboards.
- You will be able to decide whether you want the global filters and time range to be applied to your controls narrowing down the available options or whether you prefer to display all possible values without considering them. You will find these options in the Controls settings.
- If you have numeric fields displayed as range slider controls in your dashboard, you will now be able to decide what is the step that you want to be displayed between your values.
ResponseOps
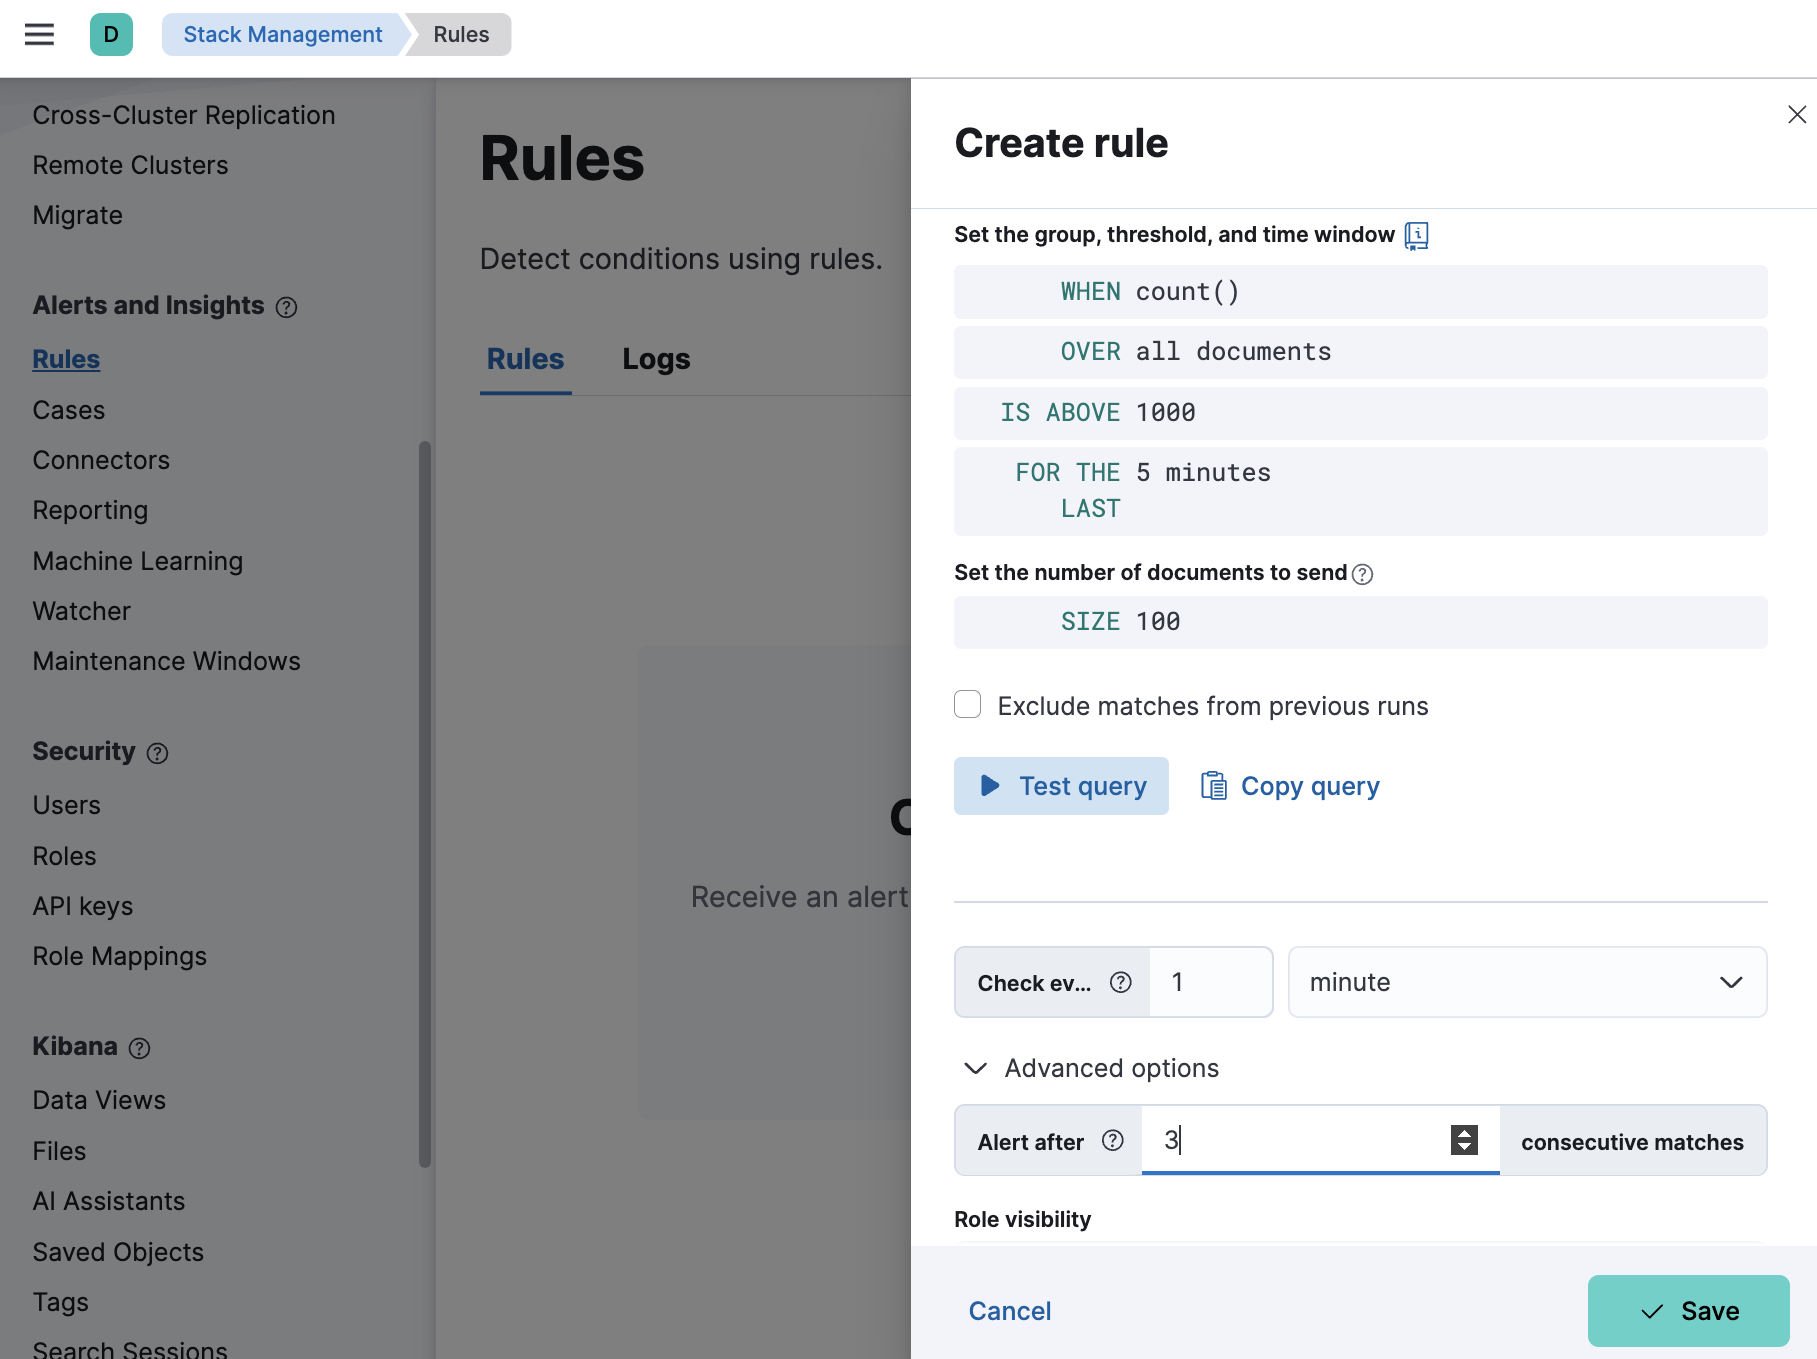
editAlert delay
editIn order to reduce noise for alerting rules with low sensitivity and ensure created alerts will be actionable and reasonable, we want to allow users to define how many rule runs should match before creating the alert. For example, "Generate the alert after 3 threshold matches in a row".
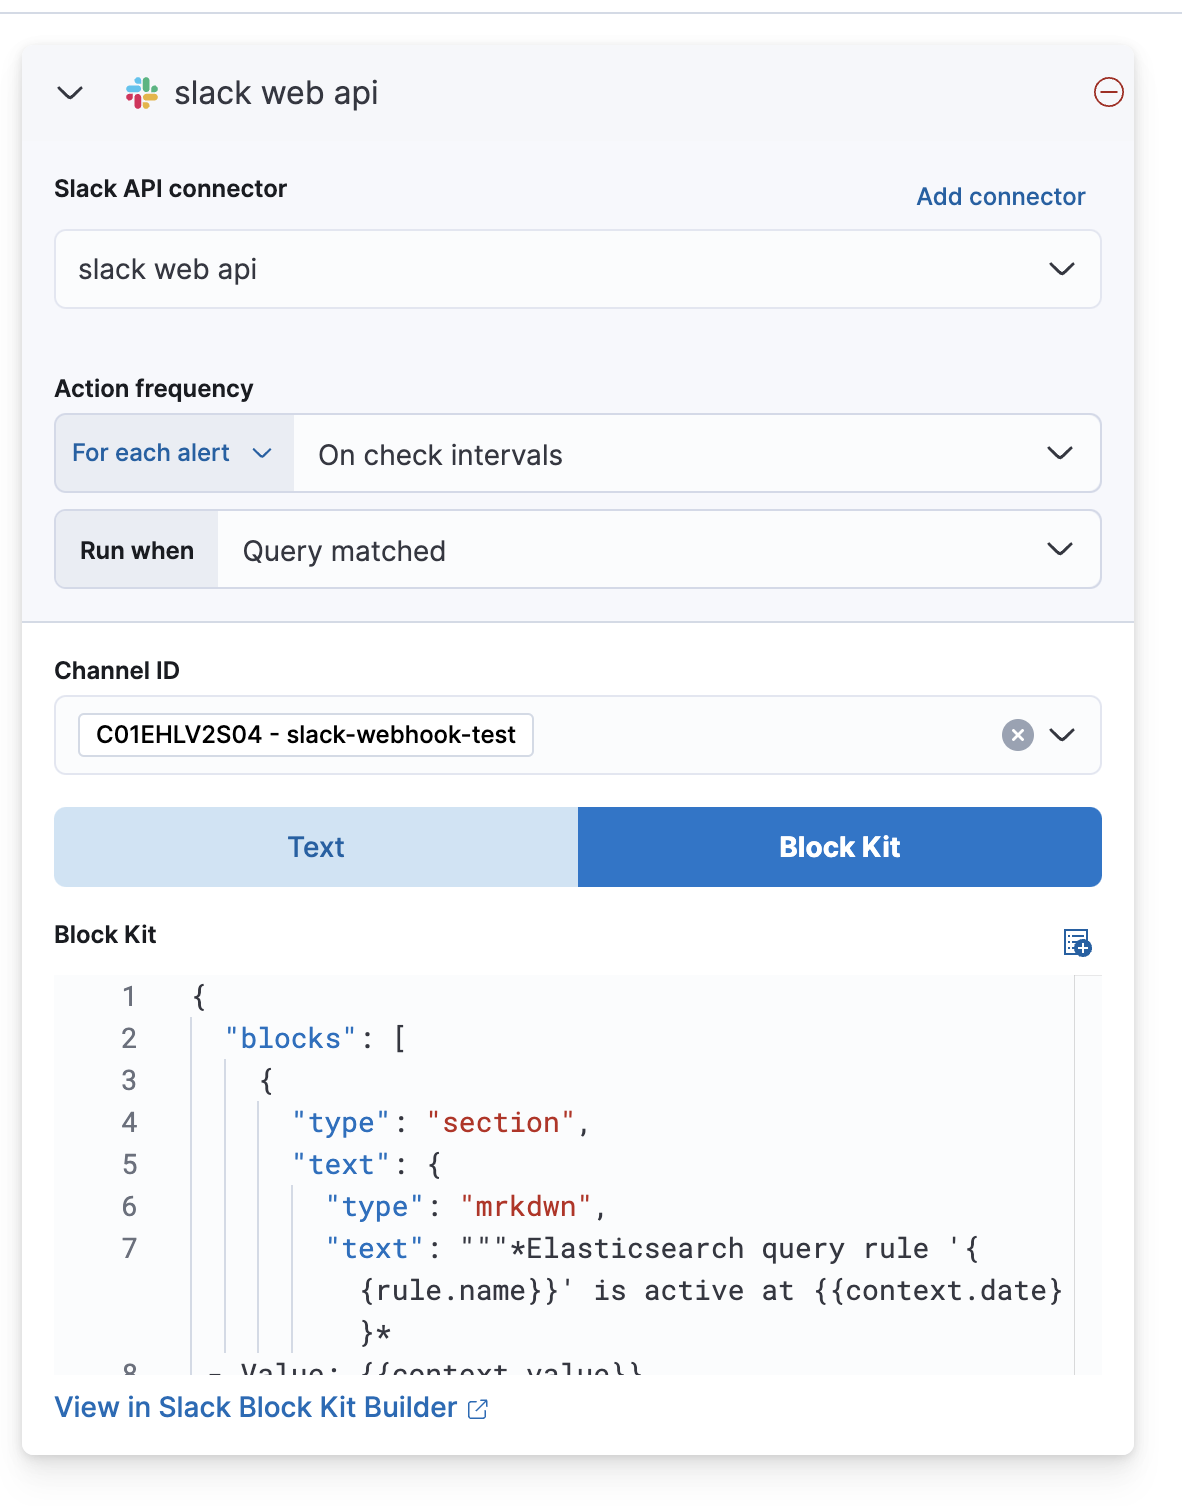
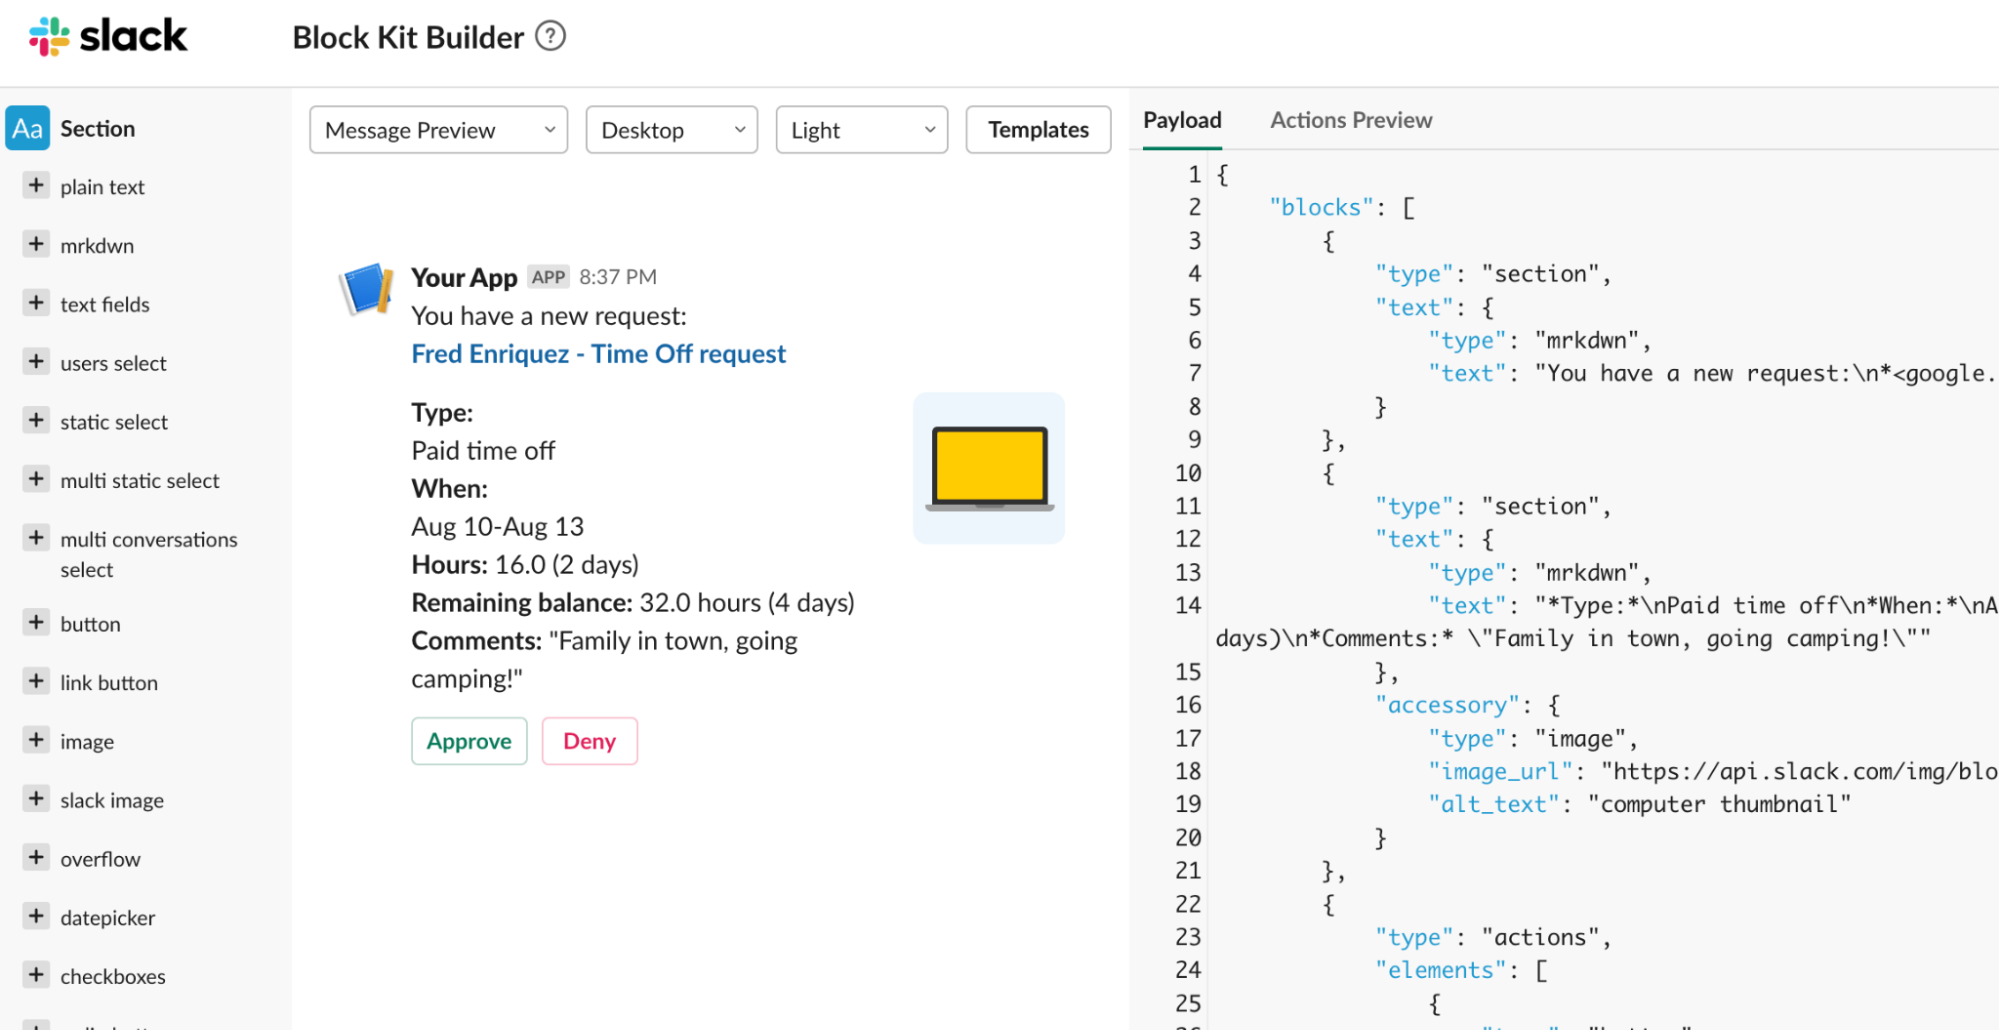
Slack action message templating using Slack Block Kit
editBy supporting the Slack Block Kit with our Slack connector (Web API), we unlock new message templates to allow users to enrich and format the messages that are sent to Slack channels. Read more about templates options with Slack Block Kit.
Machine Learning
editUnified inference API now integrates Cohere embeddings
editWe continue enhancing Elastic’s unified inference API which supports both internal and external models for seamless easy integration with the LLM ecosystem.
In 8.13 we add support for Cohere embeddings. This enhances our offering which supports OpenAI and HuggingFace embeddings since 8.12.
The power of the inference API lies in its simple, unified syntax that abstracts away the underlying complexity of using different internal and external models.
So, in 8.13 we also added support for inference against the E5 multilingual embeddings that were offered through the Trained Models UI since 8.12.
As a reminder, performing inference on the newly supported models and services is as simple as a call with the simple syntax introduced in 8.11:
PUT /_inference/<task_type>/<model_id>
To start using Cohere embeddings with your Elastic deployment using the new inference API, please see this tutorial. This functionality is in Technical Preview in 8.13.
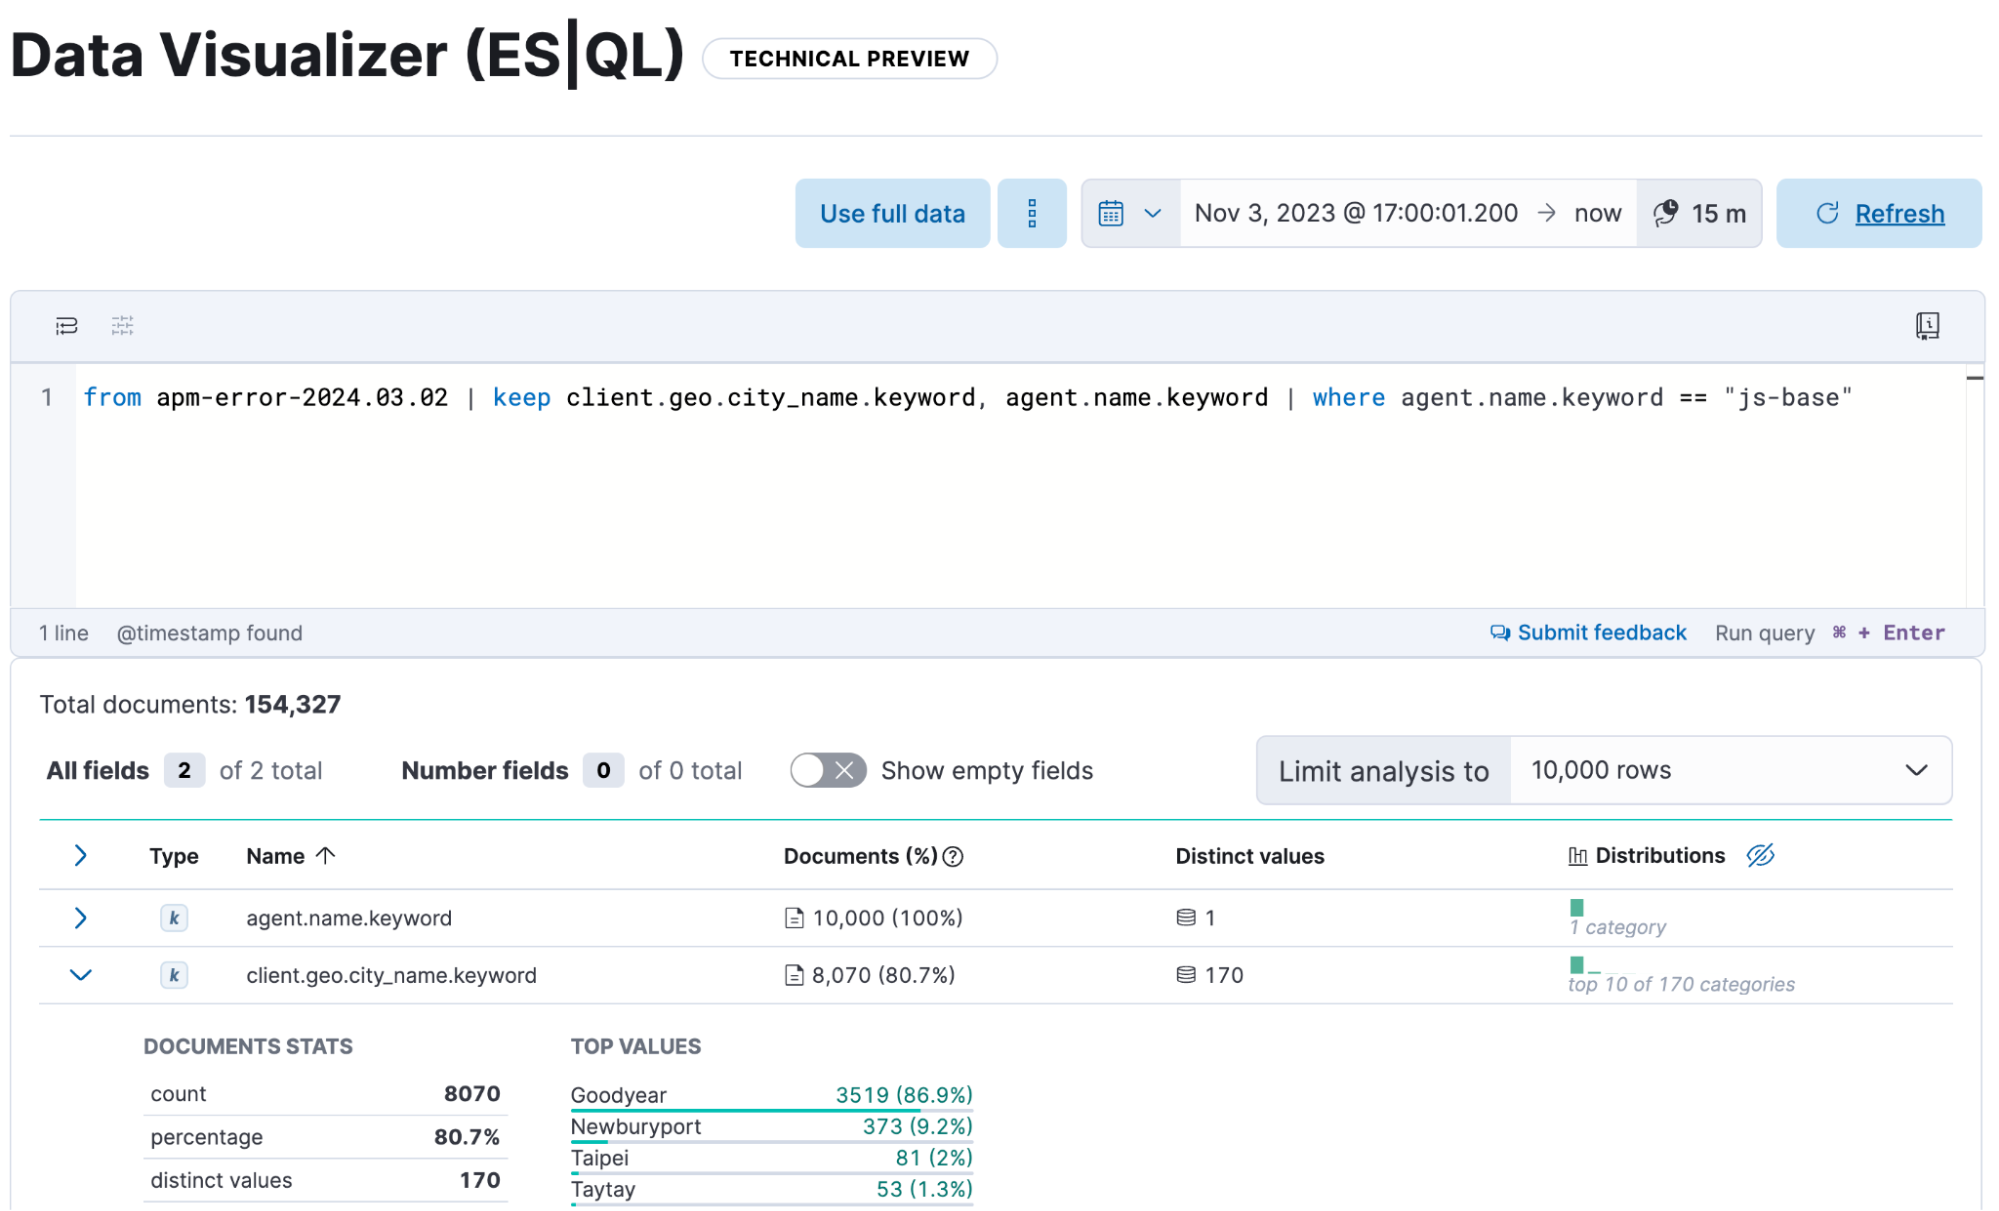
ES|QL support in the Data Visualizer
edit[preview] This functionality is in technical preview and may be changed or removed in a future release. Elastic will work to fix any issues, but features in technical preview are not subject to the support SLA of official GA features. The Data Visualizer now supports ES|QL, Elastic’s new piped query language that simplifies data investigation. Run your ES|QL queries in the Data Visualizer to easily explore your datasets. Choose to explore and apply your query to the entire dataset or a subset of it for speed. In 8.13 this functionality is in Technical Preview and supports keyword, text, numeric, boolean, date, and ip fields.
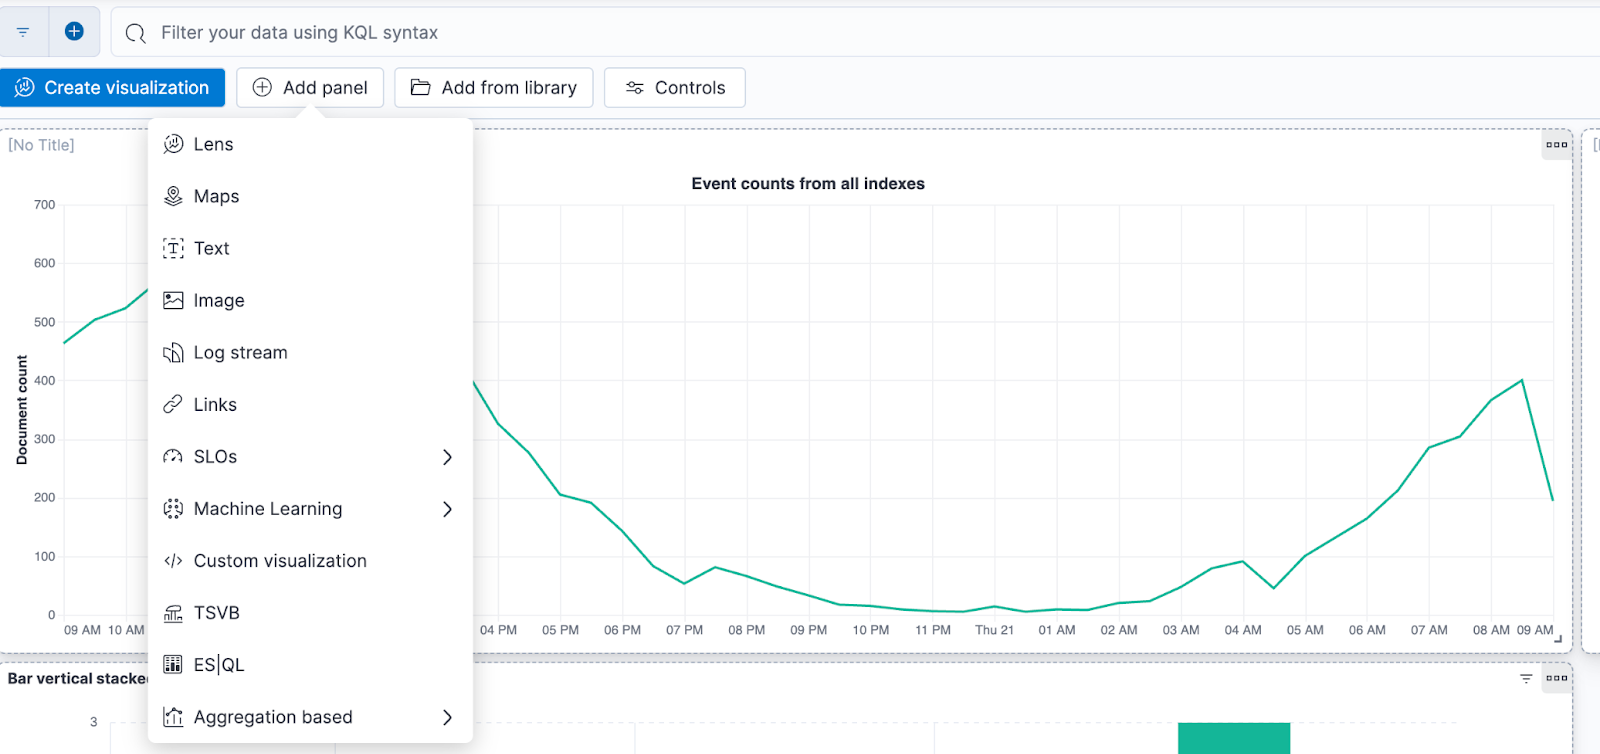
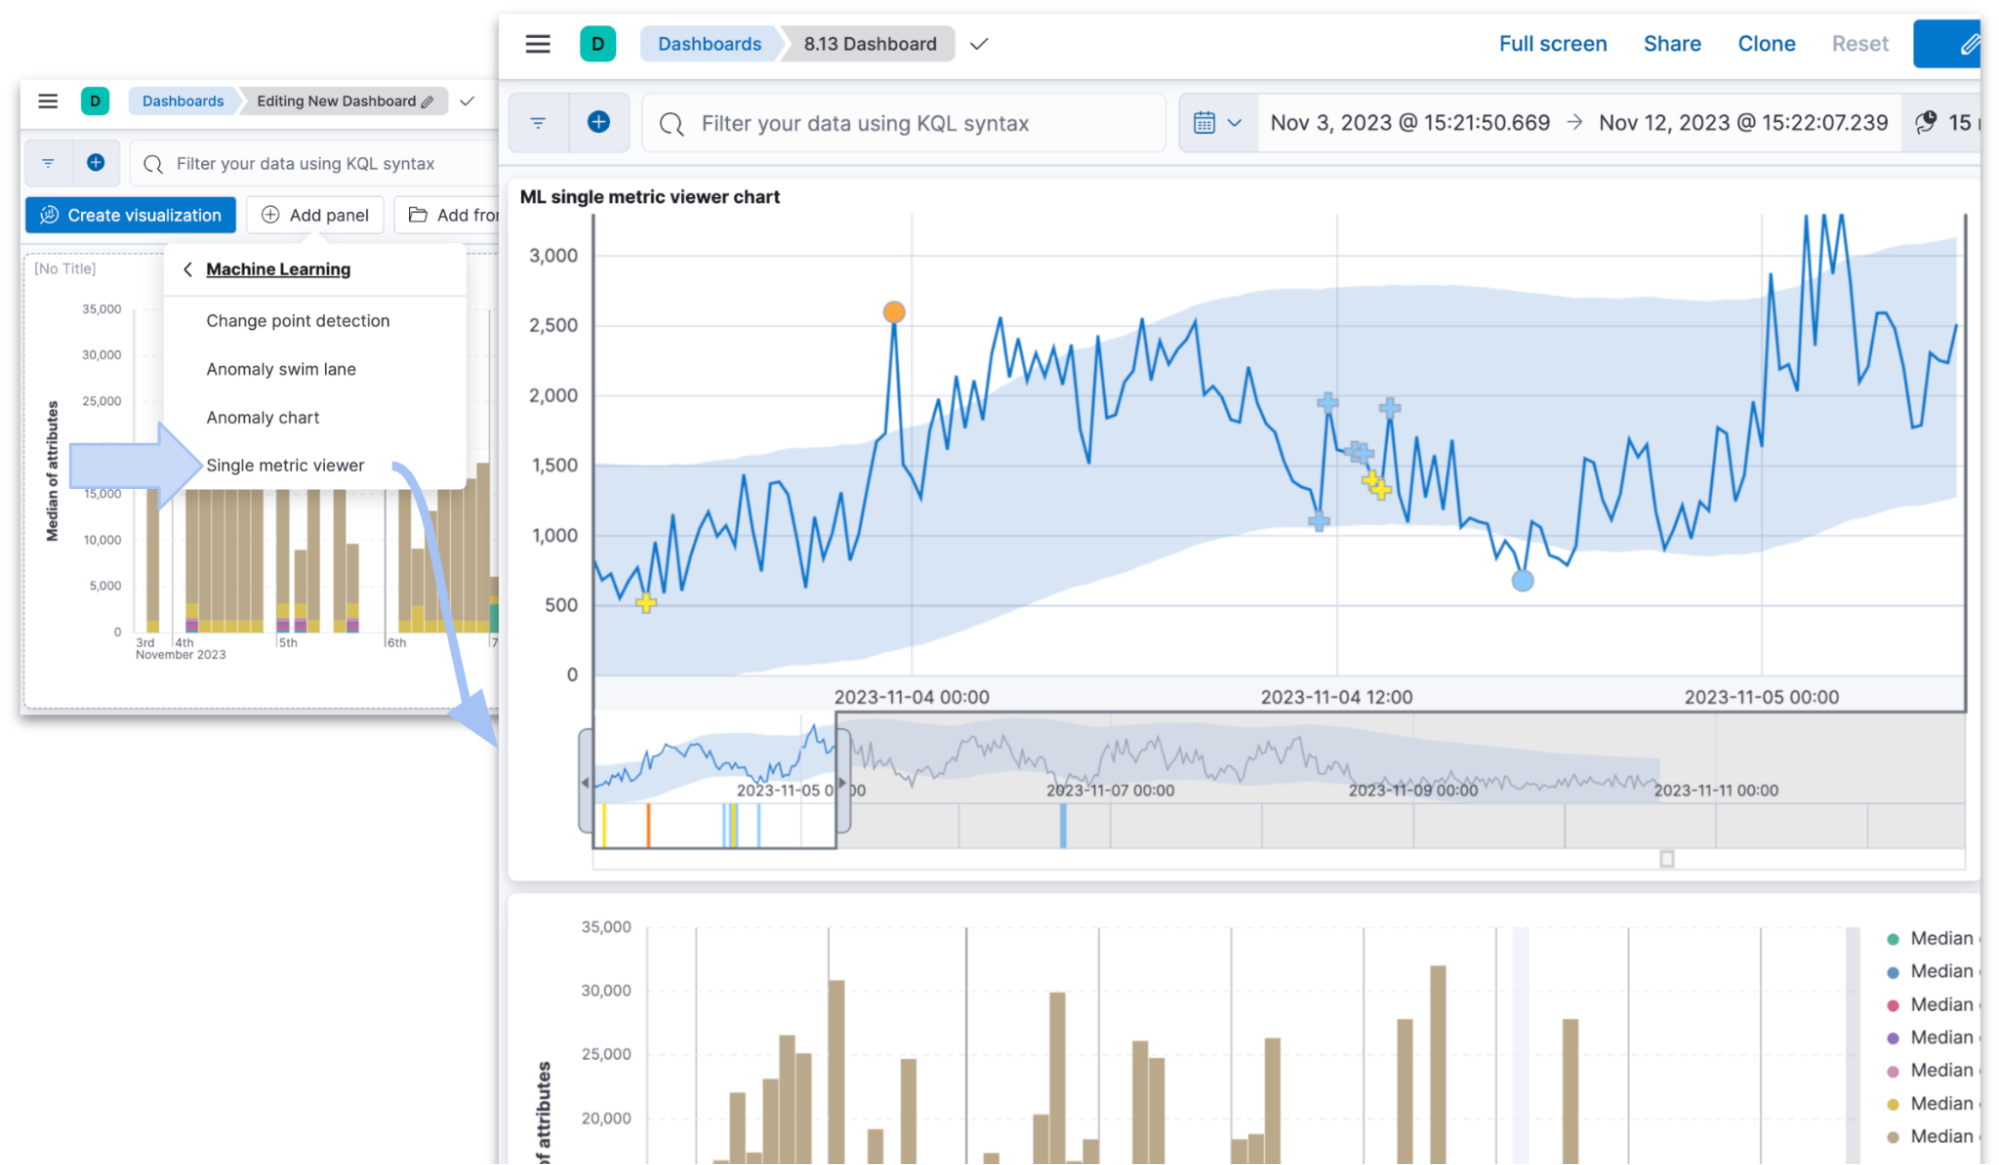
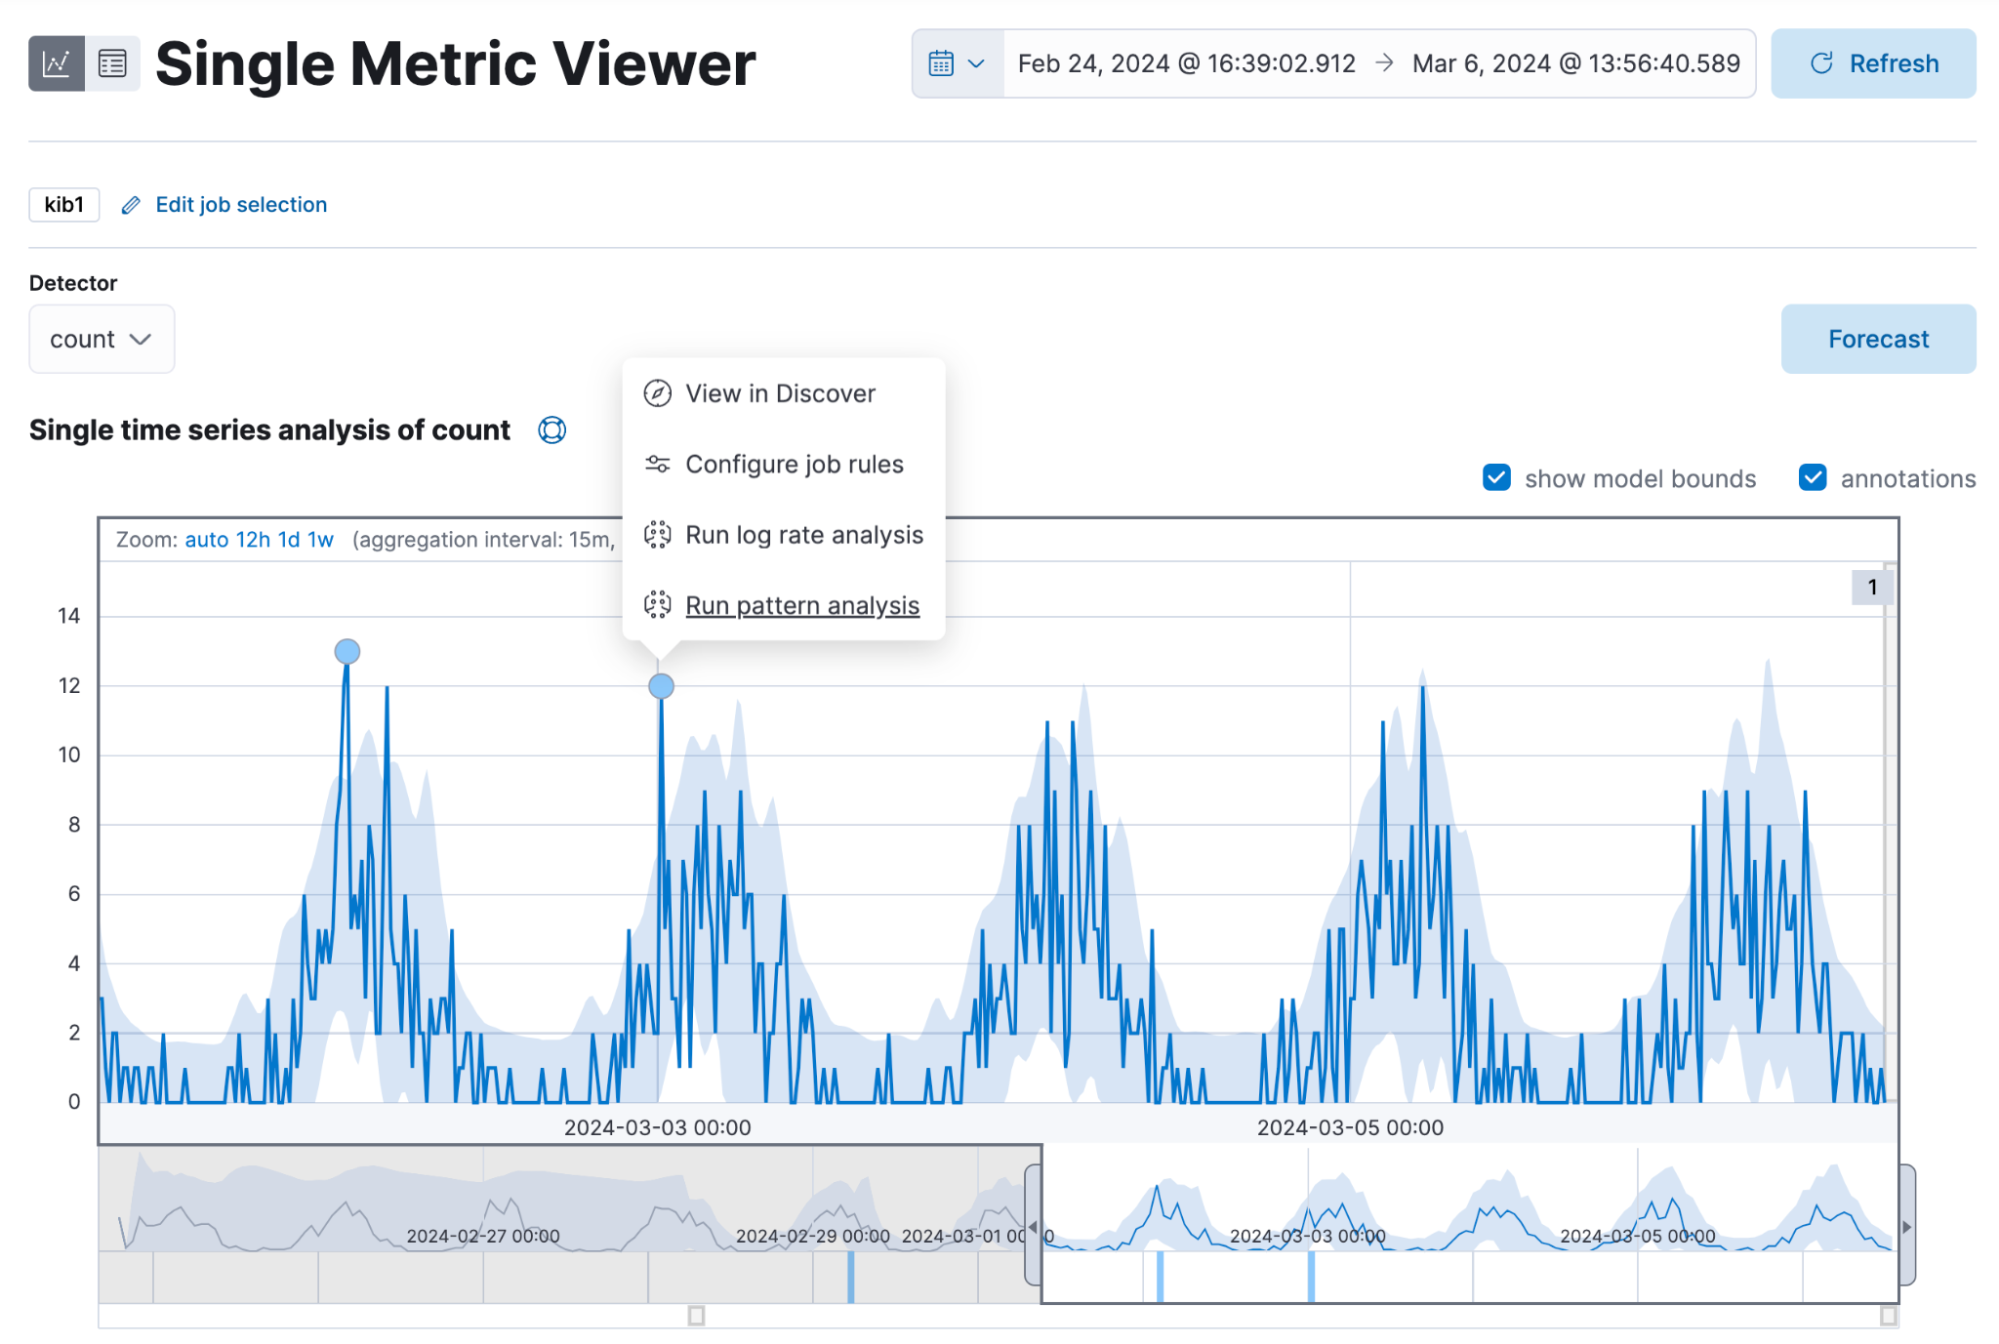
Embed Anomaly Detection Single Metric Viewer in Dashboards
editYou can now easily add single metric anomaly detection charts to dashboards. Under the Add panel option in Dashboard’s edit mode, select Machine Learning and then the Single metric viewer option from the menu.
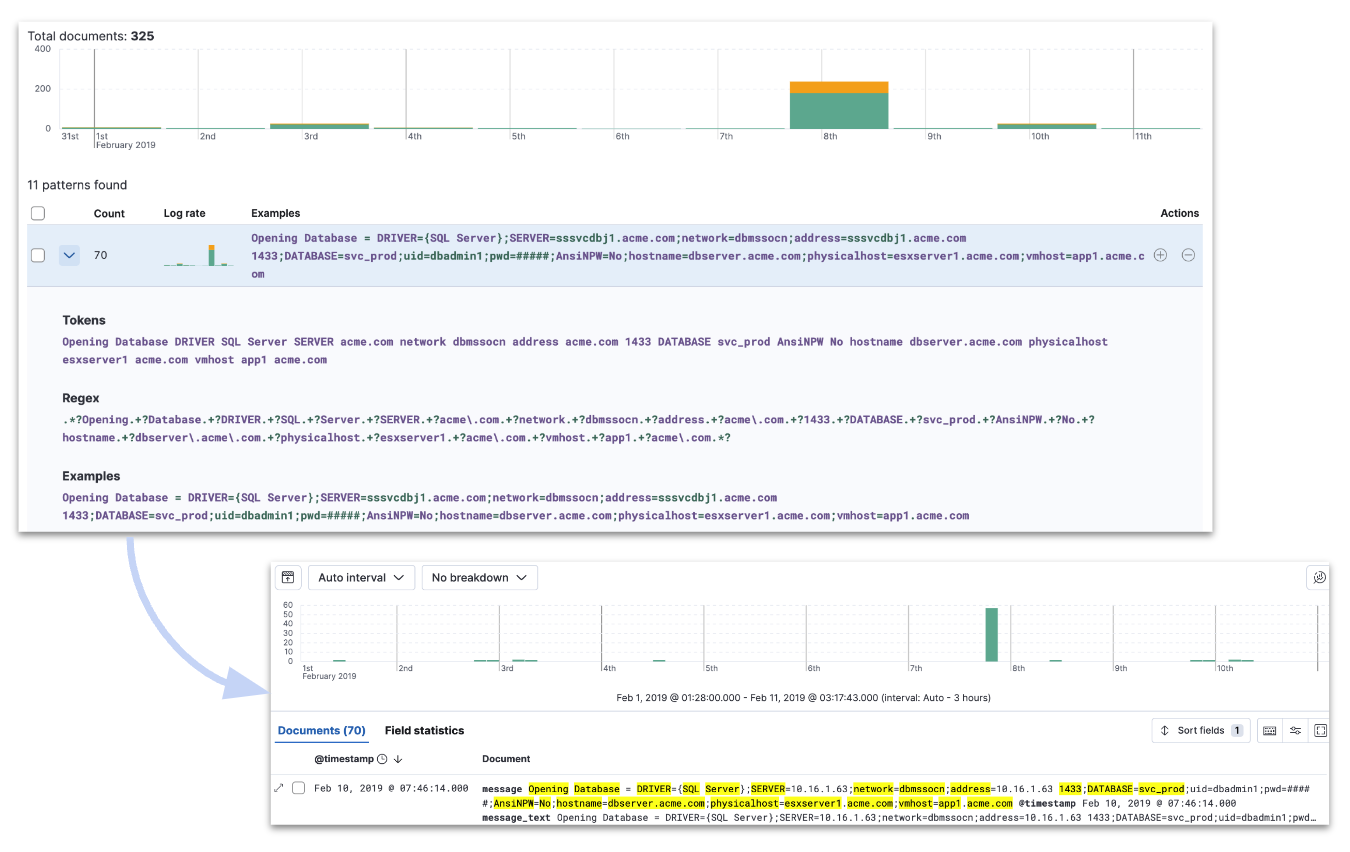
AIOps: Usability enhancements
editWe have enhanced Pattern Analysis in AIOps so that you can expand a row and see the tokens, the regex and a few examples that give you a better sense of the pattern. In addition the syntax highlighting (font color) reflects the detected pattern. When you choose to filter a pattern in Discover’s main view, the highlighting is now consistent between the Pattern Analysis feature and Discover.
You can now run Log Rate Analysis from the Anomaly Explorer and the Single Metric Viewer. Click on the Actions cog and select Run log rate analysis from the menu. You will be directed to the Log Rate analysis UI in Machine Learning.
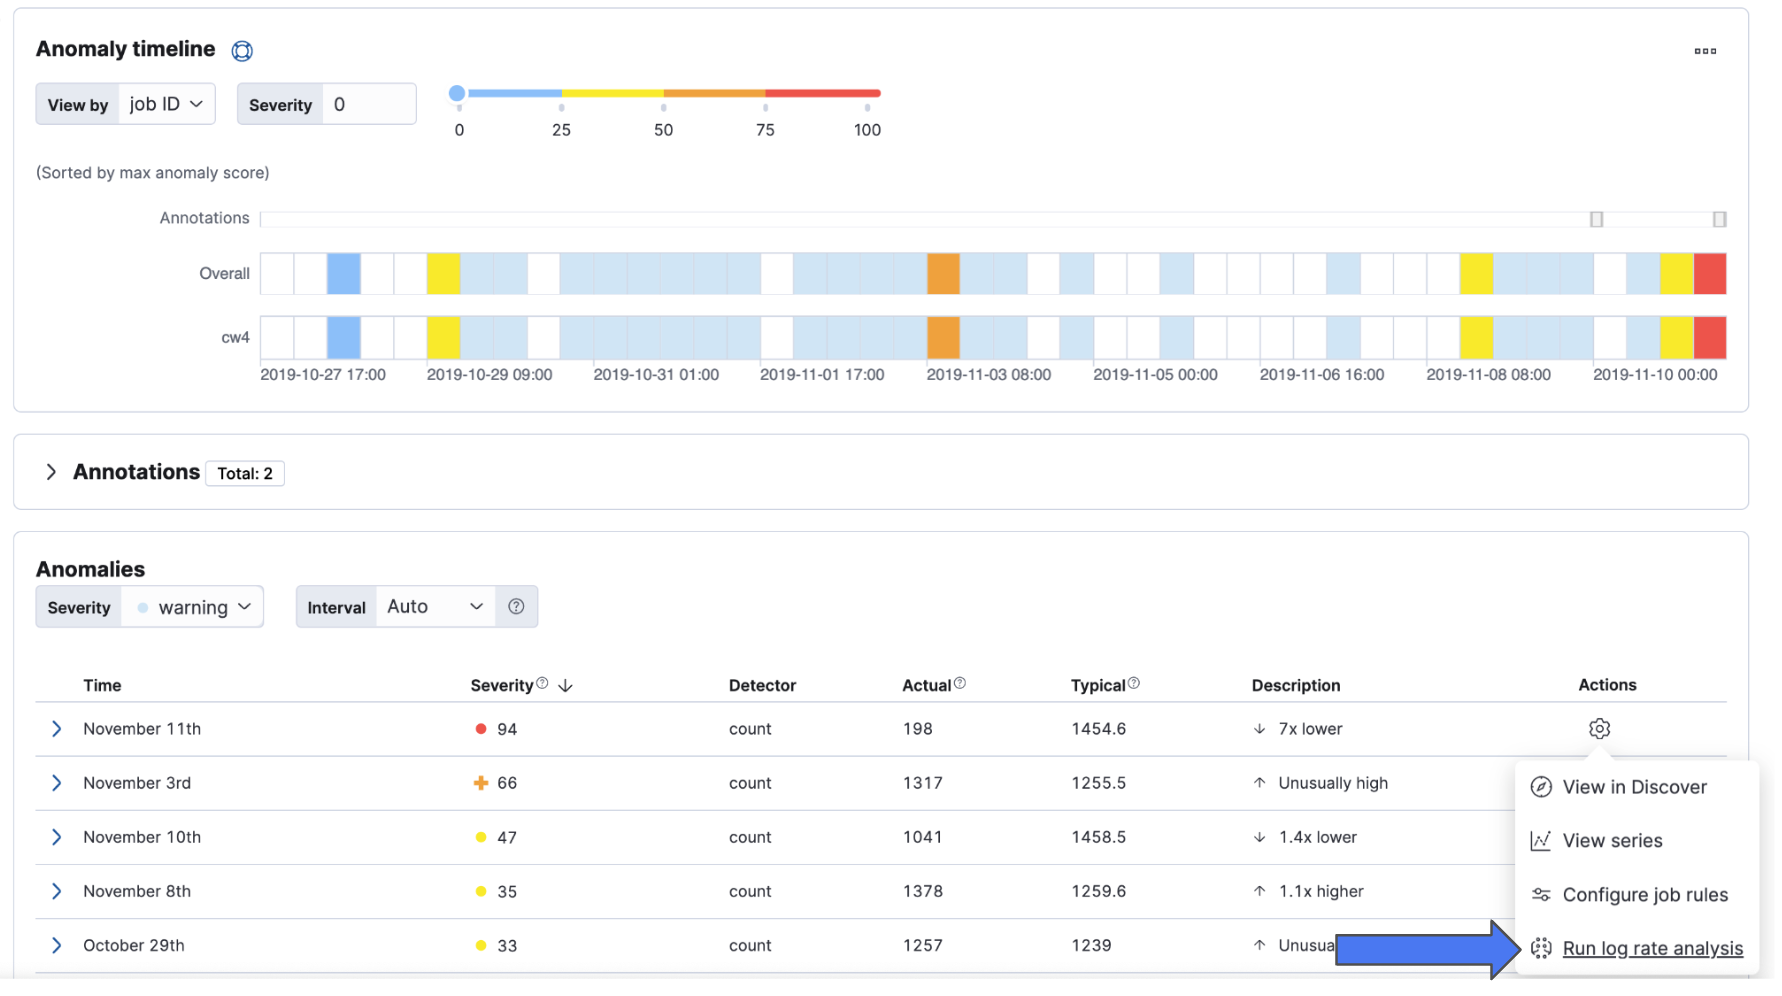
From 8.13, you can achieve the same from the anomaly markers in the Single Metric Viewer. Click on them and the actions menu will appear.
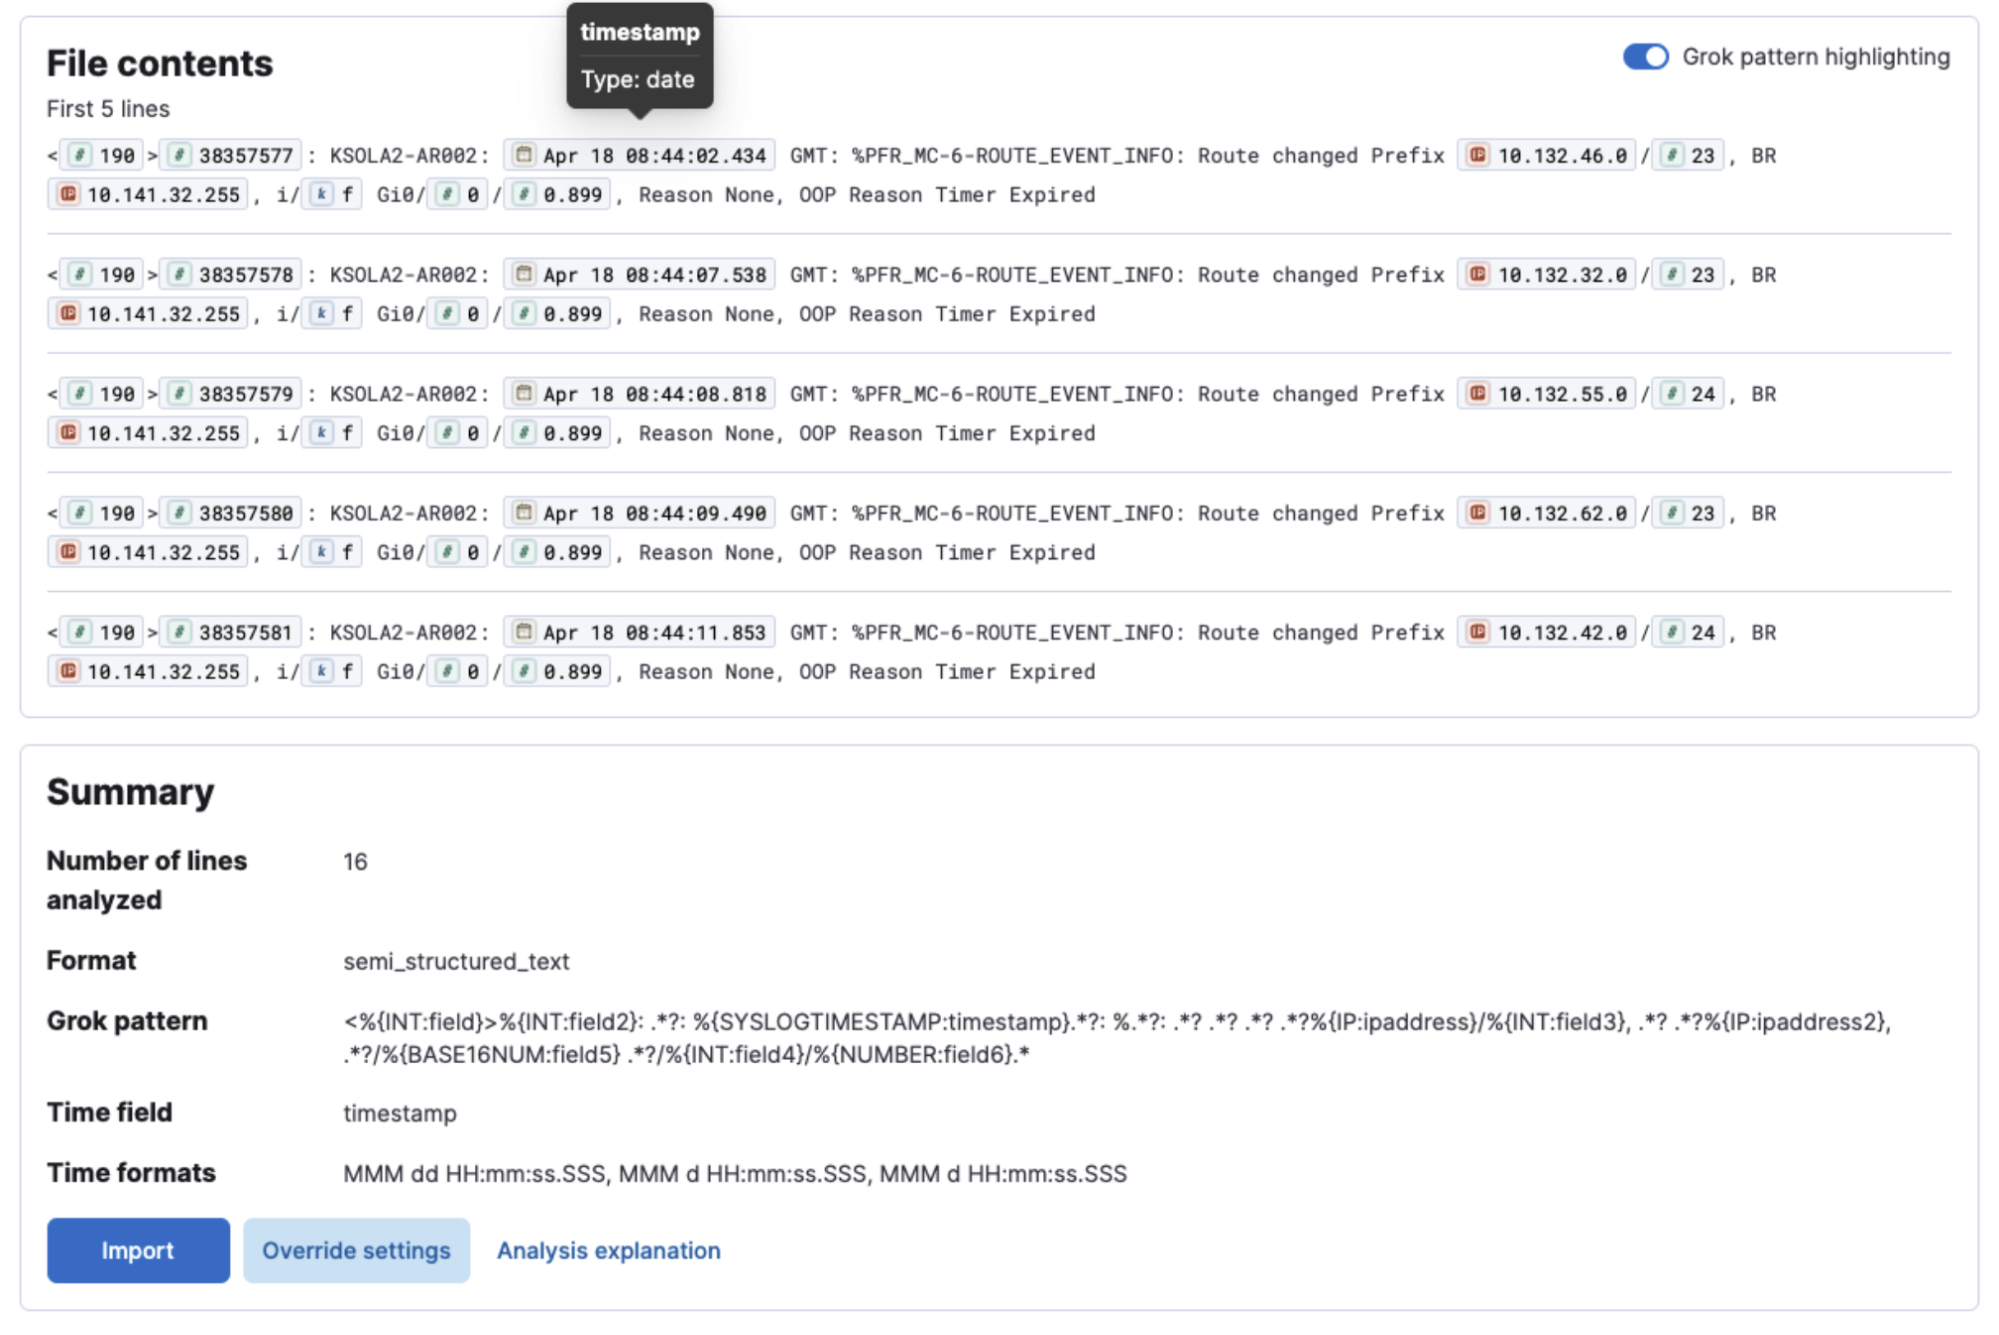
Grok highlighting in the File Data Visualizer
editUploading a file through the File Data Visualizer will display the first 5 lines with inline highlighting. Hovering the mouse over displays a tooltip with the field name and type.
Security
editUI improvements for managing API keys
editWe’ve made some improvements to the API keys management page. Going forward, you can now easily sort columns in the API keys table, making it easier for you to navigate through API keys, especially when volume is high.
We’ve also made the API key name a required field. This reduces previous bugs on this page that resulted in errors or inconsistent API key names being displayed.
Global Experience
editDiscover using ES|QL without data views
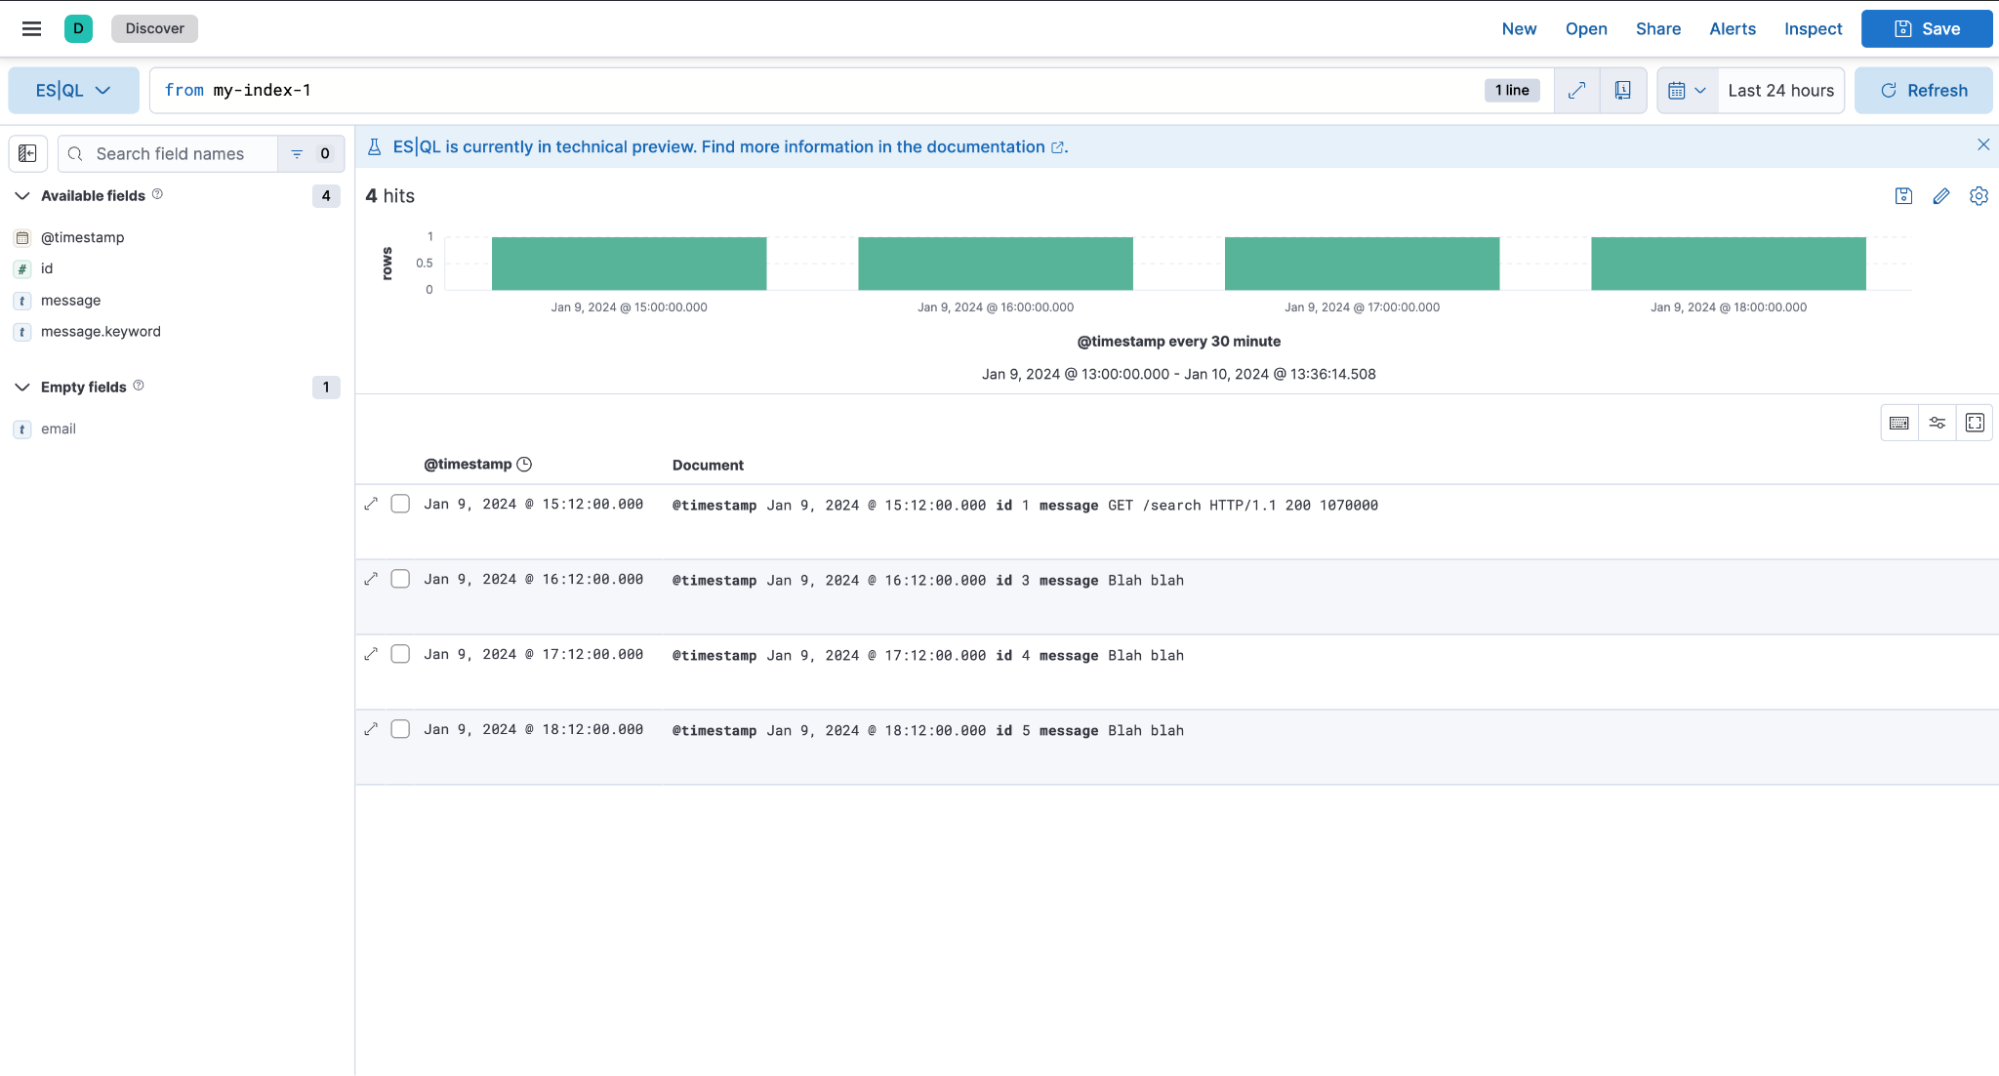
editYou can now utilize ES|QL without creating a data view. To expand, if you have ingested data but have not created a data view, when you navigate to Discover you will see a screen prompting you to create a data view, as before. Now an option is available on that screen to Try ES|QL.
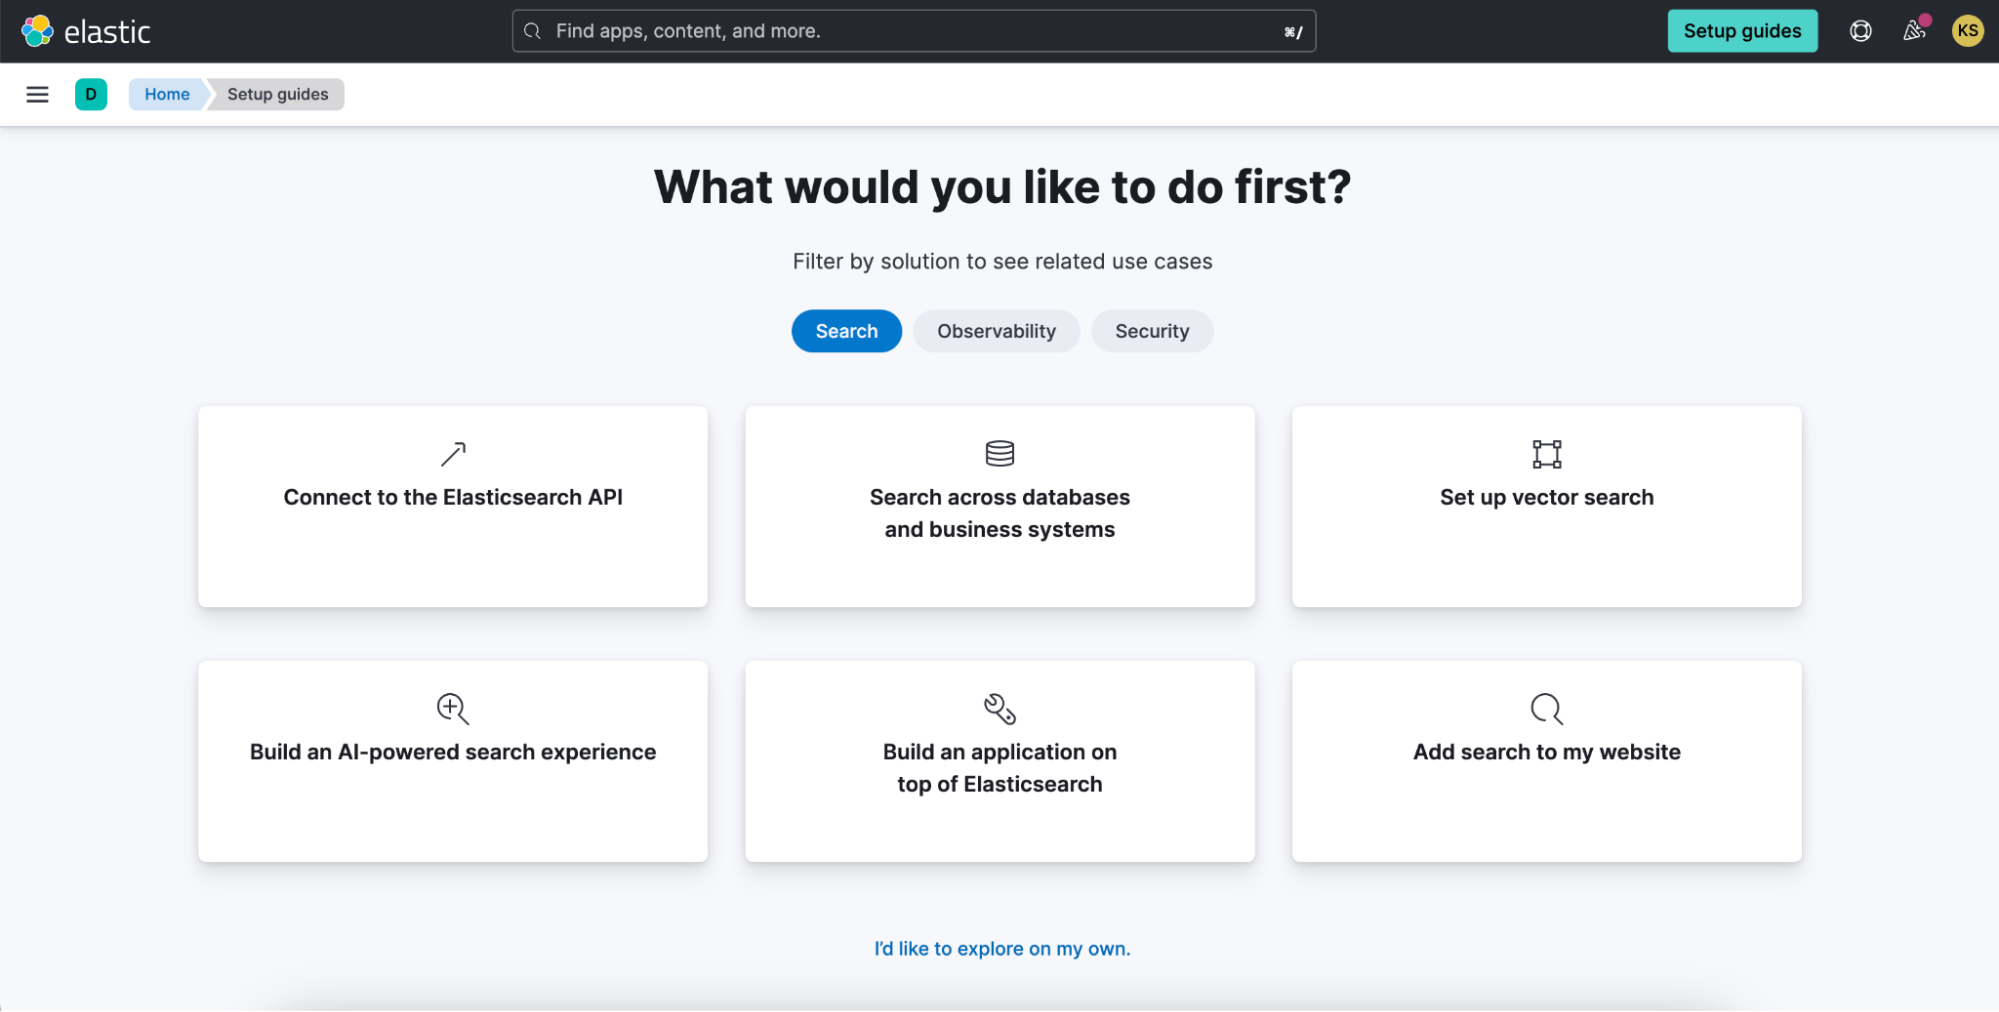
Improved UX for Setup Guides
editThe setup guides you see in Kibana are now organized by solution, making it much easier to find the guide you’re looking for. Additionally, a new card was added to Connect to the Elasticsearch API so users with API use cases don’t have to dig through the navigation and documentation to find the connection info.
Live chat available from the Elastic Cloud console
editYou will now find live chat functionality available in the top right corner in the Elastic Cloud console, completing seamlessly availability from all locations within both Elastic Cloud and Kibana experiences.
Faster deployment creation times
editIn particular regions, deployment of a new cluster is nearly instantaneous, saving you about 3-5 minutes of waiting time to get started. The number of regions that provide this performance boost has increased by 5x as we strive to make this the standard experience.