What’s new in 8.14
editWhat’s new in 8.14
editHere are the highlights of what’s new and improved in 8.14. For detailed information about this release, check the release notes.
Previous versions: 8.13 | 8.12 | 8.11 | 8.10 | 8.9 | 8.8 | 8.7 | 8.6 | 8.5 | 8.4 | 8.3 | 8.2 | 8.1 | 8.0
Discover
editTransitioning ES|QL from Tech Preview to General Availability!
editES|QL offers a streamlined way to filter, transform, and analyze data in Elasticsearch. Its intuitive design, utilizing "pipes" (|) for step-by-step data exploration, enables you to easily compose powerful queries for detailed analysis. Whether you’re a developer, SRE, or Security Analyst, ES|QL empowers you to uncover specific events, perform robust statistical analyses, and create compelling visualizations. As we move from tech preview to general availability, discover the enhanced capabilities of ES|QL and elevate your data operations.
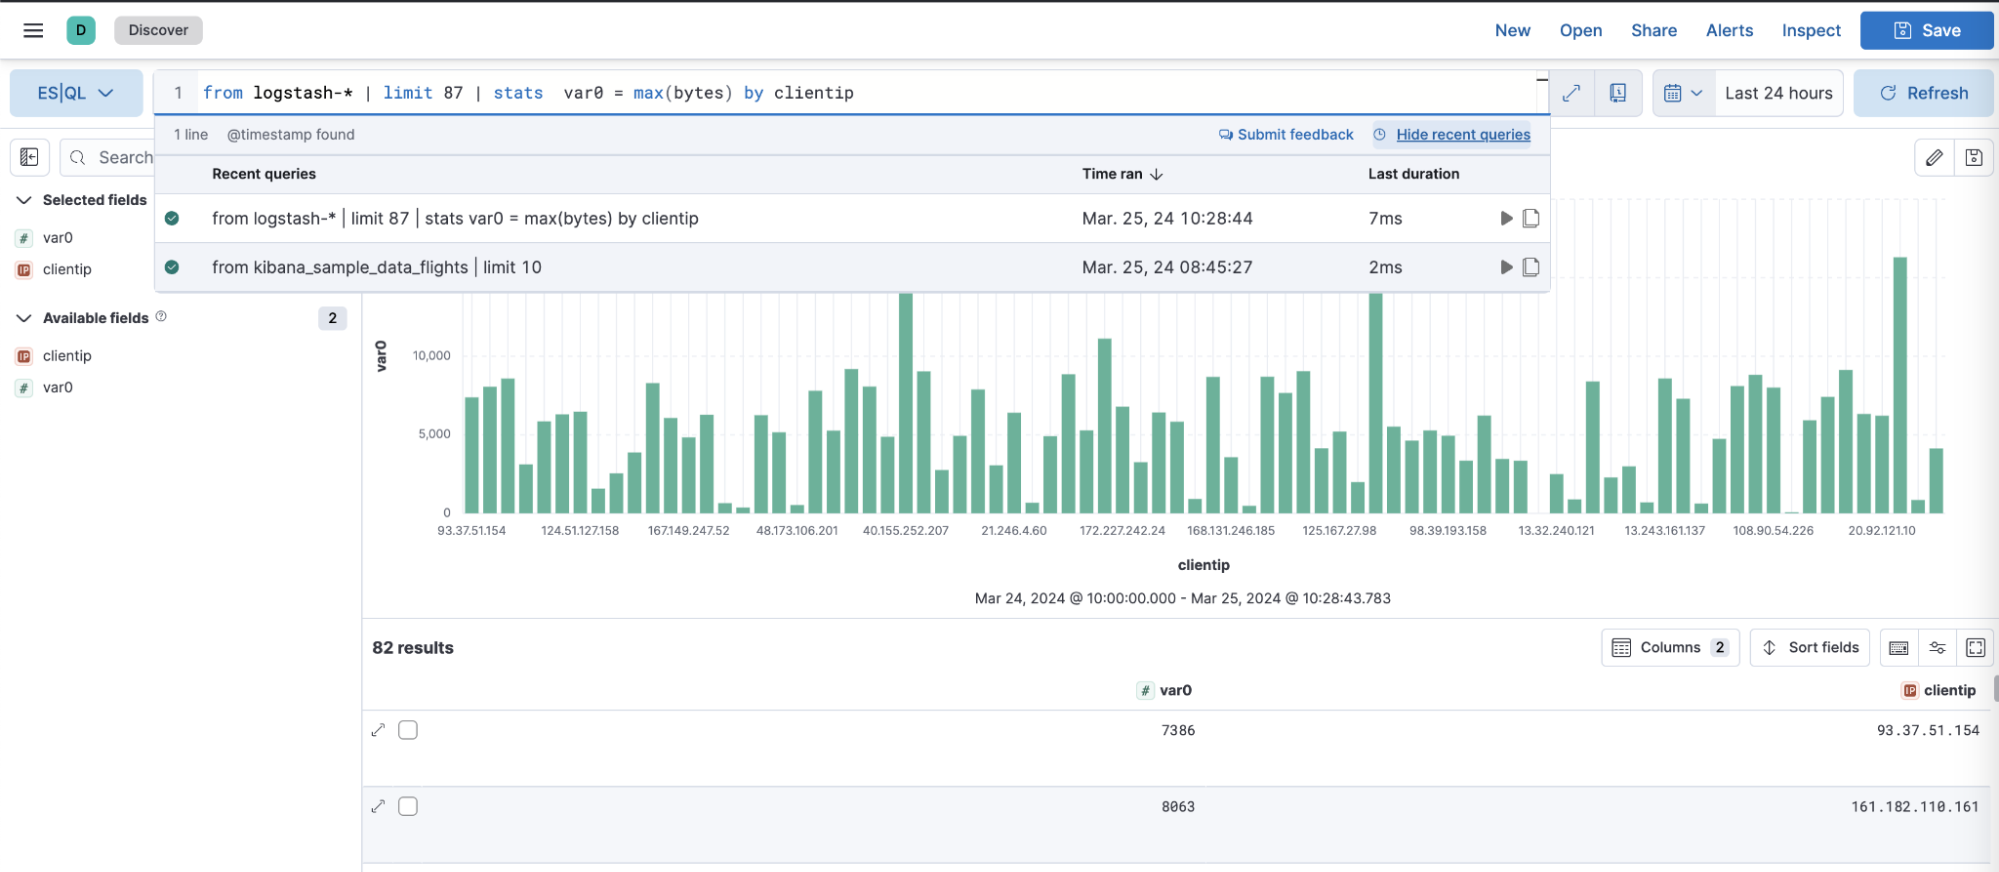
ES|QL Query History
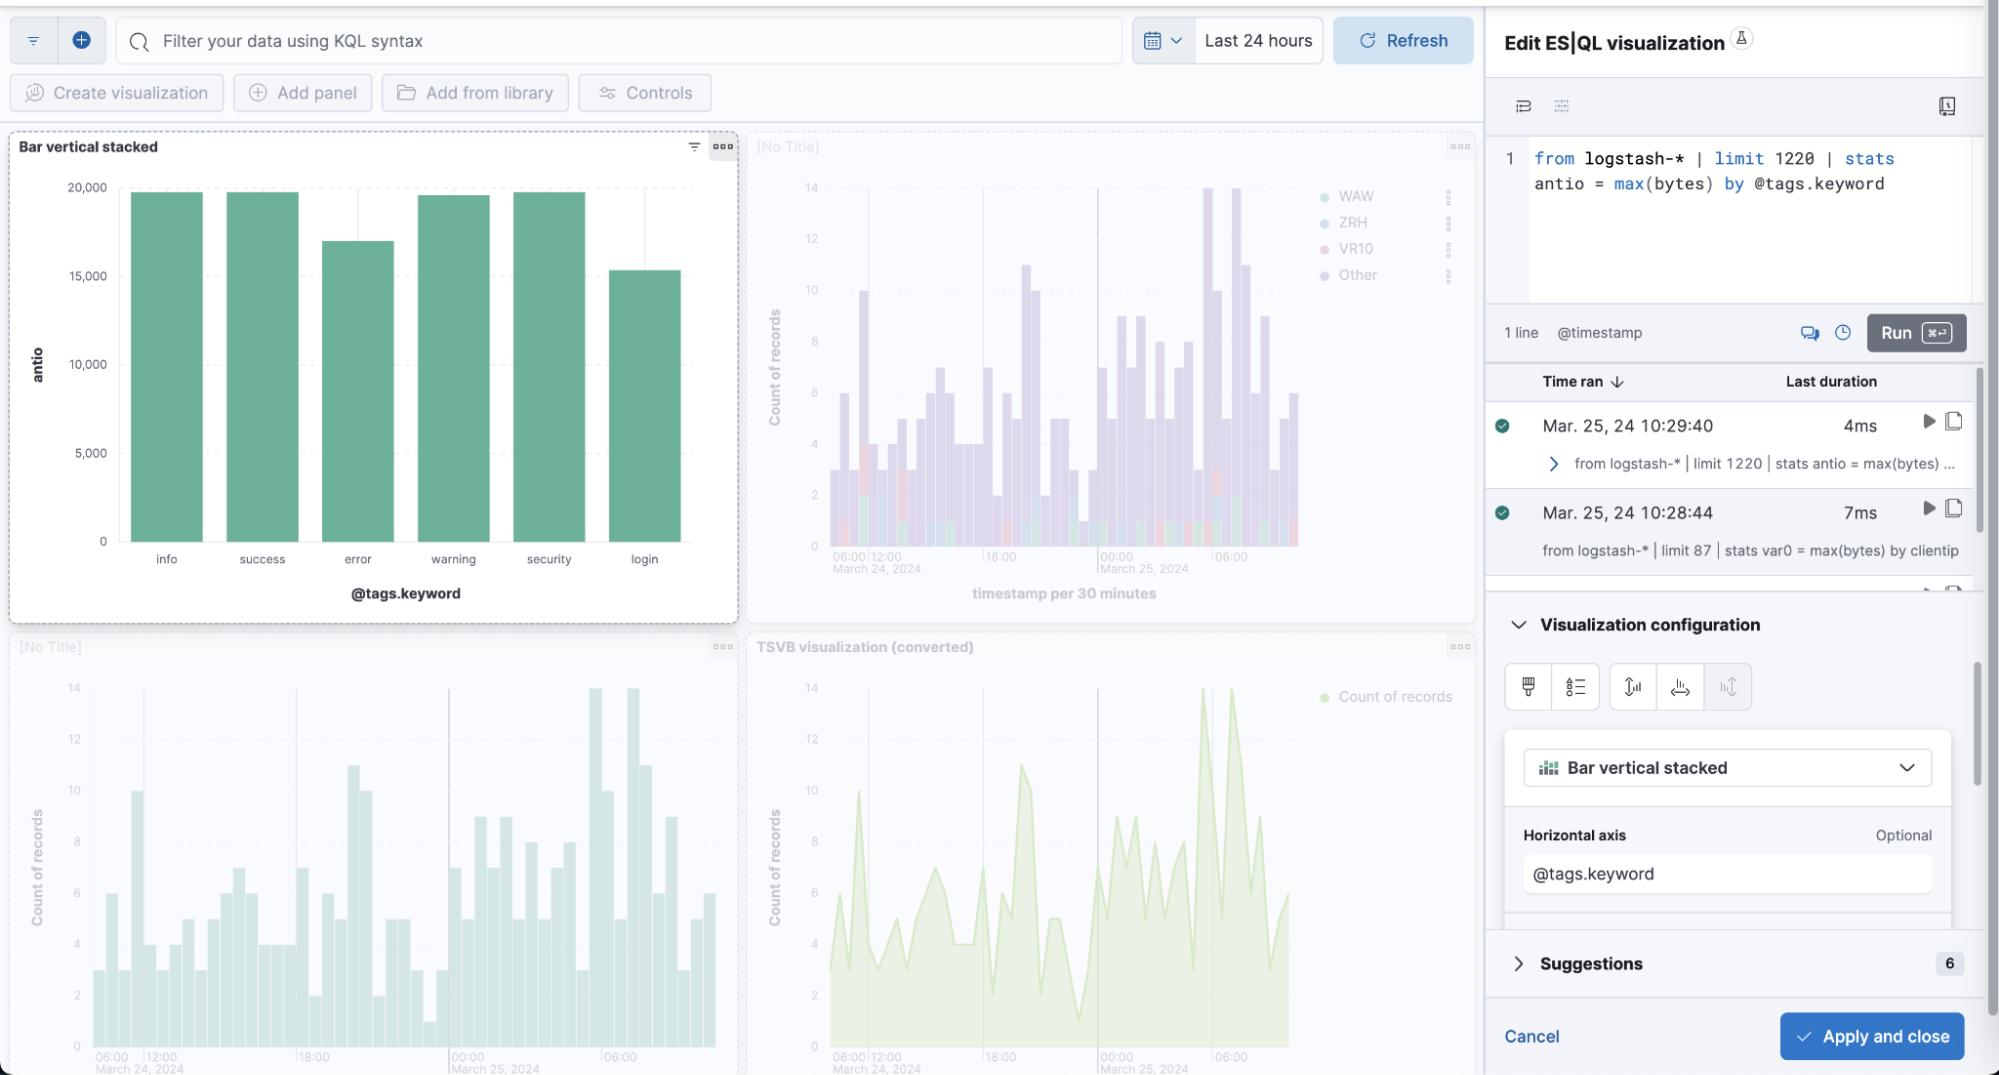
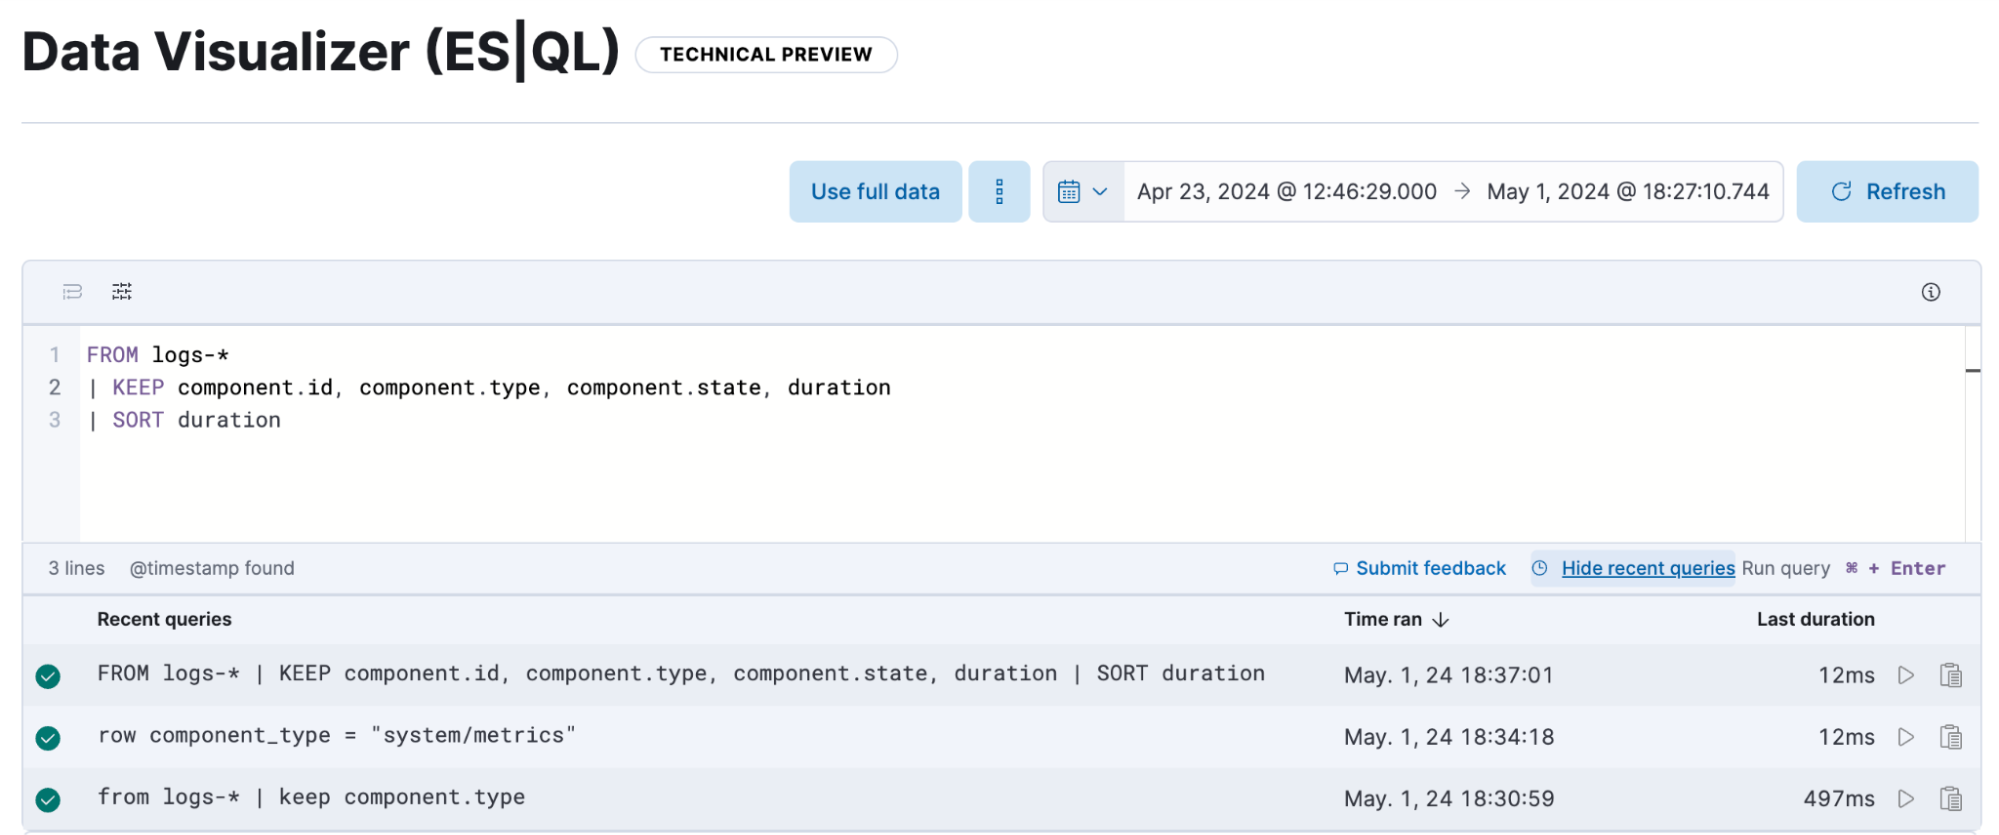
editWe’ve enhanced the ES|QL editor to improve your workflow. You can now view and re-run your last 20 ES|QL queries directly within Discover, ES|QL charts, alerts, and maps. This feature makes it easier to manage your queries and streamline your tasks.
Document comparison mode in Discover & ES|QL
editYou can now select and compare documents or fields. This functionality streamlines analysis and troubleshooting tasks by allowing you to perform detailed comparisons, such as diffing SIP messages of a certain ID across multiple documents in Elasticsearch.
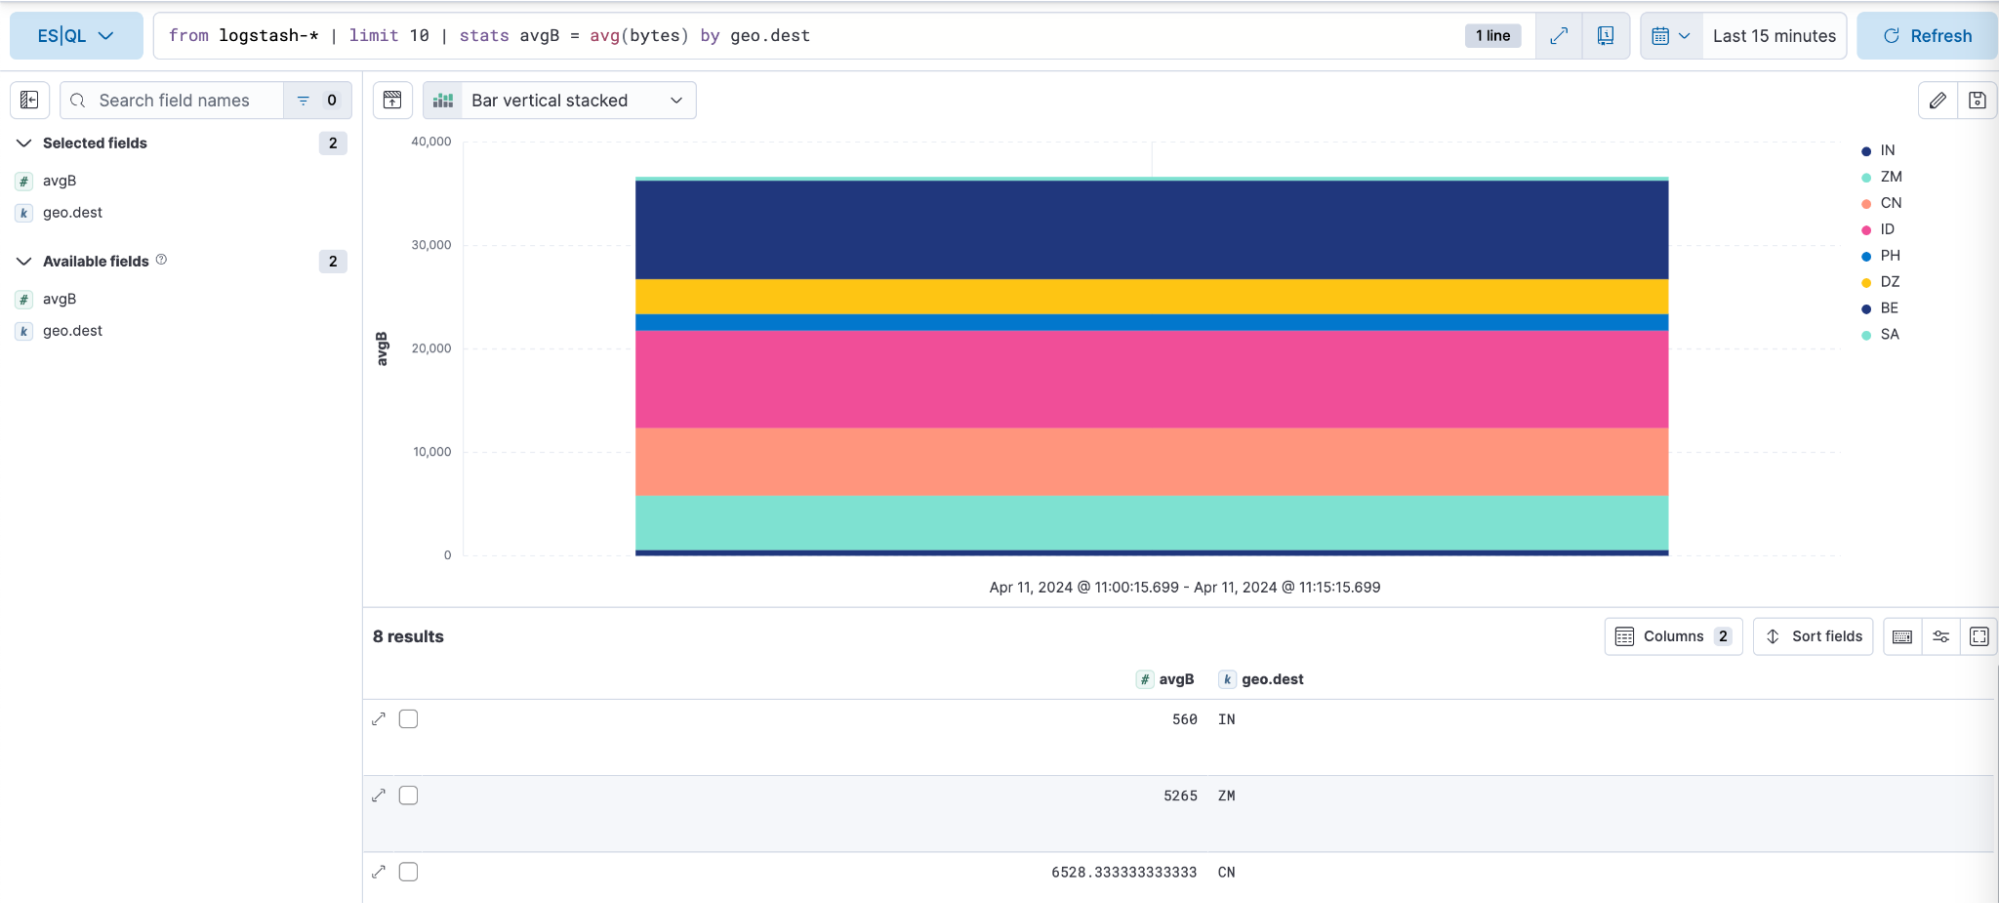
Storing ES|QL visualizations in saved searches
editChanges to ES|QL charts in Discover can now be saved along with ES|QL query syntax, allowing you to share and manage your Discover views with ease.
ES|QL field statistics in Unified Field List
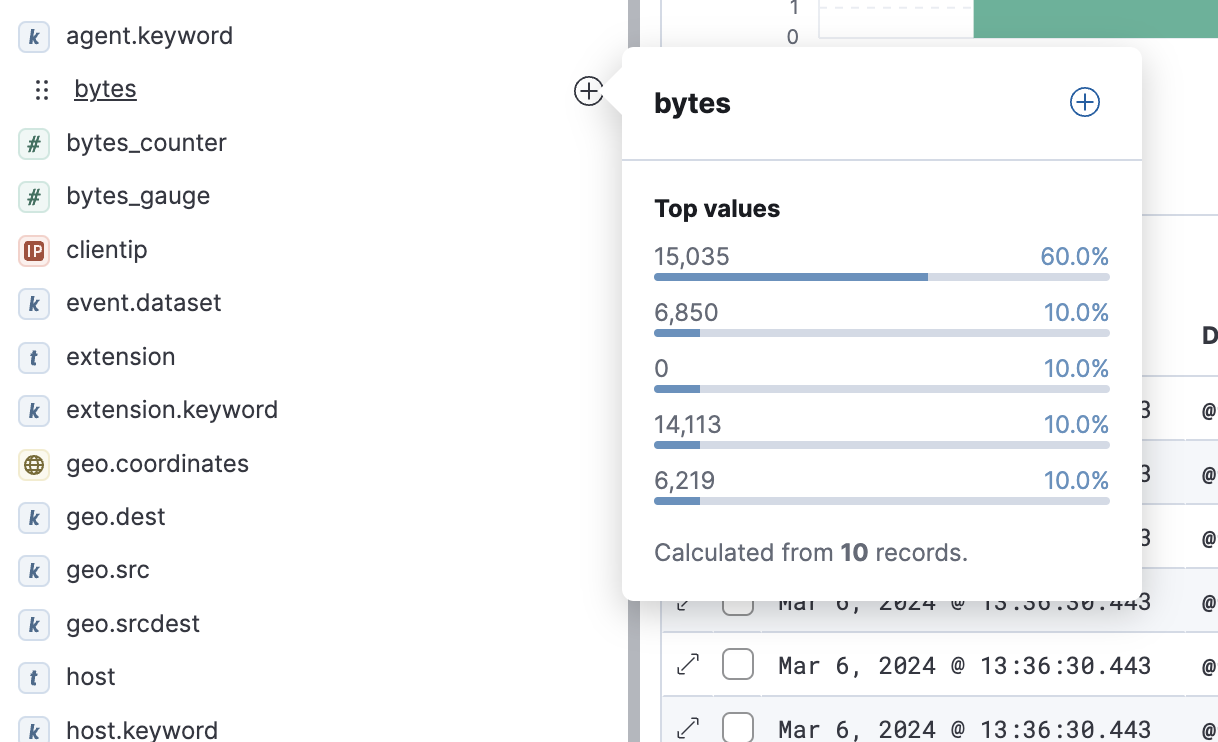
editSeeing data statistics while crafting queries can be useful to understand the data batter. To enhance this experience, we’ve added field stats to the sidebar field popover in ES|QL mode, similar to what’s available in Discover data view mode.
Custom data view field descriptions
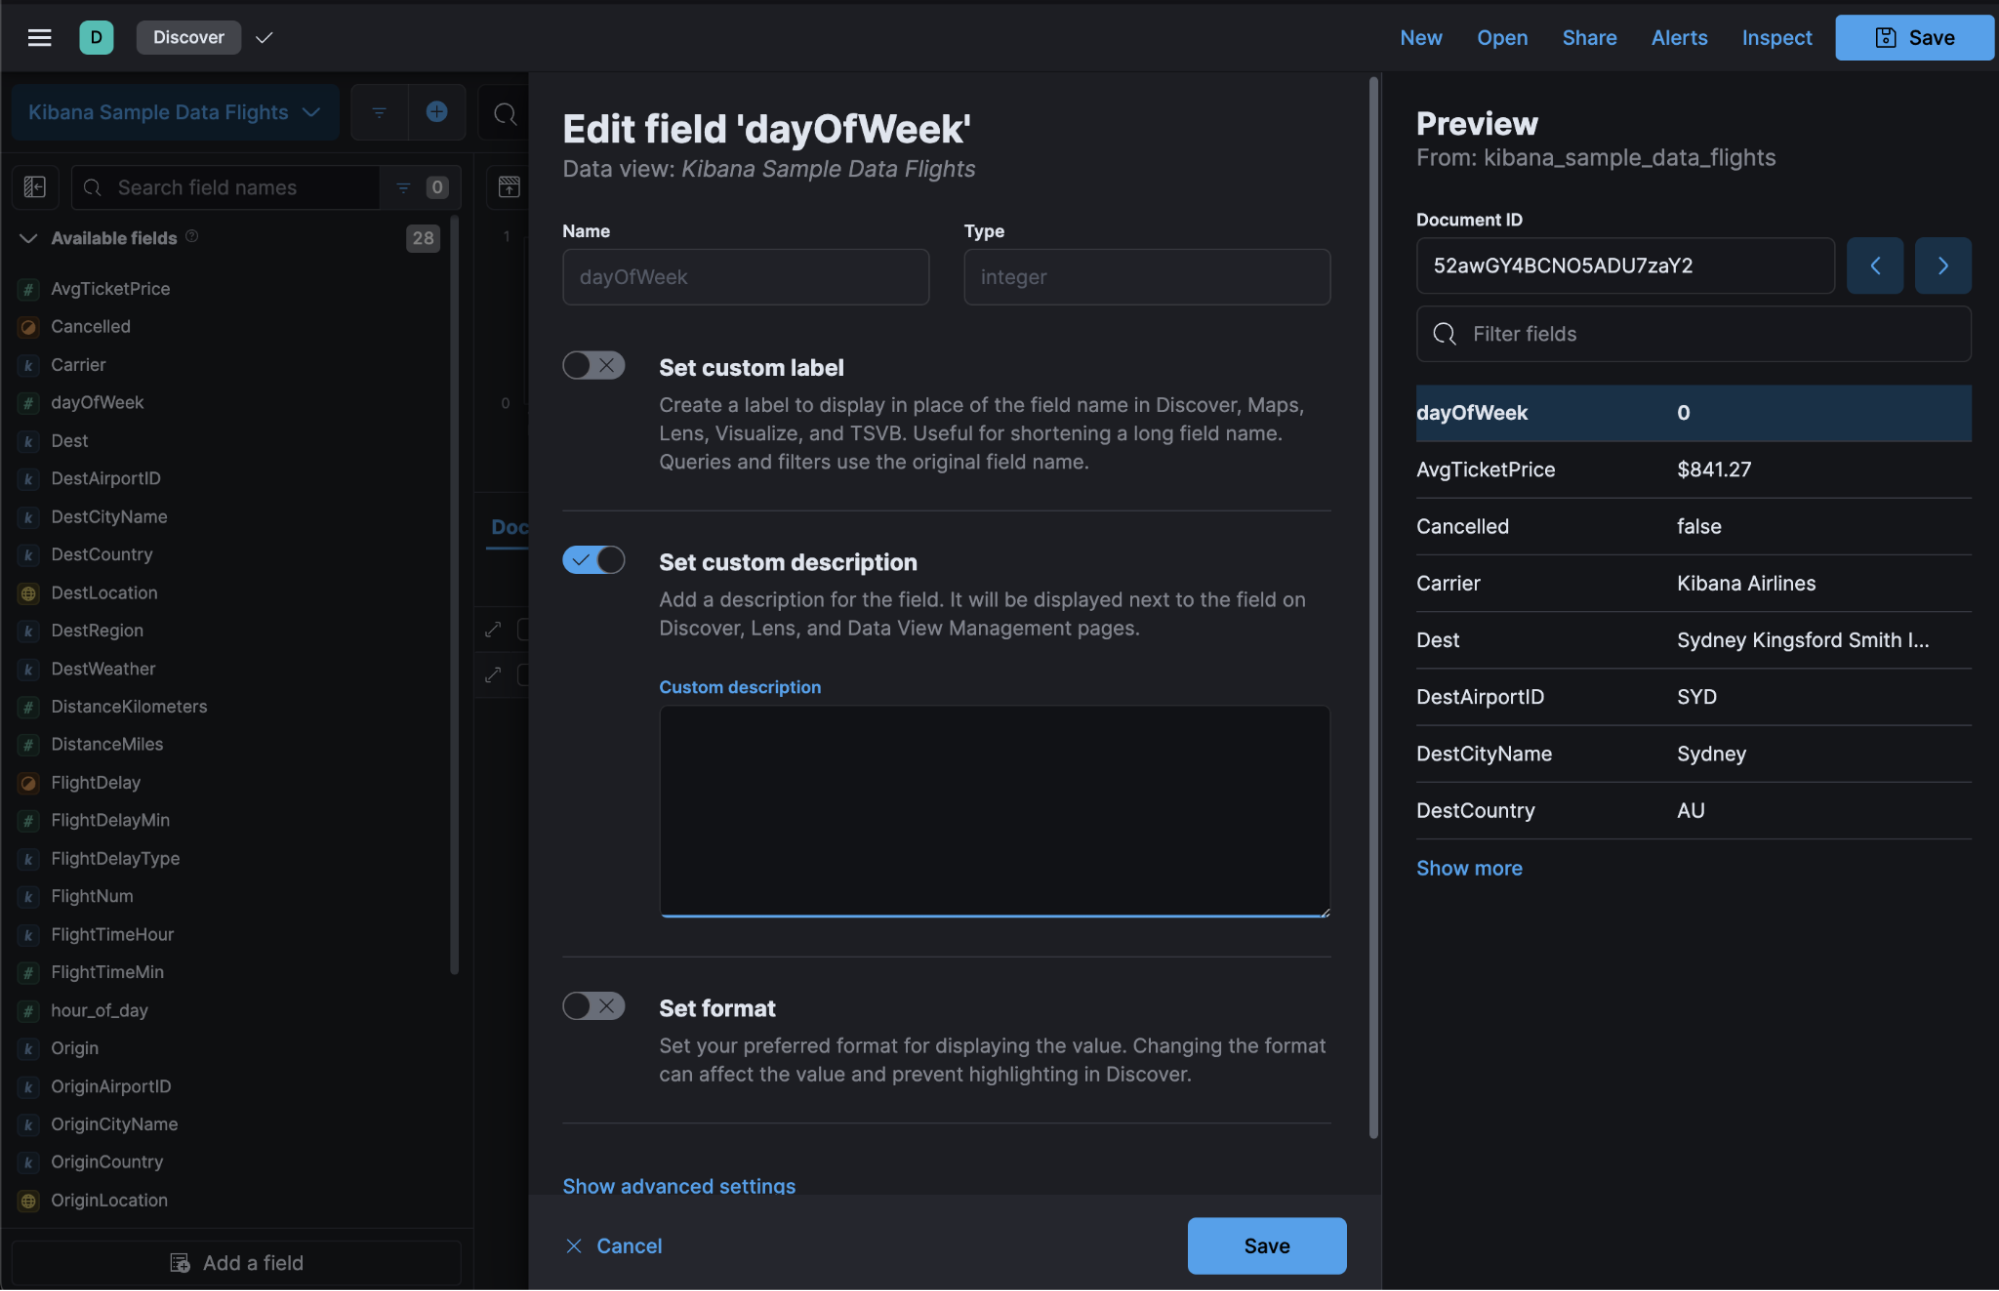
editWe’ve implemented a much-requested feature that allows you to add custom descriptions to data view fields. This enhancement is going to make a significant difference in how you manage and understand your data in Kibana. You’ll see these descriptions in the Unified Field List popover in Discover and Lens, enhancing your user experience.
Dashboard
editLinks panel Generally Available
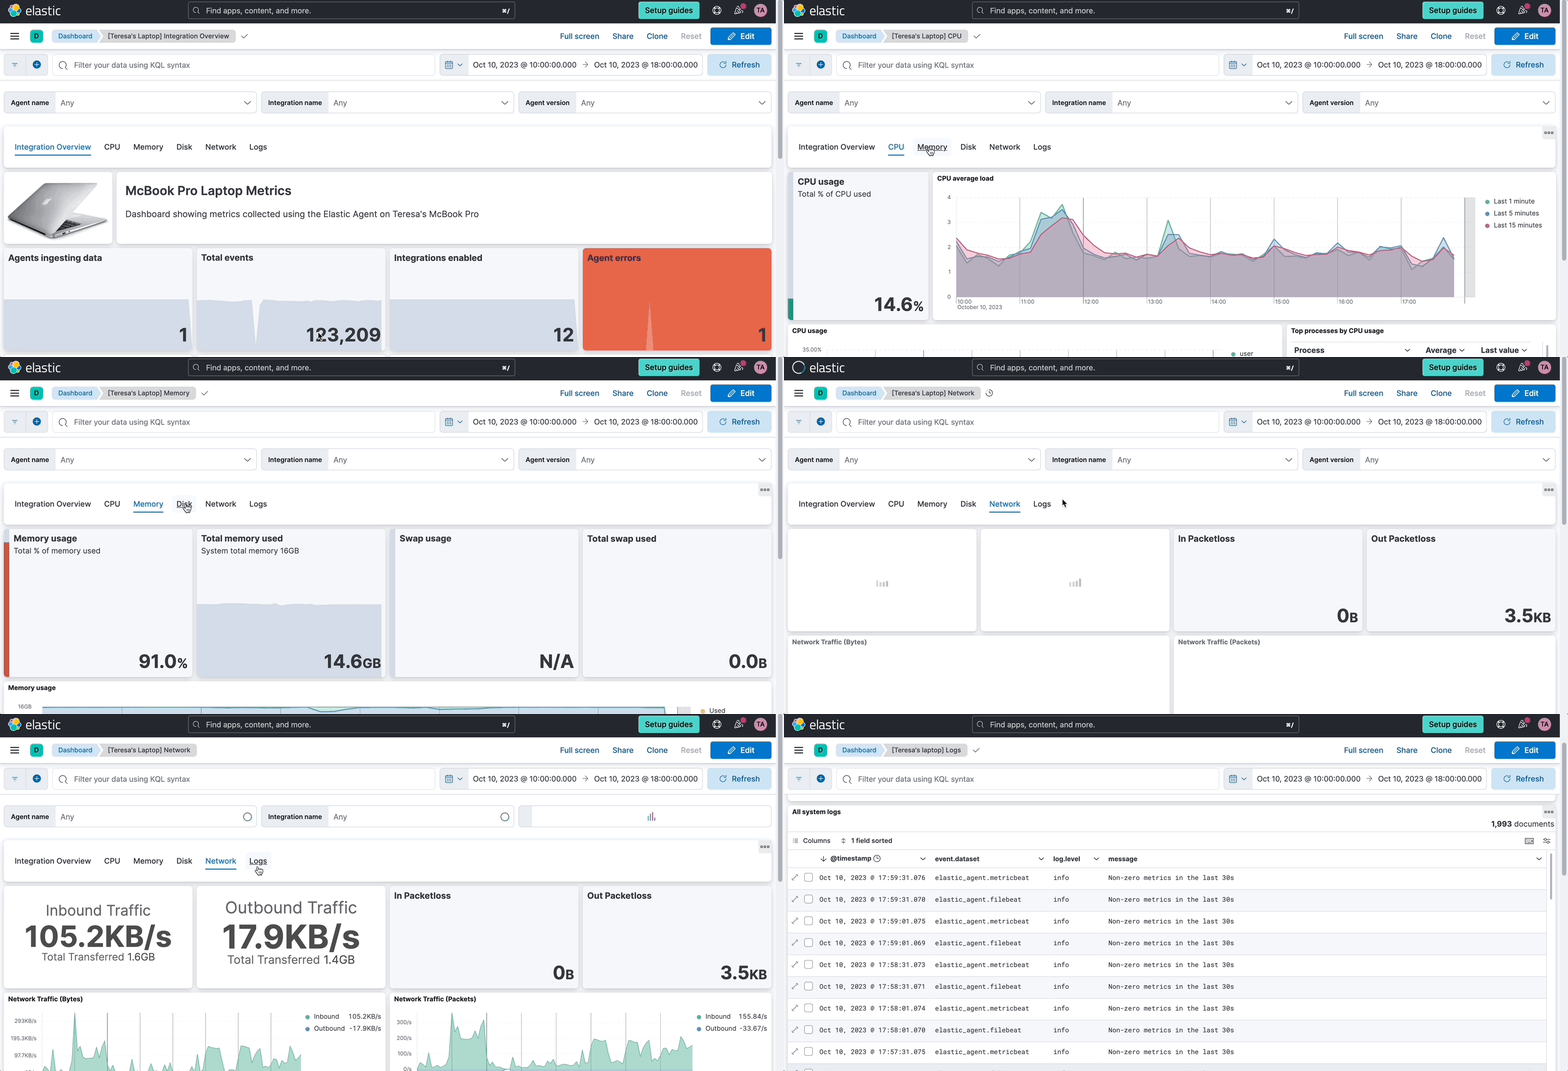
editYou can now easily navigate from one dashboard to another using the links panel. Better organize your dashboards and make them more performant by chunking them in multiple dashboards with fewer visualizations and linking them together. You can carry over your filters, query and time range when navigating to other related dashboards. Display your links horizontally or vertically as it better suits your dashboard layout. You can also use the links panel to include external links in your dashboards. For example, to your wiki page or other applications. Decide whether you want to open the links in the same browser tab or in a new one.
Controls apply button
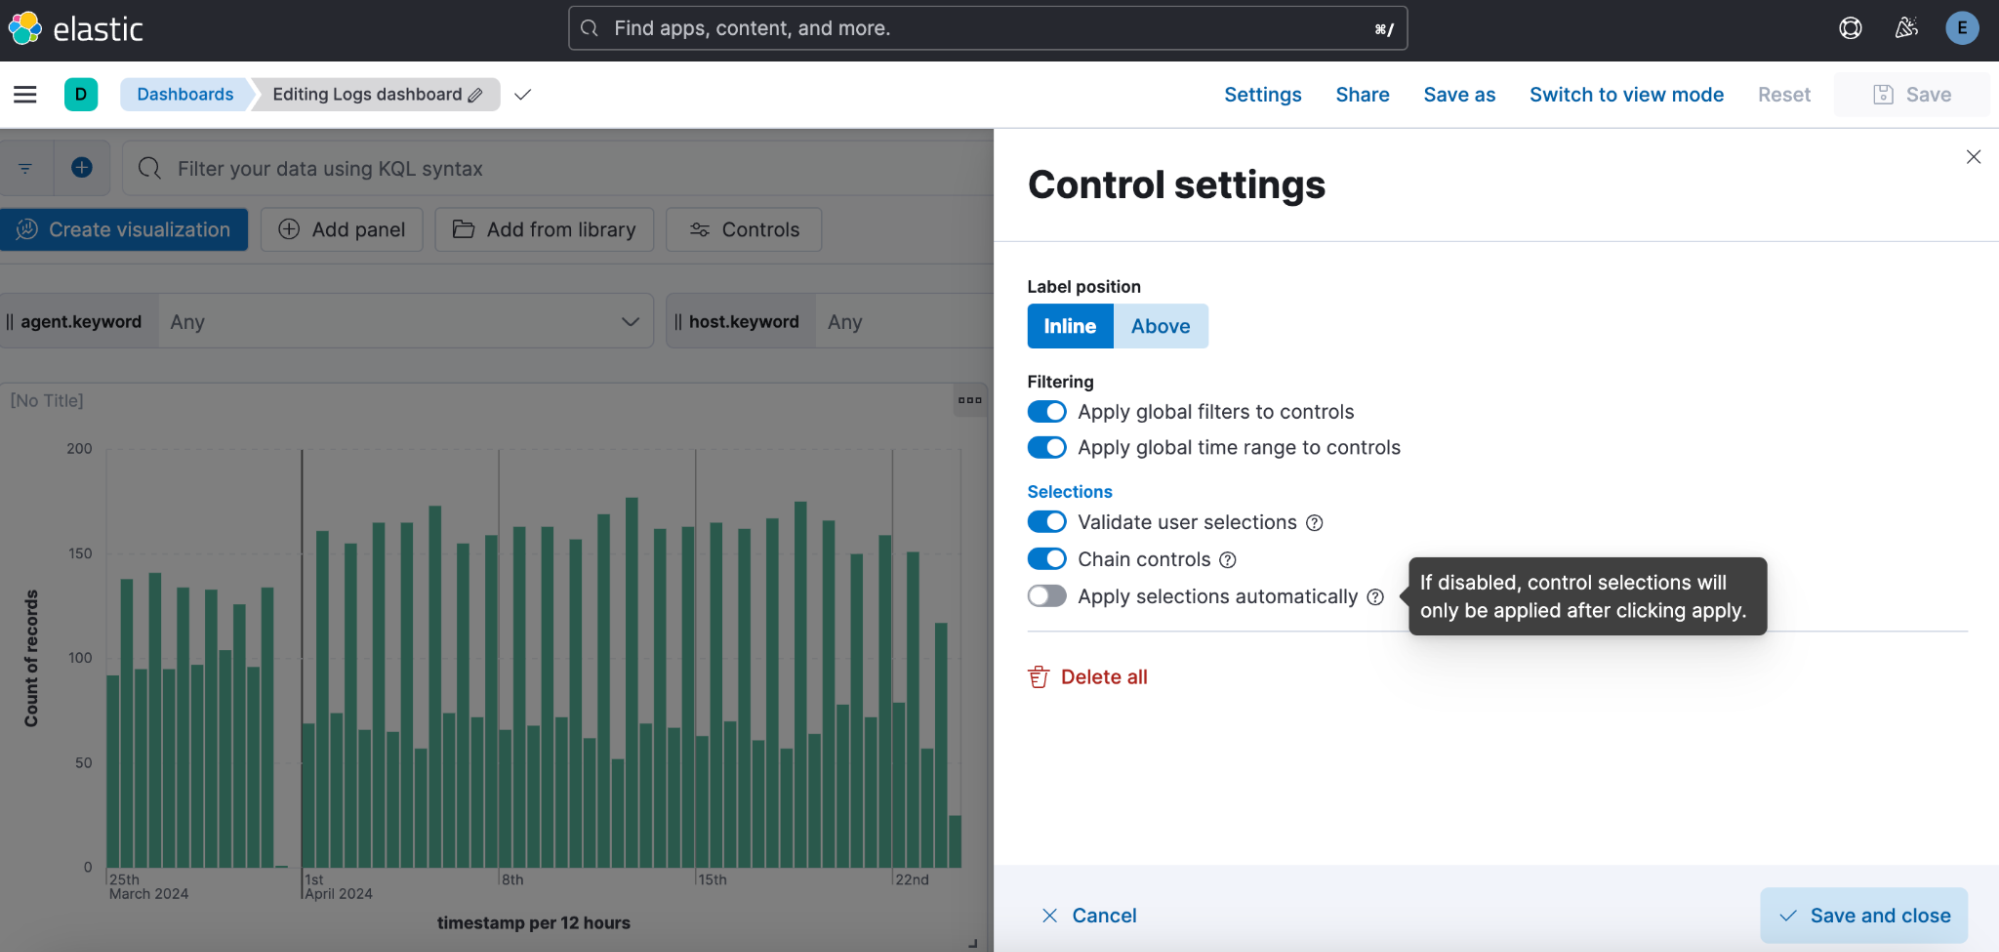
editControls are a popular way for users to filter their dashboards. Most of the time, users need to filter several of these controls to get the results they are looking for. In order to optimize performance and minimize the number of queries sent to get the data, we added the option to add a button so the controls selection will not be applied until the user clicks on it. That allows users to filter by multiple fields before sending any new requests to fetch the dashboard data.
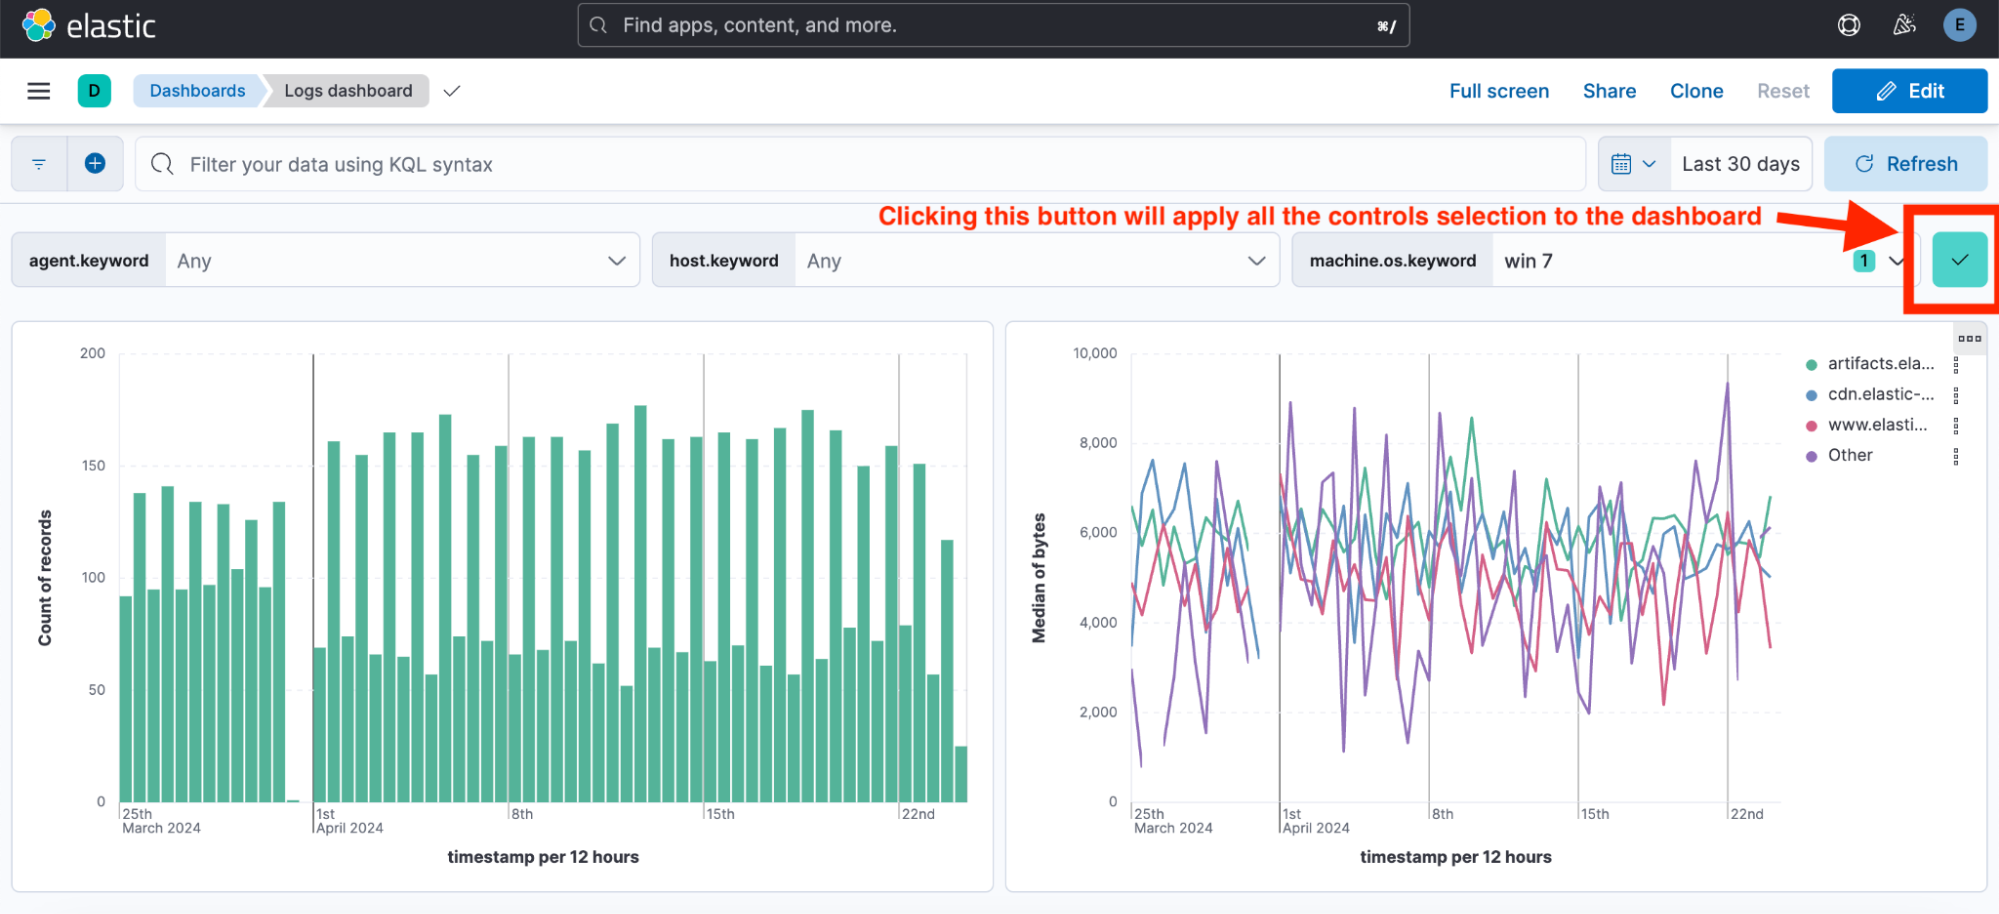
This option is off by default and dashboard authors can decide to enable this button by switching off “Apply selections automatically” from the Controls settings.
Gauge chart
editUsers can now easily build beautiful and fully functional gauge charts from Lens. The revamped gauges will adapt to the field selected suggesting automatic minimum, maximum and goal values. The gauge charts in Lens will allow users to migrate from TSVB more easily. Users can select five different types of gauge charts: semicircular, circular, arc, vertical or horizontal.

Region map goes GA
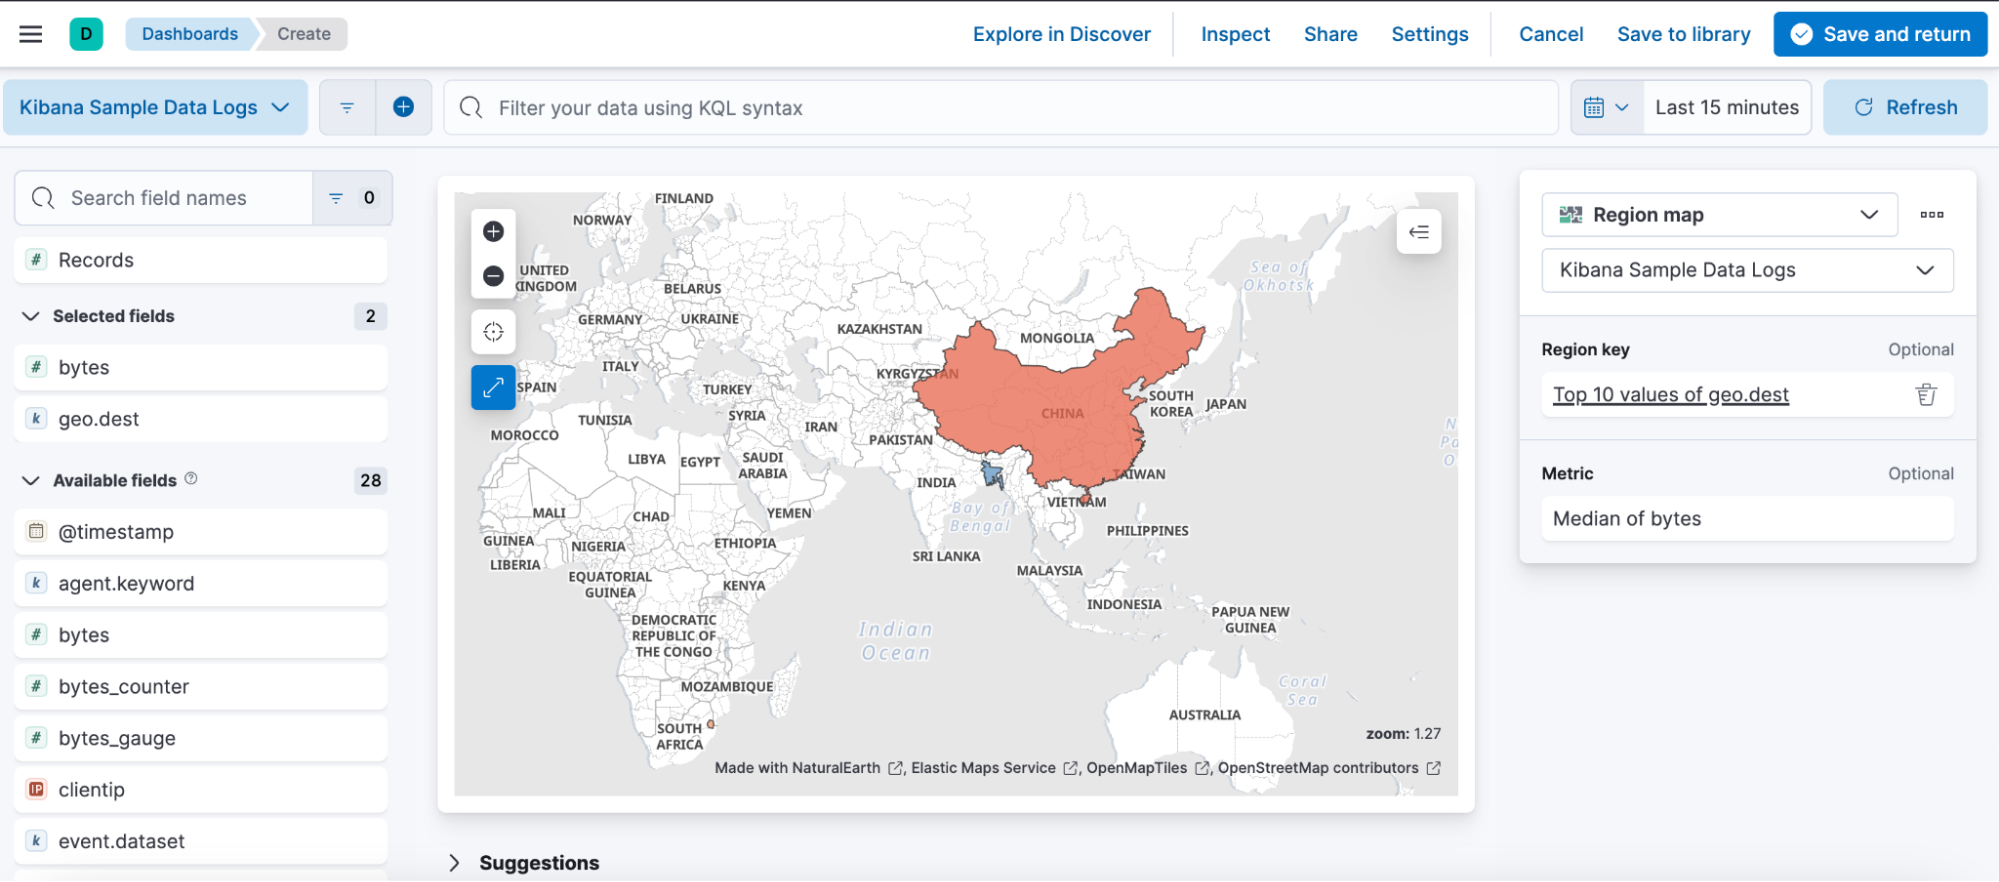
editUsers don’t need to navigate the complexity of the Maps app (meant to be used by more advanced geo users) to build a simple map. They can easily do it now from the Lens editor.
Machine Learning
editCohere reranking
editIn 8.14, we have further enhanced Elastic’s inference API by adding support for Cohere’s foundation Rerank 3 model rerank-english-v.3.0. This is a natural next step following support for Cohere’s embeddings in 8.13. Elastic is the only vector database that supports Cohere Rerank 3.
Reranking adds semantic precision on your search results, bumping the most relevant ones to the top of the list. Reranking is two-stage (or multi-stage) by nature and this is very powerful as it gives you flexibility, depending on your use case: You can easily combine it as an additional step without making changes to your current approach. Whether this is vector search, BM25 or hybrid search, reranking will deliver semantic relevance gains at the top of your search results list.
This is particularly important for Retrieval Augmented Generation (RAG), given the LLM’s costs and context windows limits.
Inference API: RBAC
editUse the new inference_user and inference_admin built-in roles to easily manage authorization for the inference API and trained_models API. The roles include the manage_inference and monitor_inference privileges which give full access and read access respectively to the inference endpoints.
AIOps: Log Pattern Analysis is Generally Available
editIn 8.14 Log Pattern Analysis becomes GA. Log Pattern Analysis enables faster and smarter investigation across thousands of log messages in order to analyze, troubleshoot and identify the root cause of an incident. Combine it with Anomaly Detection and our other AIOps features to drastically reduce the MTTR.
Query history in ES|QL data visualizer
editWe have enhanced the ES|QL editor to improve usability and support your workflows. You can now view and re-run your last 20 ES|QL queries directly within the ES|QL Data Visualizer.
Alerting
editKibana case actions
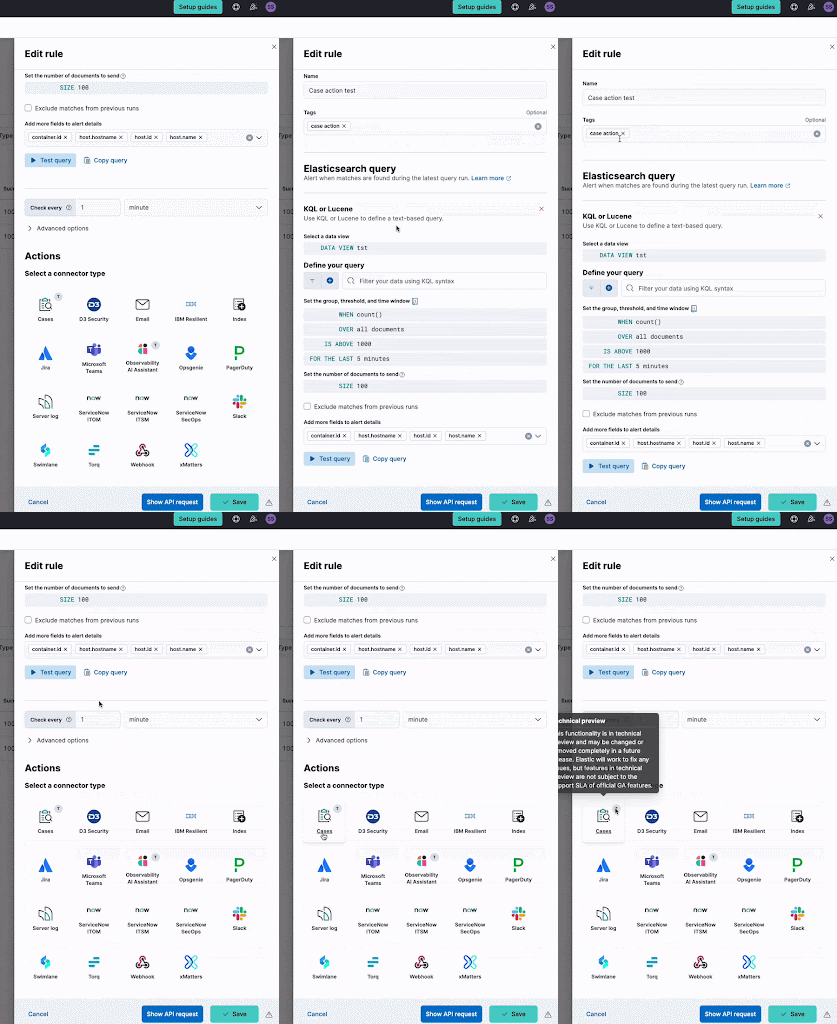
editAlerting rules now support a new action that enables you to create cases automatically when alerts are detected. The case action can aggregate alerts and group them by any alert field and time window. For example, you can specify that all alerts that are detected by a certain alerting rule in a given time window (for example 7 days) with the same user will be assigned automatically to the same case. For more information, check out Cases.
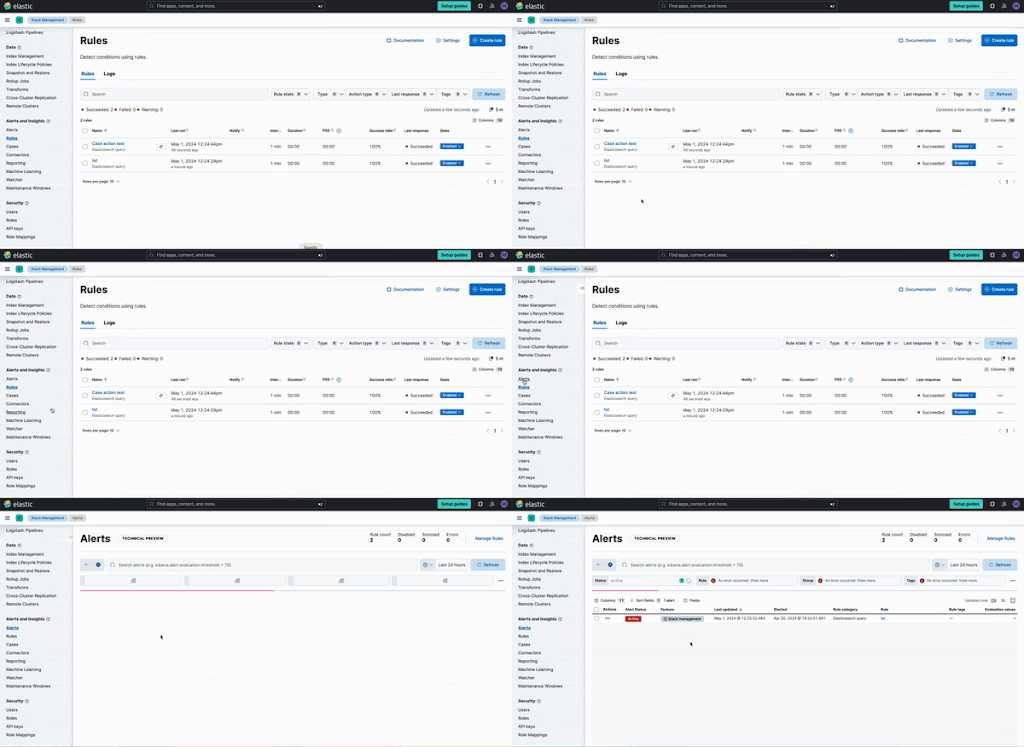
Stack Management Alerts page
editA new alerts page is now available to manage alerts as part of the Stack Management menu. The new page enables you to filter alerts by rule type and solution and get a unified view of the alerts that you have authority to view within the space.
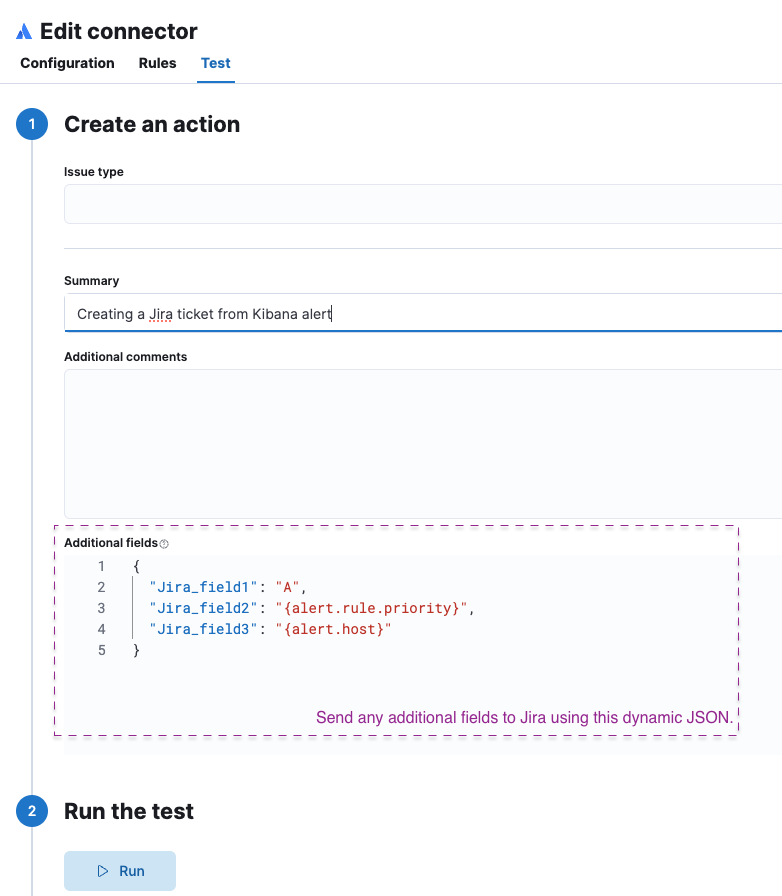
Jira additional fields support
editWith this Jira connector enhancement, alerts can create enriched Jira issues with a more comprehensive structure that matches the Jira ticket scheme. A new JSON field is now supported as part of the Jira action so you can define any field to be sent from Kibana alerts to Jira tickets. For more information, check out Jira.
