Author
Articles by David Hope
Director of Product Marketing, Elastic
David Hope is a dedicated IT professional with over 16 years of diverse experience spanning from development, DevOps, leadership, sales, and product marketing. David currently lives in the USA with his family and moved here eight years ago from the UK after meeting his wife in Buffalo, NY.

The hidden costs of tool sprawl: An SRE's guide to observability consolidation
Find out why organizations are focusing on reducing the number of observability tools. From faster incident response times to reduced toil and more innovation, 80% of the organizations we surveyed understand the value of minimizing tool sprawl.
.jpg)
Realizing the business value of OpenTelemetry-native observability
Discover how OpenTelemetry is revolutionizing enterprise observability by breaking down tool silos, reducing costs, and improving operational efficiency. Learn how standardized telemetry data collection can drive better business outcomes.

The power of effective log management in software development and operations
This blog explains the importance of log management, best practices, and tools for managing logs efficiently. From identifying errors to troubleshooting issues, learn how to leverage log management for enhanced performance and streamlined operations.

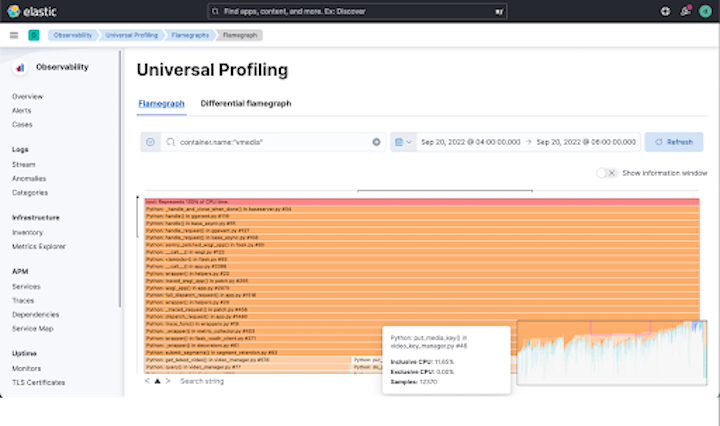
Elastic Universal Profiling™ helps you deliver fast, affordable, and efficient services
Elastic Universal Profiling™ allows you to see what your code is doing at all times, in all languages, in both user-space and kernel-space code. It lets you profile everywhere, all the time and filter powerfully with total observability.
Sign up for Elastic Cloud free trial
Spin up a fully loaded deployment on the cloud provider you choose. As the company behind Elasticsearch, we bring our features and support to your Elastic clusters in the cloud.

.jpg)

