What are traces?
Distributed traces definition
Distributed traces are a type of telemetry data that provide an end-to-end, code-level record (transaction) of every user request through an application's entire path.
Distributed tracing offers visibility into the health of an application, dependencies, and interactions between system components. It's an essential component of observability and application performance monitoring (APM) in cloud-native environments.
Traces help site reliability engineers (SREs), ITOps, and DevOps teams understand the end-to-end movement and behavior of requests through various microservices within a system. Using traces, developers can find bottlenecks and other code issues that affect performance and user experience and optimize them for efficiency.
Distributed tracing vs. traditional tracing
Distributed tracing is a method of observing requests as they travel through distributed environments.
By design, distributed architecture involves a complex web of services. A request journeys across many microservices, each performing a specific task. As a result, tracing a request in a distributed system is a complex undertaking that would be impossible with traditional tracing used for monolithic applications.
Traditional tracing provides limited insights and isn’t scalable. The traditional tracing method uses random samples of traces from each request, resulting in incomplete traces.
Why is tracing important for application development?
Tracing is important for application development because it lets software engineers follow a request through numerous microservices. The ability to visually track every step makes tracing invaluable. It helps fix bugs and performance issues by troubleshooting errors for different applications.
Tracing helps to:
- Identify issues faster: In a distributed system, troubleshooting is significantly more difficult than in a monolith. Distributed tracing helps pinpoint the root cause and location of application errors faster, minimizing disruptions.
- Simplify debugging: Tracing provides a comprehensive view of how requests interact with different microservices, aiding the debugging process, even in the most complex architecture.
- Improve collaboration: In a distributed environment, different teams often work on different services. A trace identifies where the issue occurred and points to the team responsible for fixing it.
- Speed up development: With tracing, developers can gain valuable insights into user behavior, optimize application performance, and streamline efforts to release updates and new deployments.
How tracing works
Tracing works by collecting, analyzing, and visualizing telemetry data of a request as it travels across different services in a microservices architecture.
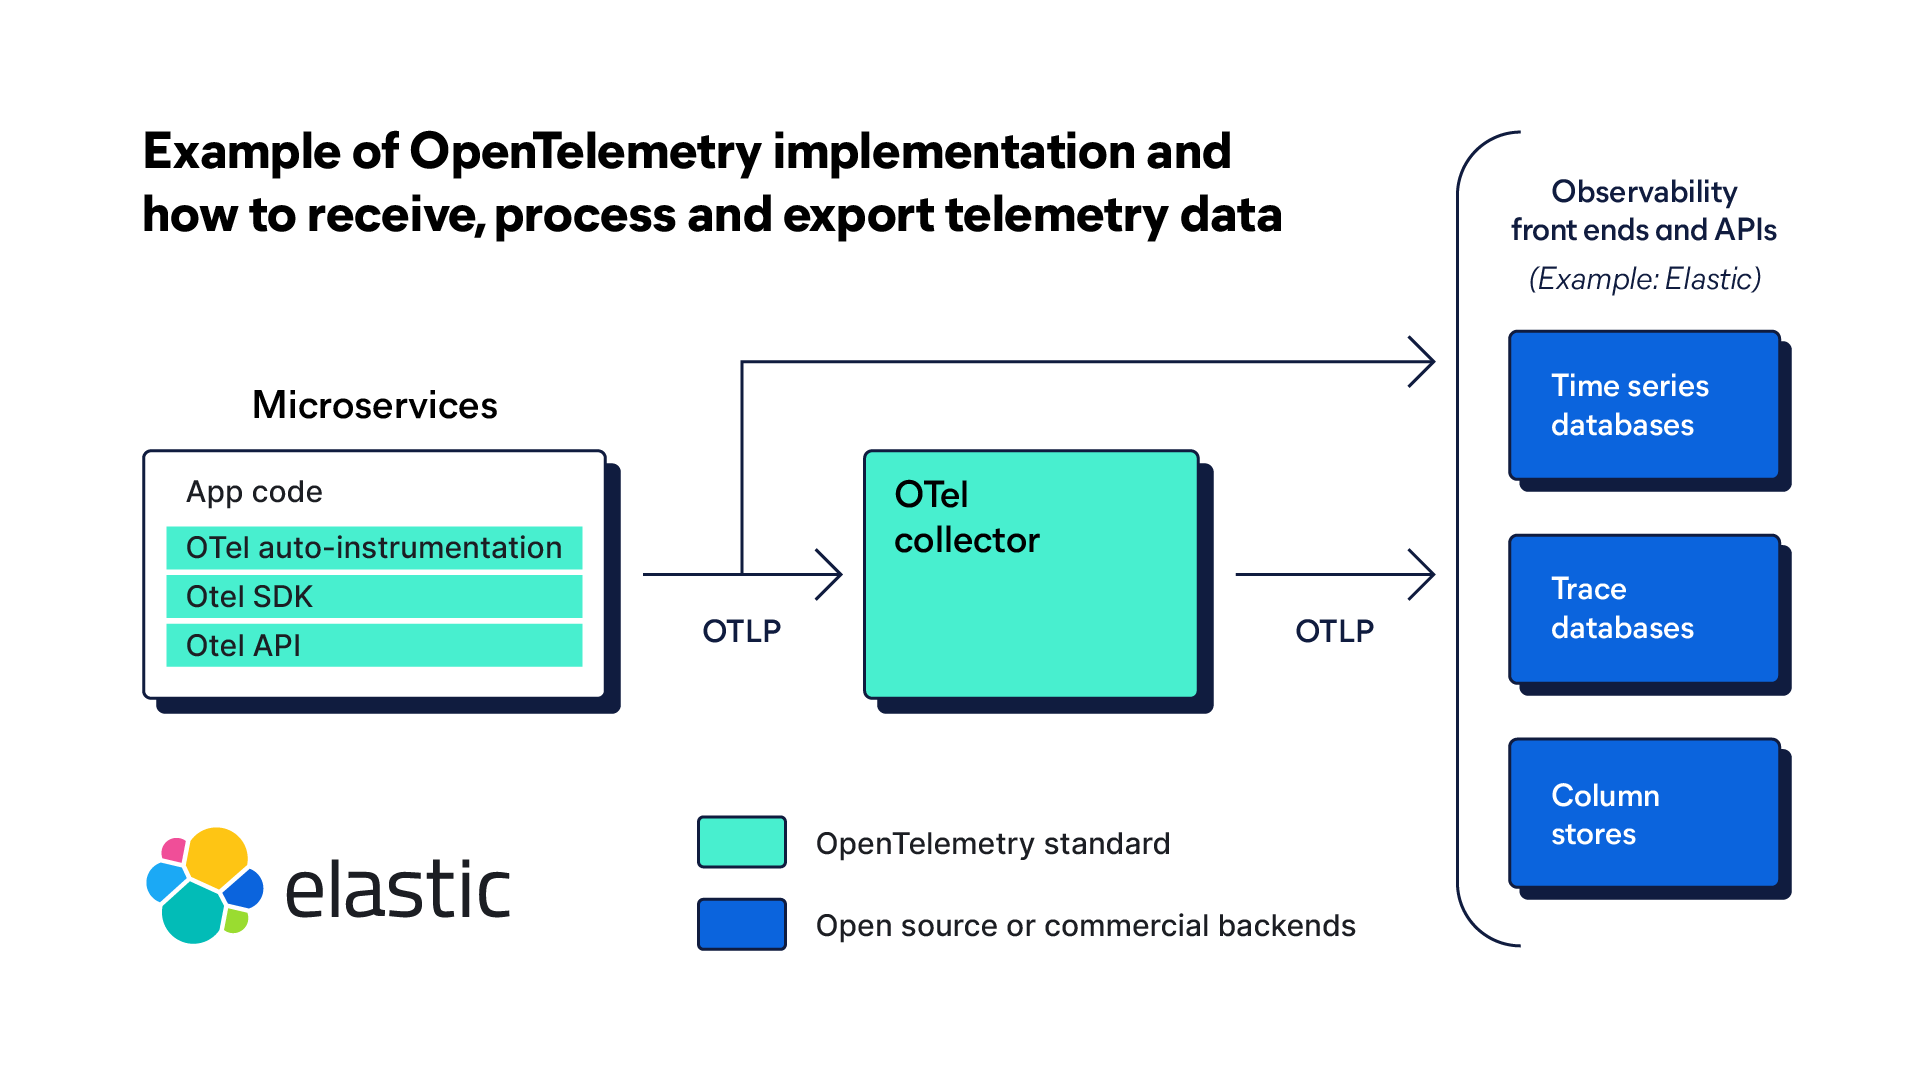
Before trace (and other telemetry) data is generated, an application must be instrumented. Instrumentation is a process of adding code to track trace data. An open source platform such as OpenTelemetry (OTel) provides vendor-neutral SDKs, APIs, and other tools for instrumenting microservice architecture.
Data collection
An end-to-end distributed tracing tool begins collecting data when a user initiates a request. Identifying information — trace ID — is added to each request as it enters the system. This identifying information is passed along as it moves through various services and components.
Each step during the request's journey is also recorded. The initial one is called the parent span, while each next one is called a child span. Each child span is encoded with the original trace ID, a unique span ID, timestamp, status, and other relevant metadata. Spans are organized hierarchically, following the journey through services across the entire environment.
For APM, instrumenting an application and enabling trace collection makes it possible to collect tracing application metrics, or numerical values, that can be used to monitor the application's performance. These include:
- Request rate — the number of requests per second
- Error rate — the number of requests that fail
- Latency — the time it takes to respond to a request
- Duration — the time the request takes
- Throughput — the volume of requests an application can handle in a given time period
Trace analysis
Once the request is complete and the trace collects all the data, the data is aggregated. Using the data from spans such as trace identifiers, timestamps, and other contextual information, developers can locate resource bottlenecks, latency issues, or errors.
Monitoring and visualization
Tracing application metrics can help monitor an application's performance. When and if they change, SREs and DevOps teams can spring to action.
With artificial intelligence (AI) or machine learning, the monitoring process can be partially automated and engineers are alerted to potential issues before they occur. An AI assistant can also help dig deeper into trace analysis and quickly explore underlying issues by correlating observability data from other sources.
Finally, all of the spans are visualized in a waterfall graph, with a parent span at the top and child spans nested below. This graph is a bird's-eye view of what an application was doing while it was trying to respond to a request. Then, engineers can understand which parts of a distributed system are experiencing performance issues, errors, or bottlenecks.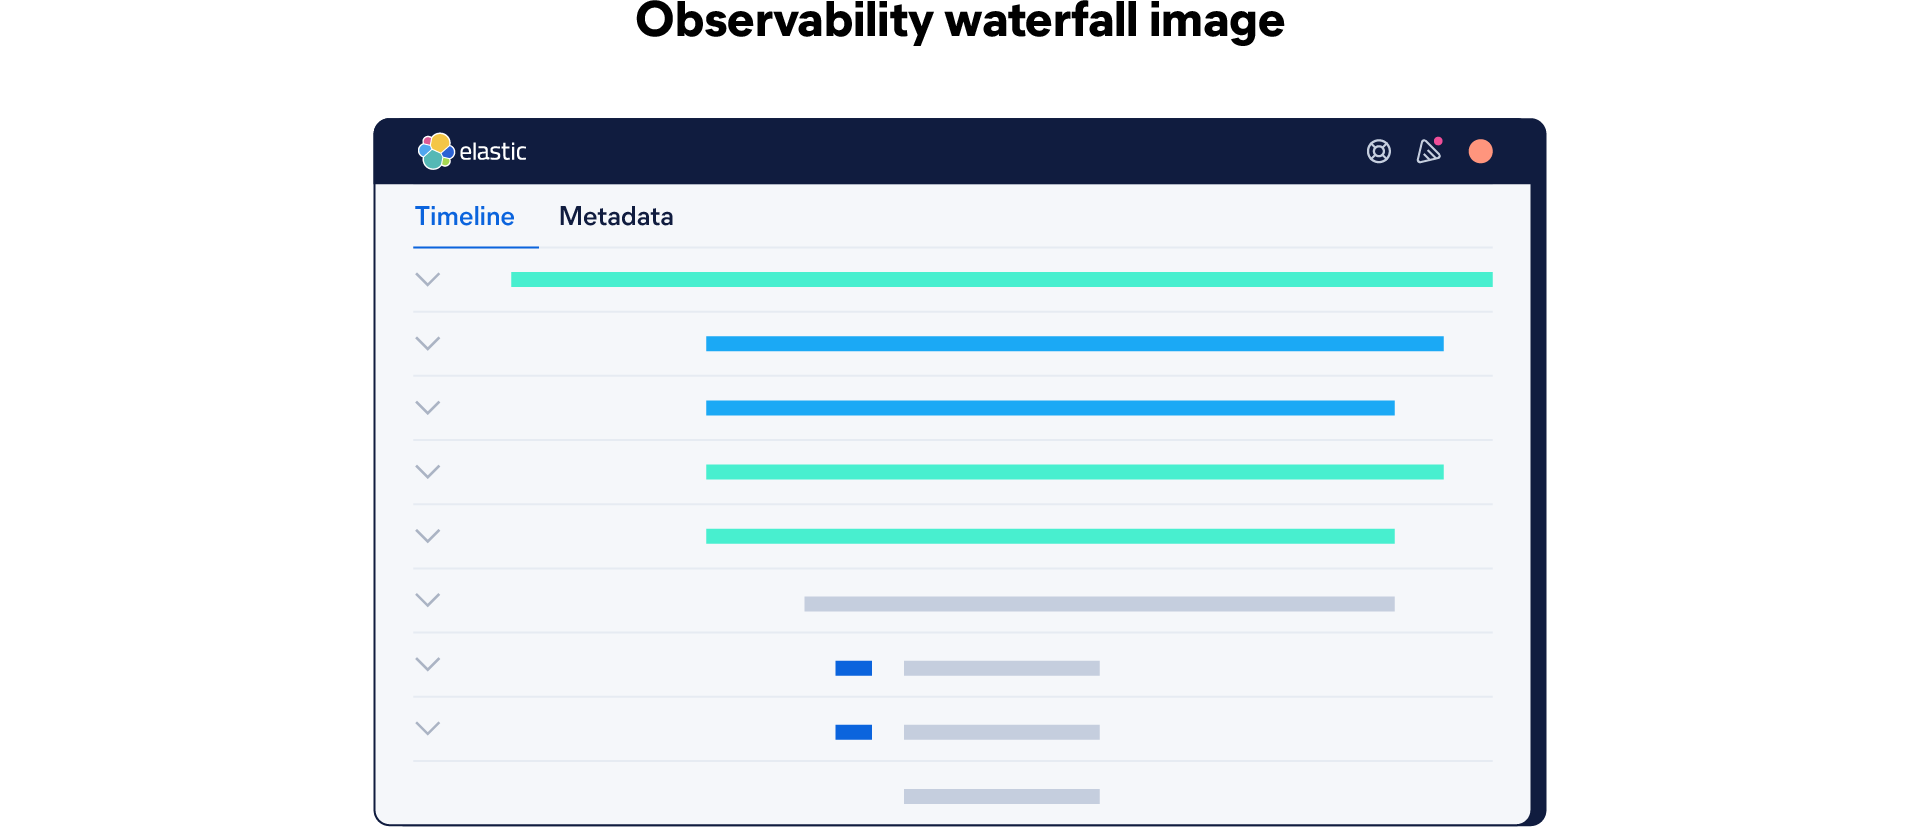
Open standards for tracing in OpenTelemetry
OpenTelemetry is an open source observability framework consisting of tools, APIs, and SDKs. OTel enables SREs, DevOps, and IT teams to instrument, collect, and export telemetry data — including traces — in a single, unified format for analysis.
The Cloud Native Computing Foundation (CNCF) developed OTel to provide standardized protocols, schema, and tools for collecting and routing telemetry data to observability platforms. With a strong focus on traces, OTel is the result of a merger of two prior CNCF projects, OpenTracing and OpenCensus. They were designed to set a single standard for code instrumentation and routing telemetry data to an observability backend.
Since 2019, when the two projects were combined, both open source communities and enterprises have been adopting OTel because it provides a single, unified format of instrumentation and is future-proof.
Prior to OpenTelemetry and its open standards, observability data was often inconsistent and hard to correlate. In a distributed environment, DevOps and IT had to instrument different libraries that supported their organization's various applications and services, across several programming languages. Often, each code instrumentation, APM, or tracing tool was proprietary, creating a myriad of problems for distributed tracing. When there's no standard and no single tool to collect (and export) traces from all applications, engineers' job of finding performance issues or errors becomes a challenge.
With OTel, on the other hand, engineers don't need to re-instrument code to track trace data from different services, nor do they need to manually re-route telemetry data with every change. There's just one, open source framework for observability and monitoring tools that are OpenTelemetry compliant.
As new technologies — such as deeper integrations with AI on anomaly detection and generative AI — emerge, OpenTelemetry will continue to provide a single, supported integration framework for end-to-end distributed tracing.
OTel standards for tracing include:
- A single set of APIs and conventions for collecting trace data
- Span is defined as a core unit of tracing
- Semantic conventions for naming spans and adding attributes
- A context mechanism for linking spans across different services
- Support for different programming languages
Learn more about OpenTelemetry with Elastic
Traces, metrics, logs, and profiles
Telemetry data — logs, metrics, and traces — provides complete observability into the behavior of applications, servers, services, or databases in a distributed environment. Also known as the three pillars of observability, logs, metrics, and traces create a complete, correlated record of every user request and transaction.
Each of the three data types provides essential information about the environment. Together, they help DevOps, IT, and SRE teams track the performance of the whole system in real-time and historically.
Traces
Traces are detailed records of a request's path through the entire distributed system to provide context. By pulling together siloed data and recording a user's every action, traces help engineers discover bottlenecks and debug and monitor applications that use multiple applications, as well as understand dependencies and interactions between system components.
Logs
Log files are the timestamped records of events and system messages. Typically, logs are used for troubleshooting and debugging. They provide insights into system behavior and help identify issues.
What's more, most programming languages have built-in logging capabilities. So developers tend to continue using their existing logging frameworks.
Learn more about logging and OpenTelemetry
Metrics
Metrics are numerical values that represent the state or performance of a system over a period of time. Metrics are the key performance indicators. DevOps and other teams use them to monitor the system's health, identify trends, and trigger alerts.
Profiles: the future fourth pillar of modern observability
Metrics, logs, and traces offer valuable insights into what happens where. It's also important to understand why the system behaves as it does: why is there a performance bottleneck or a wasteful computation? That's where continuous profiling comes in. It helps achieve a comprehensive view of the system, it offers a deeper level of visibility — to the code level.
Learn more about observability pillars
How to implement distributed tracing
Distributed traces are essential for monitoring and troubleshooting complex systems and distributed applications. Before implementing distributed tracing, it's important to define tracing goals and needs and identify critical services and request paths. Here are five steps for a successful implementation of distributed tracing:
- Choose a tracing tool, such as OpenTelemetry (the now standard framework for collecting traces, metrics, and logs). It should be compatible with your existing tech stack, as well as future-proof.
- Instrument services and applications. This involves adding tracing code to your codebase and defining traces (spans) in your application.
- Collect traces by initiating a request to collect data. Ensure that traces are accurate and complete through context propagation, an essential component of distributed tracing.
- Export traces for monitoring, analysis, and visualization to your chosen backend or cloud tracing service provider.
- Identify performance bottlenecks, inefficiencies, and errors. Trace data can help detect errors, find slow-performing services, and visualize data flows across services.
APM and distributed traces with Elastic
Application performance monitoring (APM) plays a key role in modern observability, guiding you through all of your telemetry data by providing context and improving root cause analysis with machine learning.
Leverage Elastic Observability and the power of search to improve code quality with end-to-end distributed tracing. Capture and analyze distributed transactions spanning microservices, serverless, and monolithic architectures, including support for AWS Lambda, auto-instrumentation, and popular languages like Java, .NET, PHP, Python, Go, and more. Minimize downtime and optimize customer experience by annotating transactions with customer data and deployment markers.
Traces resources
- [Blog] Understanding observability metrics: Types, golden signals, and best practices
- [Blog] 3 pillars of observability: Unified logs, metrics, and traces
- [Technical Guide] Trace sample timeline
- [Technical Guide] Traces