Self manage APM Server
editSelf manage APM Server
editThe easiest way to get started with Elastic APM is by using our hosted Elasticsearch Service on Elastic Cloud. The Elasticsearch Service is available on AWS, GCP, and Azure. See getting started documentation to get started in minutes.
Starting in version 8.0.0, Fleet uses the APM integration to set up and manage APM index templates, ILM policies, and ingest pipelines. APM Server will only send data to Elasticsearch after the APM integration has been installed.
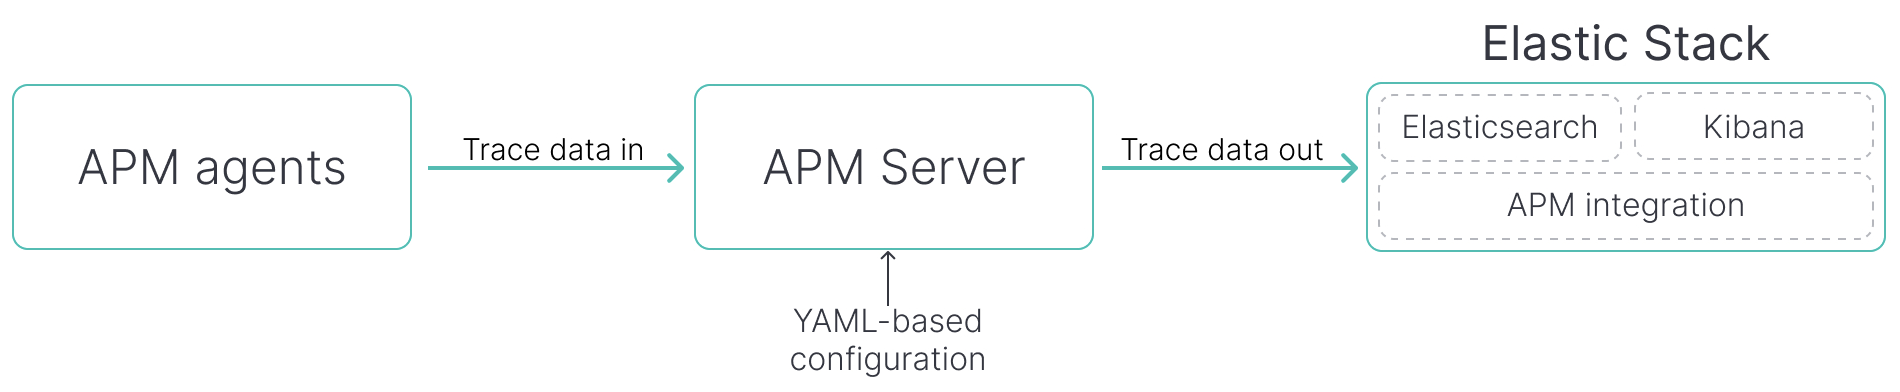
The APM Server receives performance data from your APM agents, validates and processes it, and then transforms the data into Elasticsearch documents. If you’re on this page, then you’ve chosen to self-manage the Elastic Stack, and you now must decide how to run and configure the APM Server. There are two options, and the components required are different for each:
APM Server binary
editInstall, configure, and run the APM Server binary wherever you need it.
Pros:
- Simplest self-managed option
- No addition component knowledge required
- YAML configuration simplifies automation
Supported outputs:
- Elasticsearch
- Elasticsearch Service
- Logstash
- Kafka
- Redis
- File
- Console
Required components:
- APM agents
- APM Server
- Elastic Stack
Configuration method: YAML
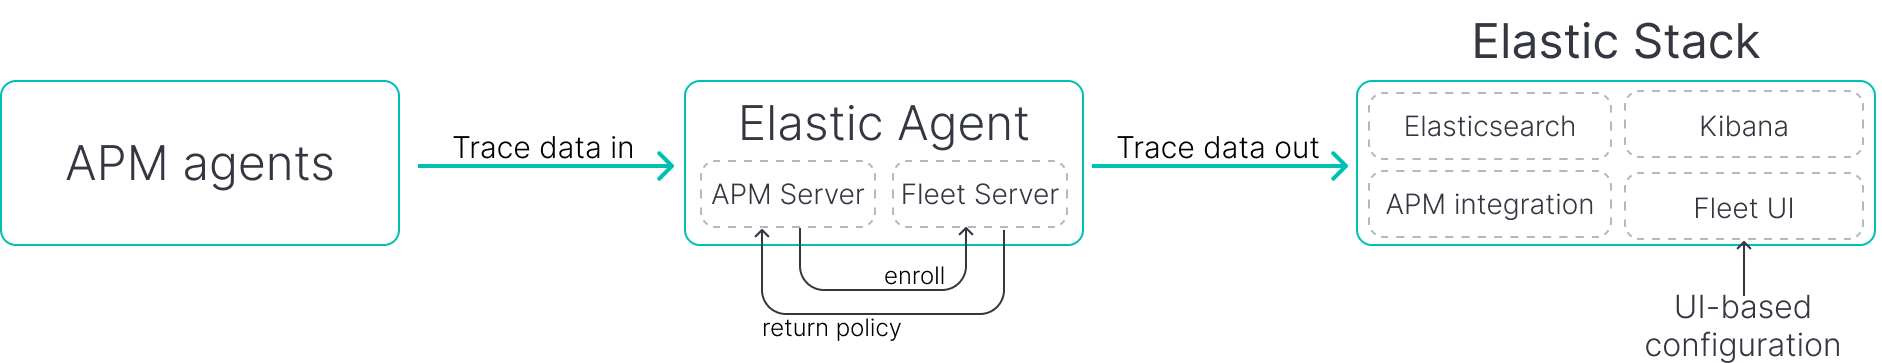
Fleet-managed APM Server
editFleet is a web-based UI in Kibana that is used to centrally manage Elastic Agents. In this deployment model, use Elastic Agent to spin up APM Server instances that can be centrally-managed in a custom-curated user interface.
Fleet-managed APM Server does not have full feature parity with the APM Server binary method of running Elastic APM.
Pros:
- Conveniently manage one, some, or many different integrations from one central Fleet UI.
Supported outputs:
- Elasticsearch
- Elasticsearch Service
Required components:
- APM agents
- APM Server
- Elastic Agent
- Fleet Server
- Elastic Stack
Configuration method: Kibana UI
Help me decide
editUse the decision tree below to help determine which method of configuring and running the APM Server is best for your use case.