- Kibana Guide: other versions:
- What is Kibana?
- What’s new in 8.15
- Kibana concepts
- Quick start
- Set up
- Install Kibana
- Configure Kibana
- Alerting and action settings
- APM settings
- Banners settings
- Cases settings
- Enterprise Search settings
- Fleet settings
- i18n settings
- Logging settings
- Logs settings
- Metrics settings
- Monitoring settings
- Reporting settings
- Search sessions settings
- Secure settings
- Security settings
- Spaces settings
- Task Manager settings
- Telemetry settings
- URL drilldown settings
- Start and stop Kibana
- Access Kibana
- Securing access to Kibana
- Add data
- Upgrade Kibana
- Configure security
- Configure reporting
- Configure logging
- Configure monitoring
- Command line tools
- Production considerations
- Discover
- Dashboard and visualizations
- Canvas
- Maps
- Build a map to compare metrics by country or region
- Track, visualize, and alert on assets in real time
- Map custom regions with reverse geocoding
- Heat map layer
- Tile layer
- Vector layer
- Plot big data
- Search geographic data
- Configure map settings
- Connect to Elastic Maps Service
- Import geospatial data
- Troubleshoot
- Reporting and sharing
- Machine learning
- Graph
- Alerting
- Observability
- Playground
- Security
- Dev Tools
- Fleet
- Osquery
- Stack Monitoring
- Stack Management
- Cases
- Connectors
- Amazon Bedrock
- Cases
- CrowdStrike
- D3 Security
- Google Gemini
- IBM Resilient
- Index
- Jira
- Microsoft Teams
- Observability AI Assistant
- OpenAI
- Opsgenie
- PagerDuty
- SentinelOne
- Server log
- ServiceNow ITSM
- ServiceNow SecOps
- ServiceNow ITOM
- Swimlane
- Slack
- Tines
- Torq
- Webhook
- Webhook - Case Management
- xMatters
- Preconfigured connectors
- License Management
- Maintenance windows
- Manage data views
- Numeral Formatting
- Rollup Jobs
- Manage saved objects
- Security
- Spaces
- Advanced Settings
- Tags
- Upgrade Assistant
- Watcher
- REST API
- Get features API
- Kibana spaces APIs
- Kibana role management APIs
- User session management APIs
- Saved objects APIs
- Data views API
- Index patterns APIs
- Alerting APIs
- Action and connector APIs
- Cases APIs
- Import and export dashboard APIs
- Logstash configuration management APIs
- Machine learning APIs
- Osquery manager API
- Short URLs APIs
- Get Task Manager health
- Upgrade assistant APIs
- Synthetics APIs
- Uptime APIs
- Kibana plugins
- Troubleshooting
- Accessibility
- Release notes
- Kibana 8.15.5
- Kibana 8.15.4
- Kibana 8.15.3
- Kibana 8.15.2
- Kibana 8.15.1
- Kibana 8.15.0
- Kibana 8.14.3
- Kibana 8.14.2
- Kibana 8.14.1
- Kibana 8.14.0
- Kibana 8.13.4
- Kibana 8.13.3
- Kibana 8.13.2
- Kibana 8.13.1
- Kibana 8.13.0
- Kibana 8.12.2
- Kibana 8.12.1
- Kibana 8.12.0
- Kibana 8.11.4
- Kibana 8.11.3
- Kibana 8.11.2
- Kibana 8.11.1
- Kibana 8.11.0
- Kibana 8.10.4
- Kibana 8.10.3
- Kibana 8.10.2
- Kibana 8.10.1
- Kibana 8.10.0
- Kibana 8.9.2
- Kibana 8.9.1
- Kibana 8.9.0
- Kibana 8.8.2
- Kibana 8.8.1
- Kibana 8.8.0
- Kibana 8.7.1
- Kibana 8.7.0
- Kibana 8.6.1
- Kibana 8.6.0
- Kibana 8.5.2
- Kibana 8.5.1
- Kibana 8.5.0
- Kibana 8.4.3
- Kibana 8.4.2
- Kibana 8.4.1
- Kibana 8.4.0
- Kibana 8.3.3
- Kibana 8.3.2
- Kibana 8.3.1
- Kibana 8.3.0
- Kibana 8.2.3
- Kibana 8.2.2
- Kibana 8.2.1
- Kibana 8.2.0
- Kibana 8.1.3
- Kibana 8.1.2
- Kibana 8.1.1
- Kibana 8.1.0
- Kibana 8.0.0
- Kibana 8.0.0-rc2
- Kibana 8.0.0-rc1
- Kibana 8.0.0-beta1
- Kibana 8.0.0-alpha2
- Kibana 8.0.0-alpha1
- Developer guide
Using ES|QL
editUsing ES|QL
editThe Elasticsearch Query Language, ES|QL, makes it easier to explore your data without leaving Discover.
In this tutorial we’ll use the Kibana sample web logs in Discover and Lens to explore the data and create visualizations.
Prerequisite
editTo be able to select Language ES|QL from the Data views menu the enableESQL
setting must be enabled from Stack Management > Advanced Settings. It is enabled by default.
Use ES|QL
editTo load the sample data:
- On the home page, click Try sample data.
- Click Other sample data sets.
- On the Sample web logs card, click Add data.
- Open the main menu and select Discover.
- From the Data views menu, select Language ES|QL.
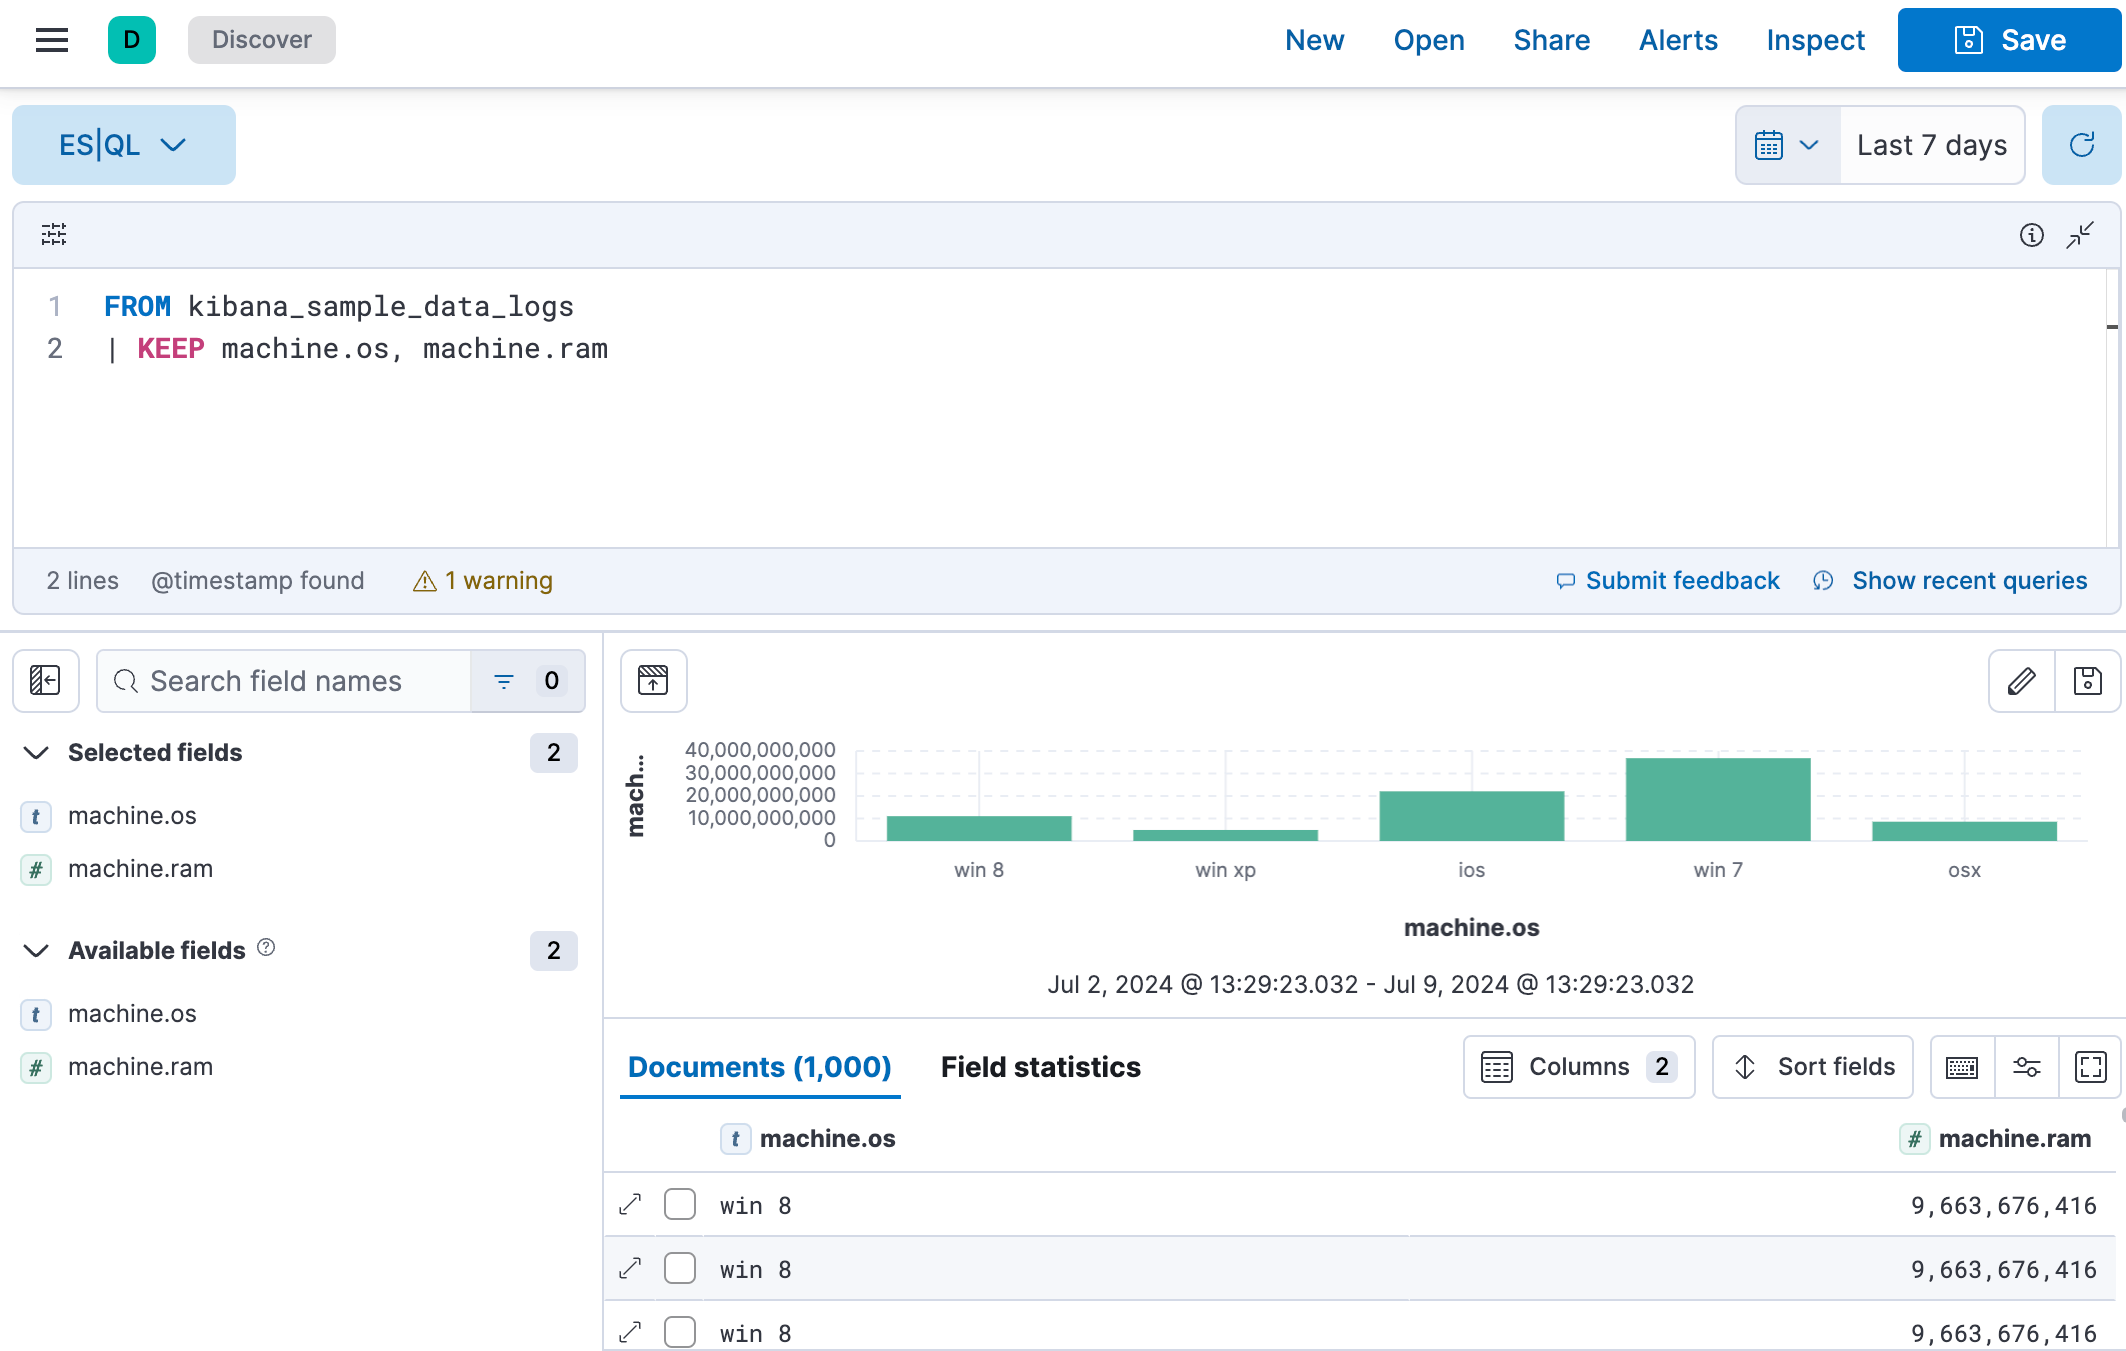
Let’s say we want to find out what operating system users have and how much RAM is on their machine.
- Set the time range to Last 7 days.
-
Expand
the query bar.
- Put each processing command on a new line for better readability.
-
Copy the query below:
FROM kibana_sample_data_logs | KEEP machine.os, machine.ram
-
Click ▶Run.
ES|QL keywords are not case sensitive.
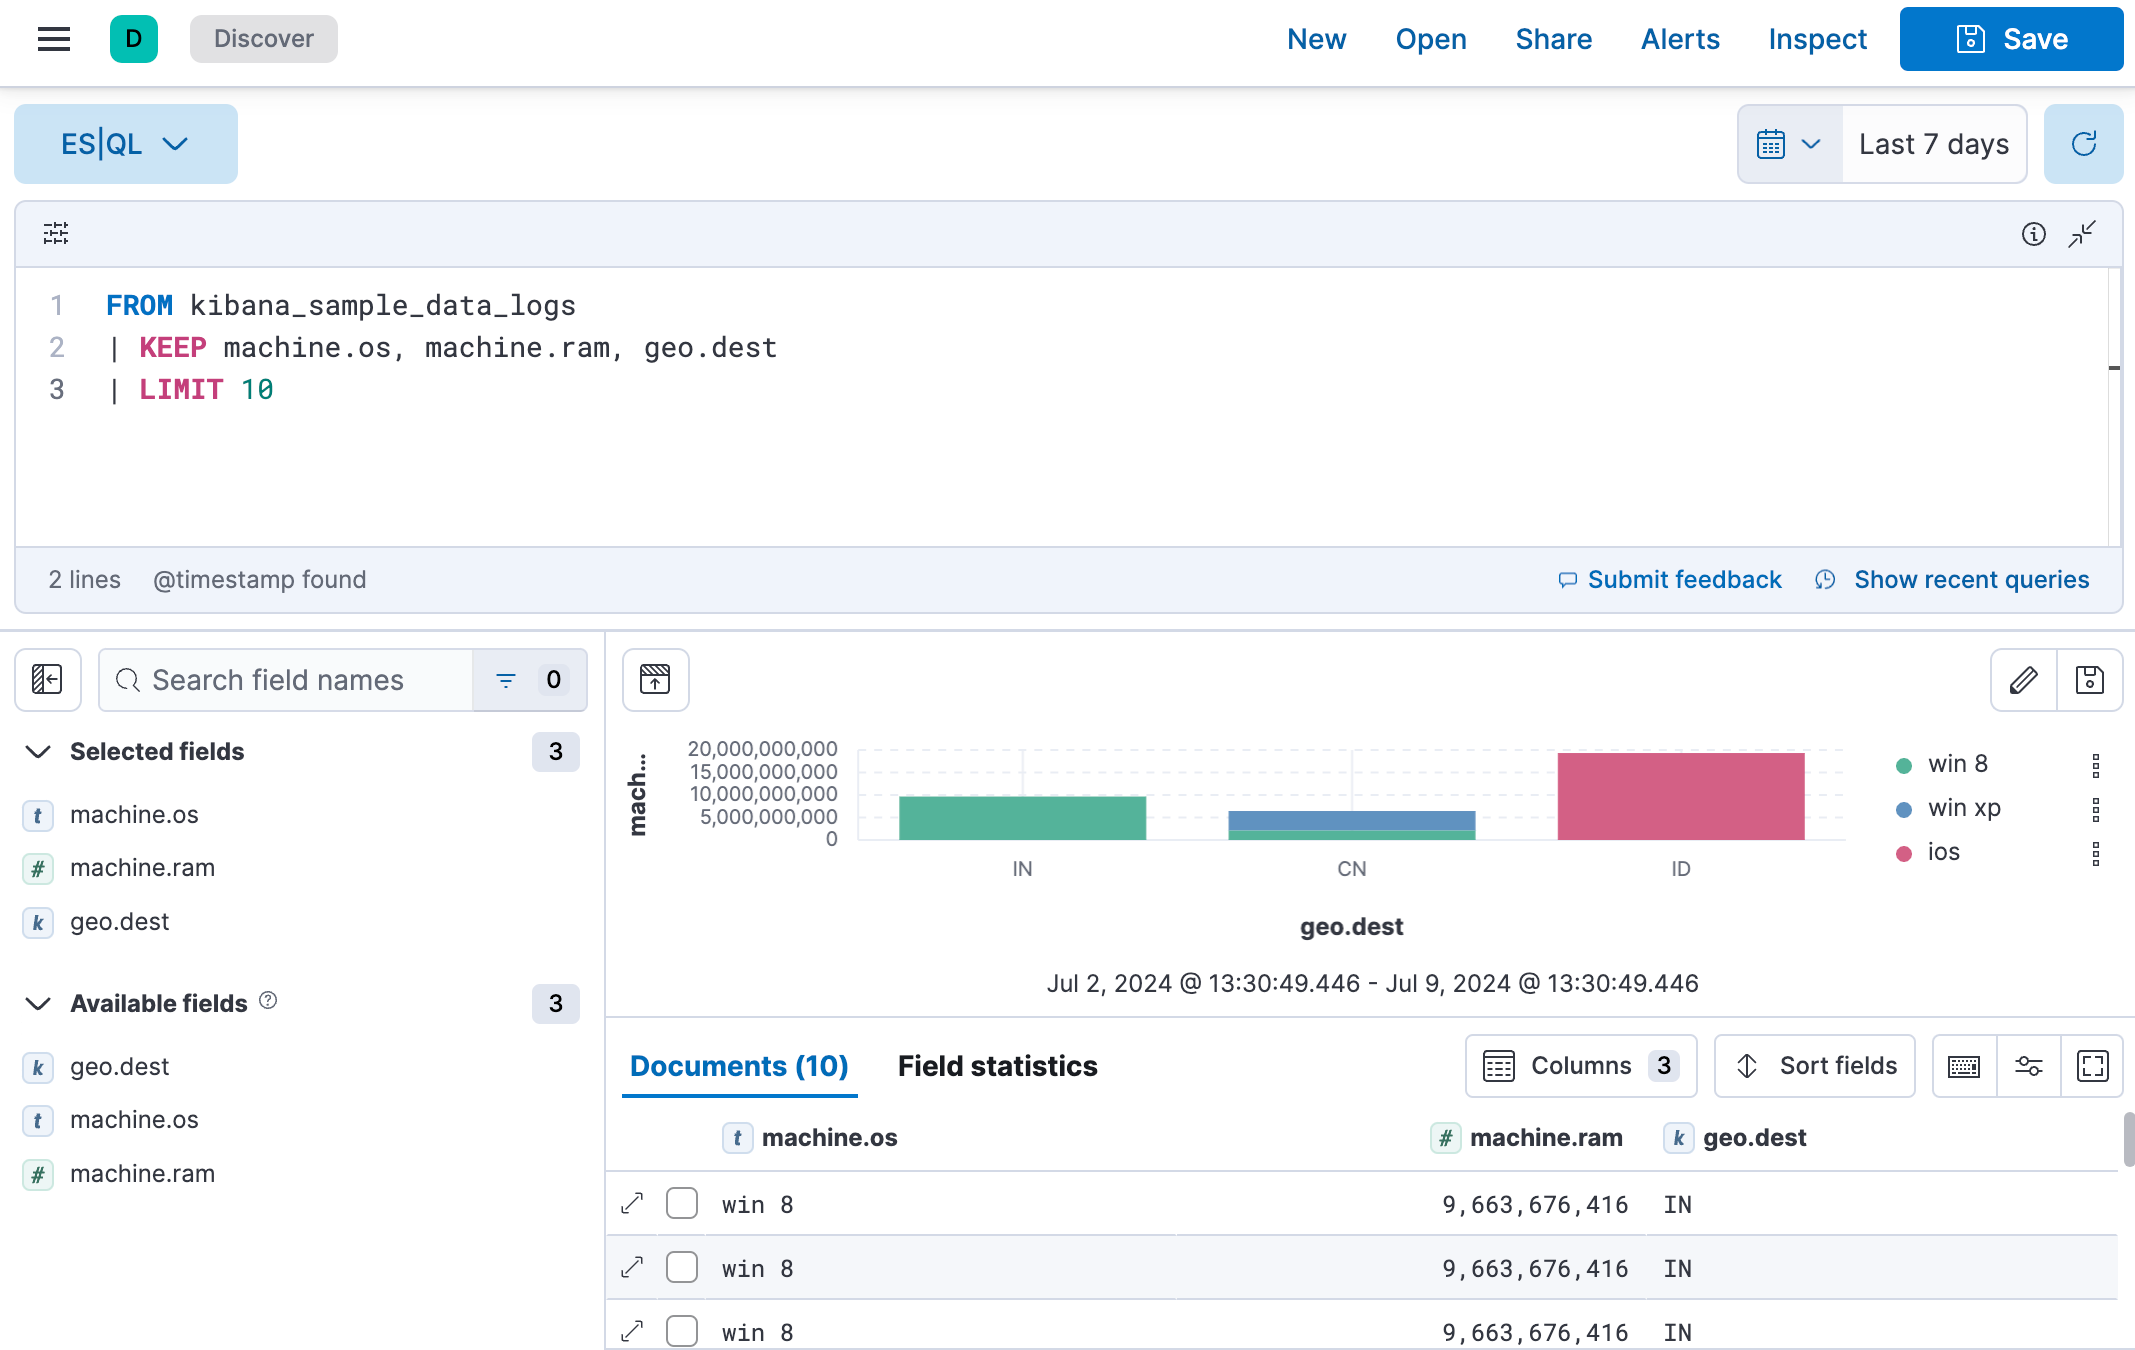
Let’s add geo.dest
to our query, to find out the geographical destination of the visits, and limit the results.
-
Copy the query below:
FROM kibana_sample_data_logs | KEEP machine.os, machine.ram, geo.dest | LIMIT 10
-
Click ▶Run.
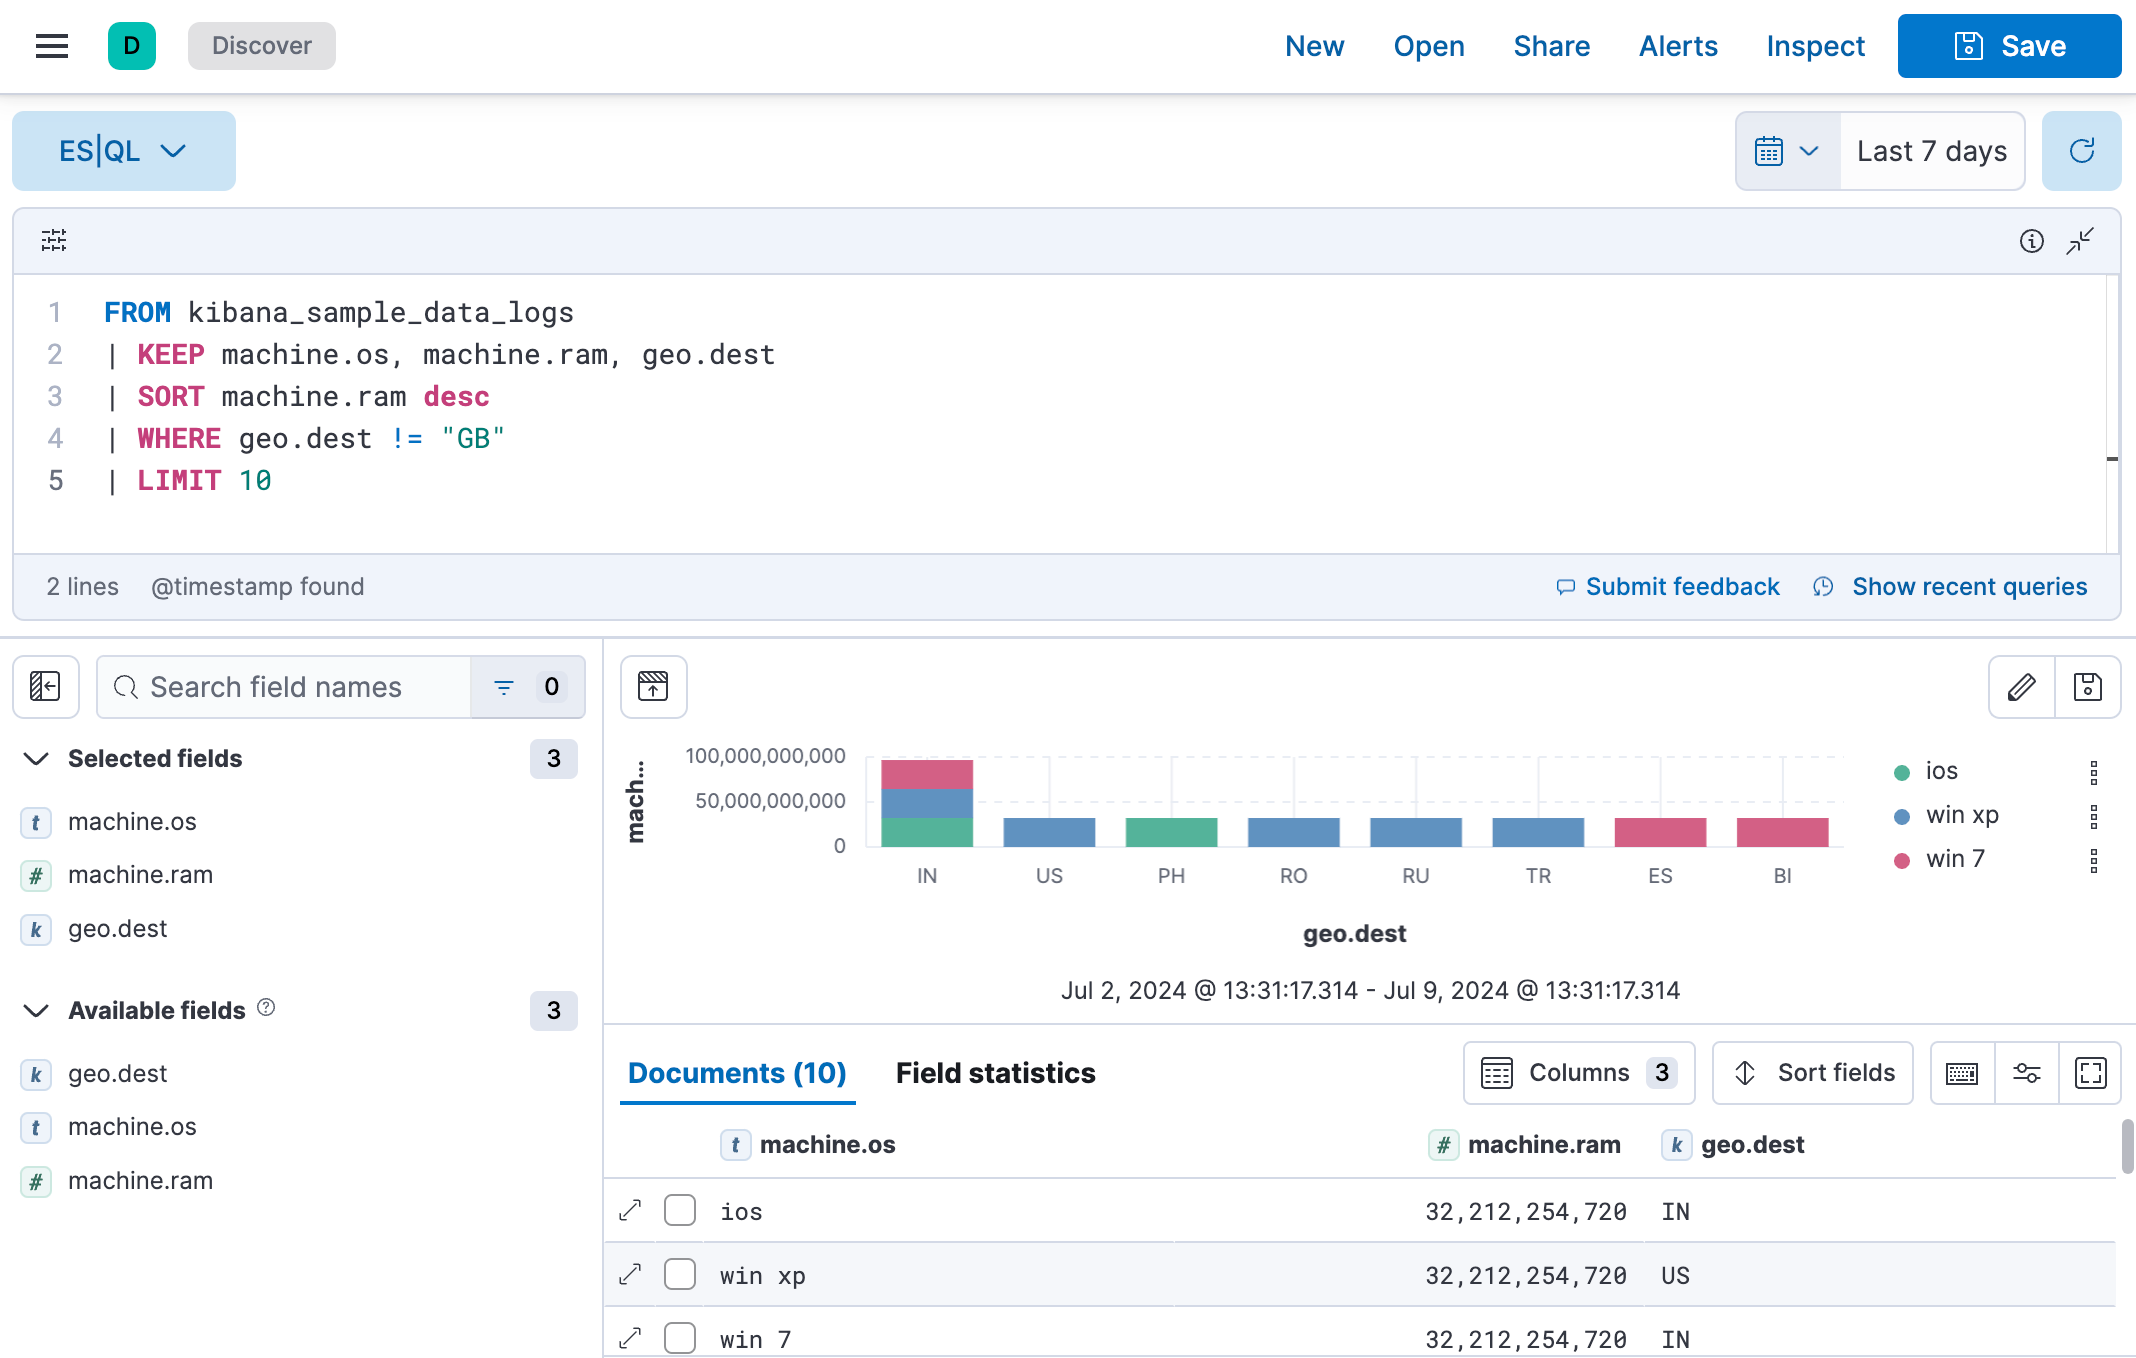
Let’s sort the data by machine ram and filter out the destination GB.
-
Copy the query below:
FROM kibana_sample_data_logs | KEEP machine.os, machine.ram, geo.dest | SORT machine.ram desc | WHERE geo.dest != "GB" | LIMIT 10
-
Click ▶Run.
- Click Save to save the query and visualization to a dashboard.
To make changes to the visualization you can use the visualization drop-down. To make changes to the colors used or the axes, or click the pencil icon. This opens an in-line editor where you can change the colors and axes of the visualization.
For the complete ES|QL documentation, including tutorials, examples and the full syntax reference, refer to the Elasticsearch documentation. For a more detailed overview of ES|QL in Kibana, refer to Use ES|QL in Kibana.
On this page