Troubleshooting and limitations
editTroubleshooting and limitations
editAlerting provides many options for diagnosing problems with rules and connectors.
Check the Kibana log
editRules and connectors log to the Kibana logger with tags of [alerting] and [actions], respectively. Generally, the messages are warnings and errors. In some cases, the error might be a false positive, for example, when a connector is deleted and a rule is running.
server log [11:39:40.389] [error][alerting][alerting][plugins][plugins] Executing Rule "5b6237b0-c6f6-11eb-b0ff-a1a0cbcf29b6" has resulted in Error: Saved object [action/fdbc8610-c6f5-11eb-b0ff-a1a0cbcf29b6] not found
Some of the resources, such as saved objects and API keys, may no longer be available or valid, yielding error messages about those missing resources.
Use the debugging tools
editThe following debugging tools are available:
- Kibana versions 7.10 and above have a Test connector UI.
- Kibana versions 7.11 and above include improved Webhook error messages, better overall debug logging for actions and connectors, and Task Manager diagnostics endpoints.
Using rules and connectors list for the current state and finding issues
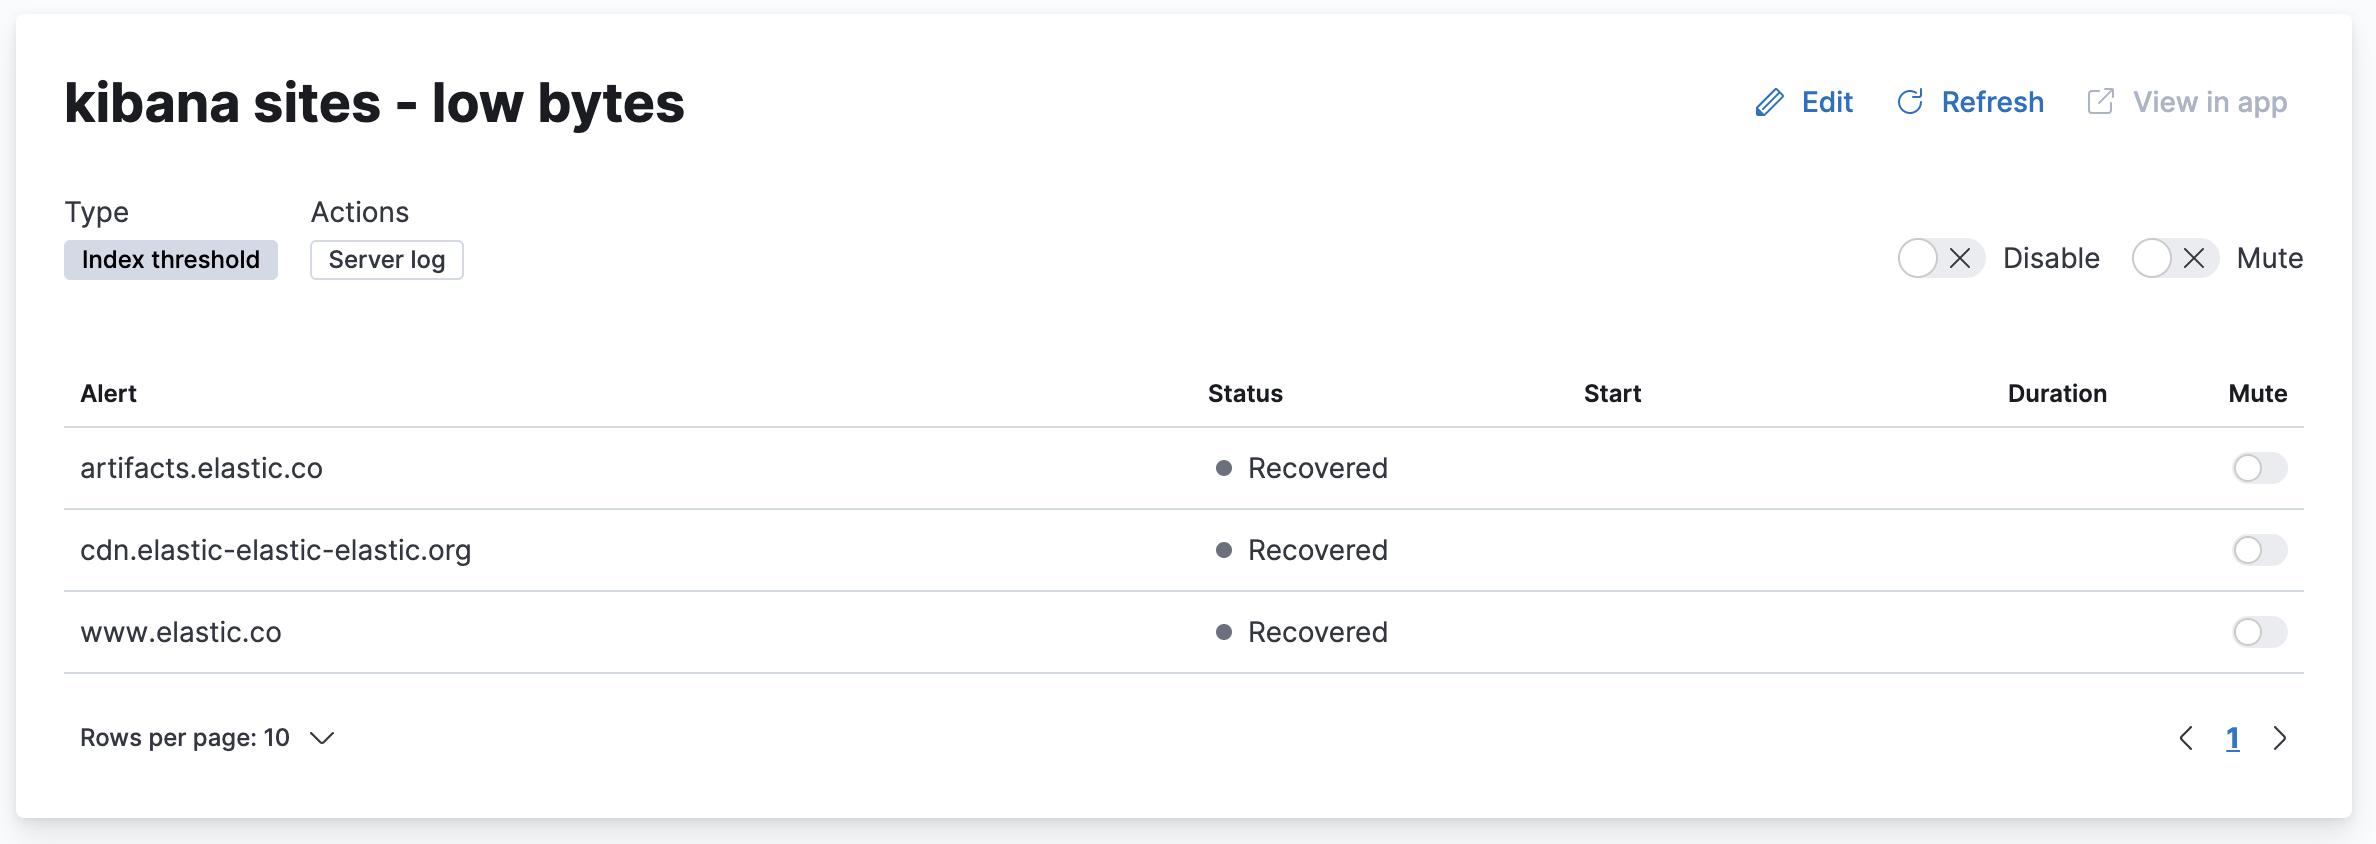
editRules in Stack Management lists the rules available in the space you’re currently in. When you click a rule name, you are navigated to the details page for the rule, where you can see currently active alerts. The start date on this page indicates when a rule is triggered, and for what alerts. In addition, the duration of the condition indicates how long the instance is active.

Preview the index threshold rule chart
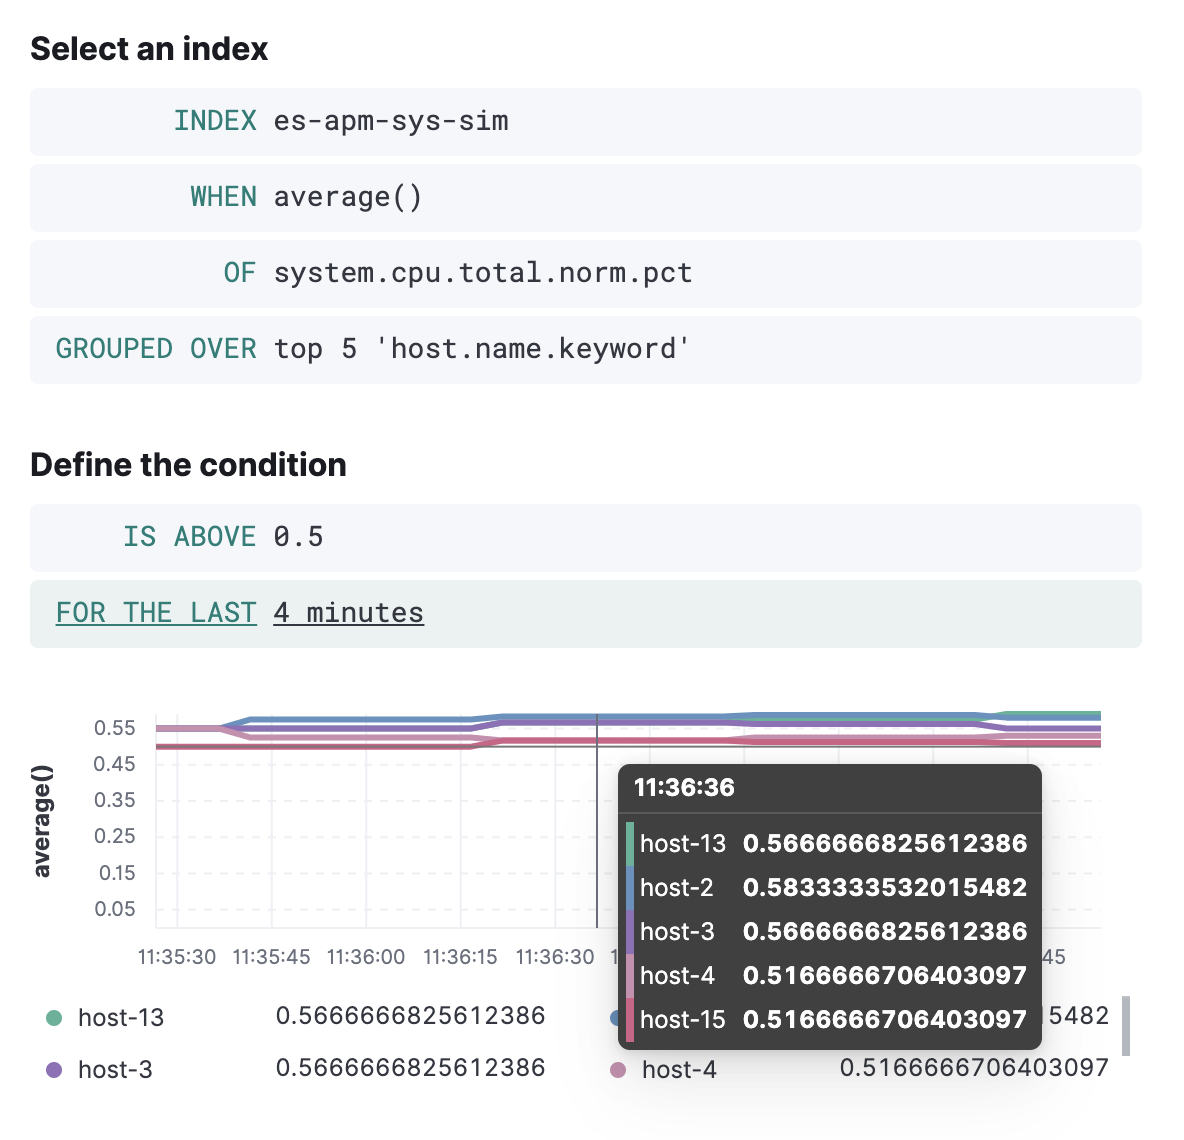
editWhen creating or editing an index threshold rule, you see a graph of the data the rule will operate against, from some date in the past until now, updated every 5 seconds.

The end date is related to the check interval for the rule. You can use this view to see if the rule is getting the data you expect, and visually compare to the threshold value (a horizontal line in the graph). If the graph does not contain any lines except for the threshold line, then the rule has an issue, for example, no data is available given the specified index and fields or there is a permission error. Diagnosing these may be difficult - but there may be log messages for error conditions.
Use the REST APIs
editThere is a rich set of HTTP endpoints to introspect and manage rules and connectors. One of the HTTP endpoints available for actions is the run connector API. You can use this to “test” an action. For instance, if you have a server log action created, you can run it via curling the endpoint:
curl -X POST -k \
 -H 'kbn-xsrf: foo' \
 -H 'content-type: application/json' \
 api/actions/connector/a692dc89-15b9-4a3c-9e47-9fb6872e49ce/_execute \
 -d '{"params":{"subject":"hallo","message":"hallo!","to":["[email protected]"]}}'
[preview] This functionality is in technical preview and may be changed or removed in a future release. Elastic will work to fix any issues, but features in technical preview are not subject to the support SLA of official GA features. In addition, there is a command-line client that uses legacy rule APIs, which can be easier to use, but must be updated for the new APIs. CLI tools to list, create, edit, and delete alerts (rules) and actions (connectors) are available in kbn-action, which you can install as follows:
npm install -g pmuellr/kbn-action
The same REST POST _execute API command will be:
kbn-action execute a692dc89-15b9-4a3c-9e47-9fb6872e49ce ‘{"params":{"subject":"hallo","message":"hallo!","to":["[email protected]"]}}’
The result of this HTTP request (and printed to stdout by kbn-action) will be data returned by the action, along with error messages if errors were encountered.
Look for error banners
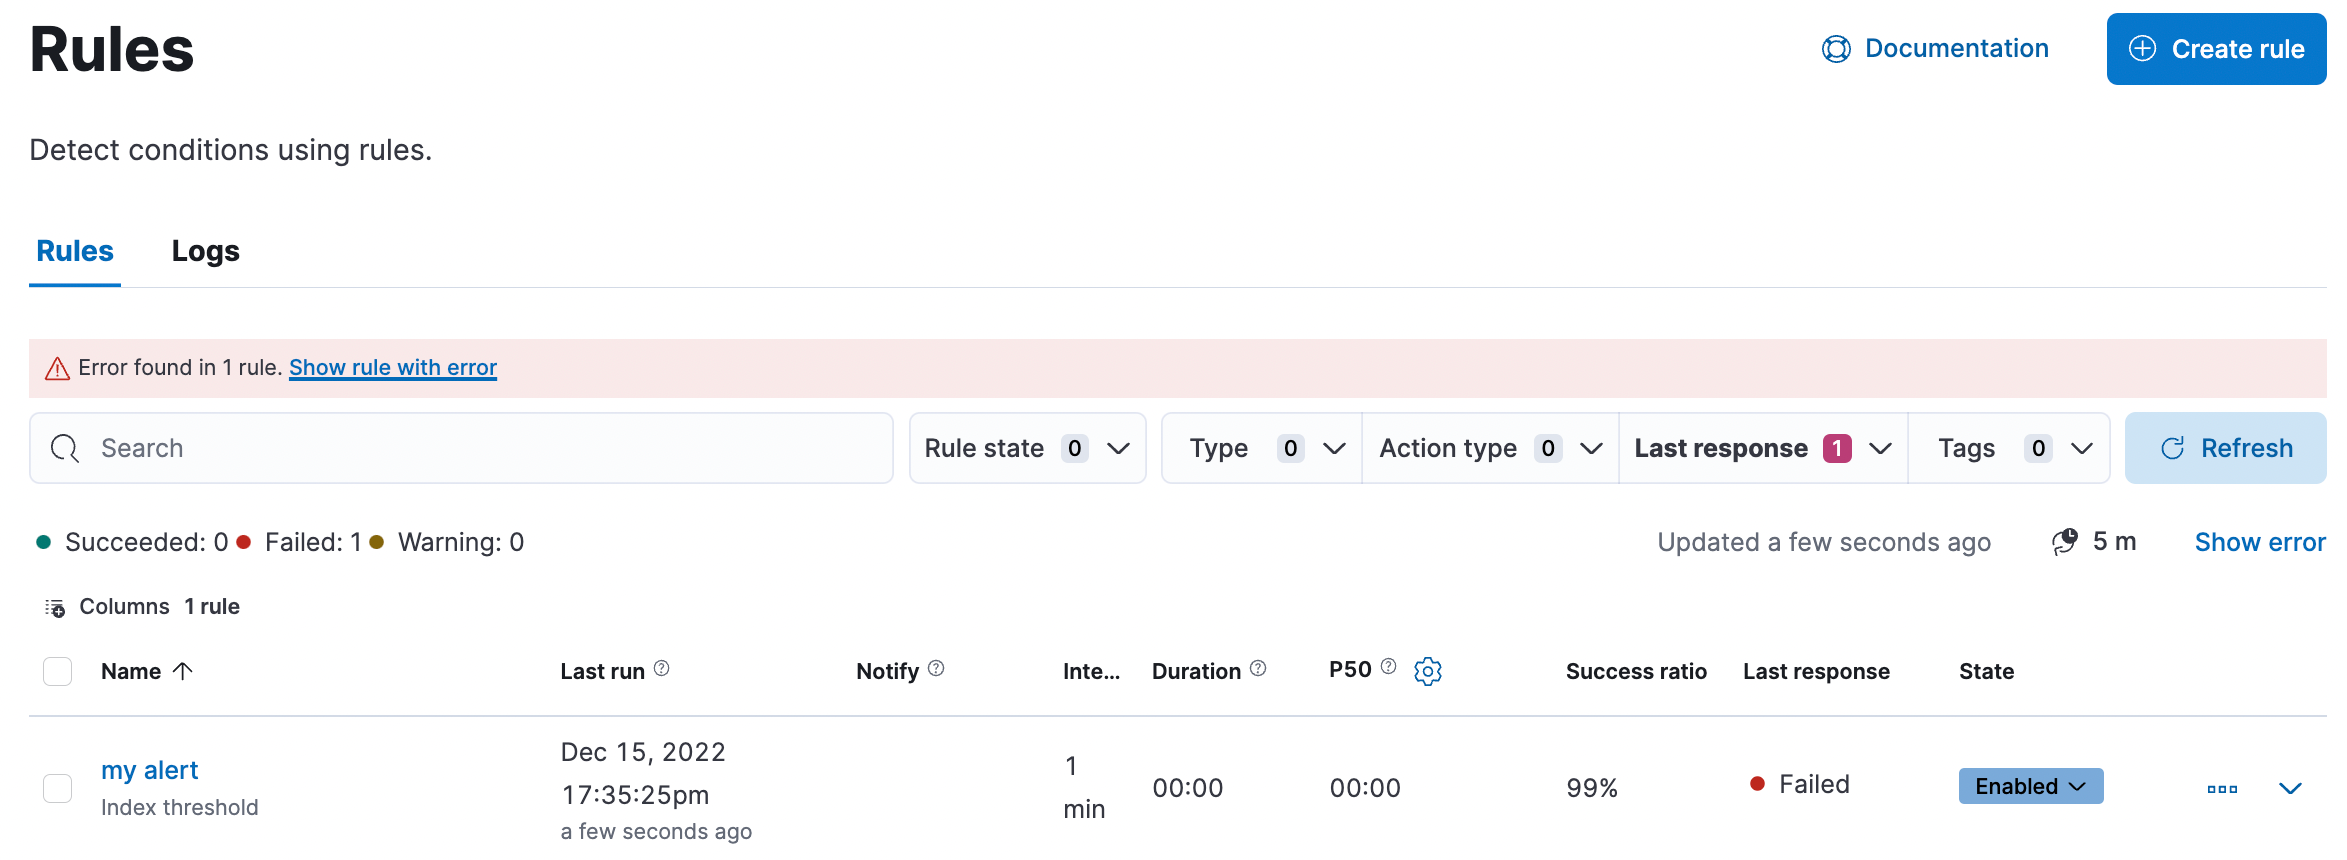
editThe Stack Management > Rules page contains an error banner that helps to identify the errors for the rules:

Task Manager diagnostics
editUnder the hood, the alerting features use a plugin called Task Manager, which handles the scheduling, running, and error handling of the tasks. This means that failure cases in alerting features will, at times, be revealed by the Task Manager mechanism, rather than the Rules mechanism.
Task Manager provides a visible status which can be used to diagnose issues and is very well documented health monitoring and troubleshooting.
Task Manager uses the .kibana_task_manager index, an internal index that contains all the saved objects that represent the tasks in the system.
Getting from a rule to its task
editWhen a rule is created, a task is created, scheduled to run at the interval specified. For example, when a rule is created and configured to check every 5 minutes, then the underlying task will be expected to run every 5 minutes. In practice, after each time the rule runs, the task is scheduled to run again in 5 minutes, rather than being scheduled to run every 5 minutes indefinitely.
If you use the alerting APIs, such as the get rule API or find rules API, you’ll get an object that contains rule details:
{
  "id":"ed30d1b0-7c9e-11ed-ba24-0b137d501cb7",
  "name":"cluster_health_rule",
  "consumer":"alerts",
  "enabled":true,
  ...
  "scheduled_task_id":"ed30d1b0-7c9e-11ed-ba24-0b137d501cb7",
  ...
  "next_run":"2022-12-15T17:56:55.713Z"
}
The field you’re looking for is the one called scheduled_task_id which includes the identifier for the Task Manager task. You can then go to the Console and find more information about that task in system indices:
GET .kibana_task_manager/_doc/task:ed30d1b0-7c9e-11ed-ba24-0b137d501cb7
For example:
{
  "_index": ".kibana_task_manager_8.7.0_001",
  "_id": "task:ed30d1b0-7c9e-11ed-ba24-0b137d501cb7",
  "_version": 85,
  "_seq_no": 13009,
  "_primary_term": 3,
  "found": true,
  "_source": {
    "migrationVersion": {
      "task": "8.5.0"
    },
    "task": {
      "retryAt": null,
      "runAt": "2022-12-15T18:05:19.804Z",
      "startedAt": null,
      "params": """{"alertId":"ed30d1b0-7c9e-11ed-ba24-0b137d501cb7","spaceId":"default","consumer":"alerts"}""",
      "ownerId": null,
      "enabled": true,
      "schedule": {
        "interval": "1m"
      },
      "taskType": "alerting:monitoring_alert_cluster_health",
      "scope": [
        "alerting"
      ],
      "traceparent": "",
      "state": """{"alertTypeState":{"lastChecked":1671127459923},"alertInstances":{},"alertRecoveredInstances":{},"previousStartedAt":"2022-12-15T18:04:19.804Z"}""",
      "scheduledAt": "2022-12-15T18:04:16.824Z",
      "attempts": 0,
      "status": "idle"
    },
    "references": [],
    "updated_at": "2022-12-15T18:04:19.998Z",
    "coreMigrationVersion": "8.7.0",
    "created_at": "2022-12-15T17:35:55.204Z",
    "type": "task"
  }
}
For the rule to work, this task must be in a healthy state. Its health information is available in the Task Manager health API or in verbose logs if debug logging is enabled. When diagnosing the health state of the task, you will most likely be interested in the following fields:
-
status - This is the current status of the task. Is Task Manager currently running? Is Task Manager idle, and you’re waiting for it to run? Or has Task Manager has tried to run and failed?
-
runAt - This is when the task is scheduled to run next. If this is in the past and the status is idle, Task Manager has fallen behind or isn’t running. If it’s in the past, but the status is running, then Task Manager has picked it up and is working on it, which is considered healthy.
-
retryAt -
Another time field, like
runAt. If this field is populated, then Task Manager is currently running the task. If the task doesn’t complete (and isn’t marked as failed), then Task Manager will give it another attempt at the time specified underretryAt.
Investigating the underlying task can help you gauge whether the problem you’re seeing is rooted in the rule not running at all, whether it’s running and failing, or whether it’s running but exhibiting behavior that is different than what was expected (at which point you should focus on the rule itself, rather than the task).
In addition to the above methods, refer to the following approaches and common issues:
Temporarily throttle all tasks
editIf cluster performance becomes degraded from excessive or expensive rules and Kibana is sluggish or unresponsive, you can temporarily reduce load to the Task Manager by updating its settings:
xpack.task_manager.max_workers: 1
xpack.task_manager.poll_interval: 1h
This approach should be used only temporarily as a last resort to restore function to Kibana when it is unresponsive and attempts to identify and snooze or disable slow-running rules have not fixed the situation. It severely throttles all background tasks, not just those relating to alerting features. The task manager will run only one task at a time and will look for more work each hour.
Limitations
editThe following limitations and known problems apply to the 8.15.5 release of the Kibana alerting features:
Alert visibility
editIf you create a rule in the Observability or Elastic Security app, its alerts are
not visible in Stack Management > Rules. You can view them only in the
Kibana app where you created the rule. If you use the create rule API, the visibility of the alerts is related to
the consumer property.