Elasticsearch 7.11.0 released: Adding flexibility with schema on read
We’re pleased to announce Elasticsearch 7.11.0, based on Apache Lucene 8.7.0.
Version 7.11 is the latest stable release of Elasticsearch and is now available for deployment via Elasticsearch Service on Elastic Cloud or via download for use in your own environment(s).
Ready to roll up your sleeves and get started? We have the links you need:
- Start Elasticsearch on Elastic Cloud
- Download Elasticsearch
- Elasticsearch 7.11.0 release notes
- Elasticsearch 7.11.0 breaking changes
With today’s release, our Elastic Enterprise Search, Elastic Observability, and Elastic Security solutions also received updates. To learn more, check out our main Elastic 7.11 release blog or read the Elastic Enterprise Search blog, Elastic Observability blog, and Elastic Security blog for more details.
Known Issue
Installations of Elasticsearch 7.11.0 with an Active Directory or LDAP realm configured will fail to start. A fix will be released in 7.11.1. For more details, please see the 7.11.0 release notes.
Schema on read for Elasticsearch is here
You’ve read that right: schema on read is here for Elasticsearch 7.11. You can now get the best of both worlds on a single platform — the performance and scale you expect from schema on write, combined with the flexibility and data discovery of schema on read. We call the feature that delivers schema on read runtime fields, and it's now in beta.
Runtime fields let you define and evaluate fields at query time, which opens a wide range of new use cases. If you need to adapt to a changing log format or fix an index mapping, use runtime fields to change the schema on the fly without reindexing your data. Or if you are indexing new data and don’t have intimate knowledge of what it contains, you can use runtime fields to discover this data and define your schema without impacting others.
No matter the use case, runtime fields reduce the time to get value from your data.
Better together
Elasticsearch is known for being a fast distributed search and analytics engine because we use schema on write. With schema on write, fields are written to disk at ingest time, so you need to plan what fields you want in advance and test to ensure you’re happy with the results.
The payoff is fast queries, which is why schema on write is still the default mechanism within Elasticsearch for indexing and searching data. With schema on read, there is added flexibility as it doesn’t require as much planning and testing, which comes in handy when you don’t know your data or when you realize after indexing you want to do things differently.
What’s unique about our implementation of schema on read is that we’ve built runtime fields on the same Elastic Stack — the same architecture, the same tools, and the same interfaces you are already using. There are no new datastores, languages, or components, and there’s no additional procedural overhead. Using both of these mechanisms complement each other, giving you performance with schema on write and flexibility with schema on read.
Be sure to read more on the runtime fields blog and if you’re ready to dig in, check out the technical blog.
Your data is good as cold with searchable snapshots and cold tier both generally available
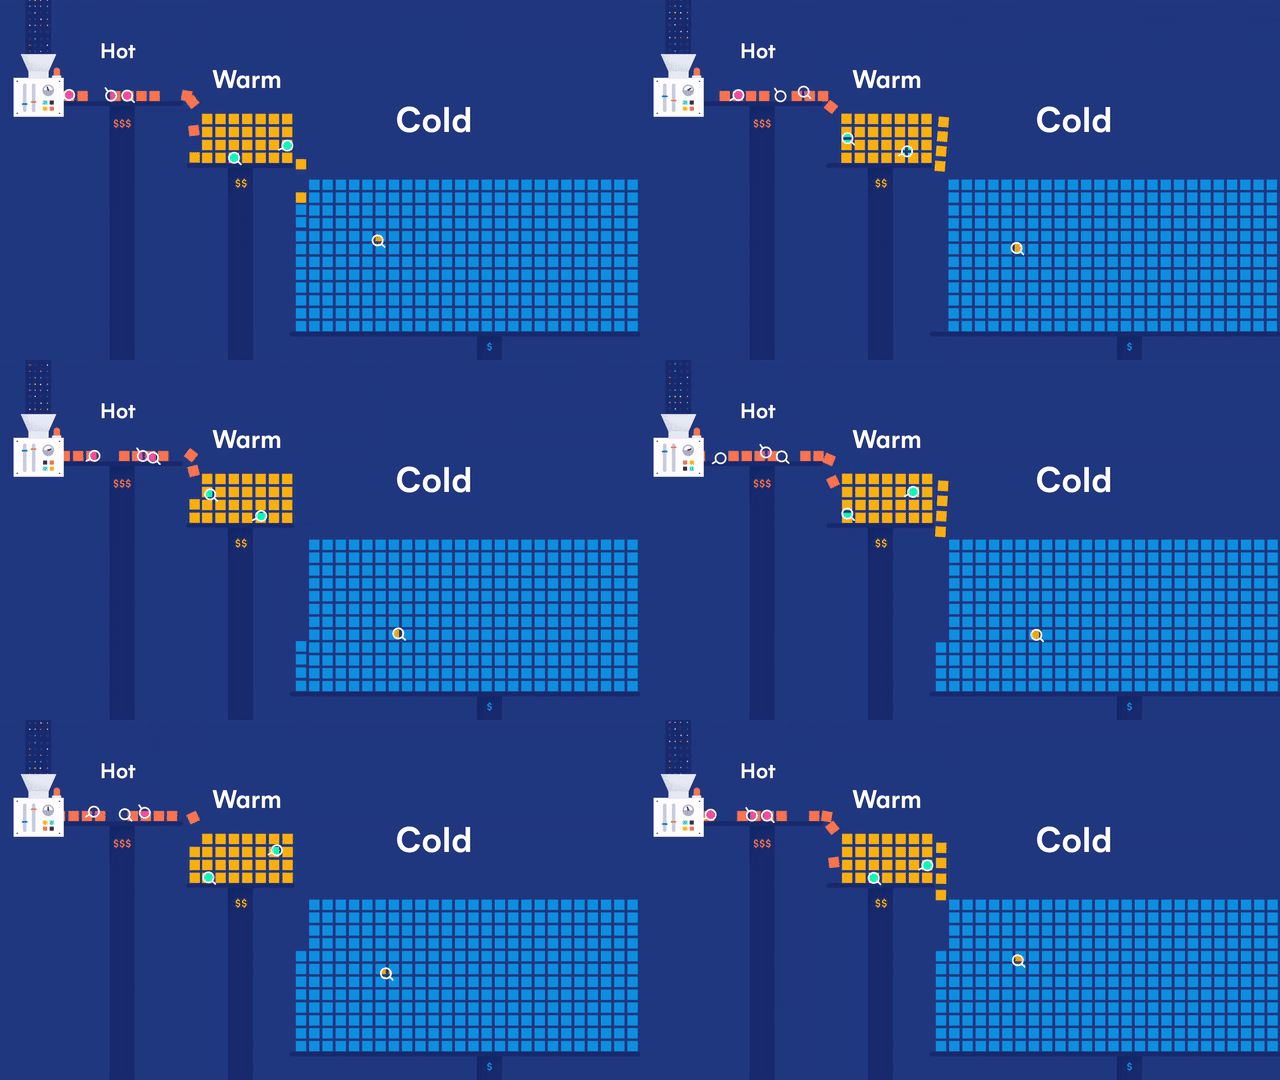
In Elasticsearch 7.10 we announced searchable snapshots, a new capability that brings S3 and other object stores to life. Searchable snapshots let you directly search the data stored in your snapshots as well as the new cold tier, which can reduce your data storage costs by up to 50% over the existing warm tier. Storing more data at a reduced cost provides an easy and fast way to get a deeper level of data insight.
Data is a differentiator to how business and operations run. With exponential data growth, it becomes economically unfeasible to store and search all of your data on expensive compute with SSD drives.
The typical solution over time is to move your data to a different data tier consisting of less performant disks and compute, and eventually migrating read-only data to snapshots stored on low-cost object storage (such as AWS S3). If you want to search data stored in snapshots, you first need to manually restore the data back to the cluster. This takes time and effort.
But with searchable snapshots, you can directly search these snapshots without the need to “rehydrate” your data.
The cold tier stores your read-only data locally, but it backs the indices with snapshots stored in S3, Azure, Google Cloud, or other low-cost object stores for resiliency. This removes the need to store replicas of your data locally, effectively doubling the density of your local storage nodes. Using the cold tier, you can retain more data locally at a large scale for a significantly reduced cost — all with the same level of reliability, redundancy, and automatic recovery you’ve come to expect from Elasticsearch.
With the cold tier, you no longer need to choose which piece of observability data to delete to save money. Imagine searching year over year on application performance without needing to restore your data first from backups. Or gain increased insight by combining observability data with business intelligence to make intuitive data-driven decisions.
Arm threat hunters and security analysts with years of high-volume security data sources now made easily accessible through searchable snapshots. Collect additional security-related data at greater scale and keep it accessible for longer than previously practical or economical. Performing large security forensic investigations has become a lot easier and less time consuming with data stored on the cold tier.
While we are excited with these new capabilities, our journey does not stop here. We’re currently developing a frozen tier, which takes things a step further and allows you to store and search your data directly on the object store. Removing the need to store data locally at all can reduce your storage costs by an even bigger margin.
This means you’ll be able to search nearly an unlimited amount of data, on demand, with costs approaching that of just storing data on S3.
Searchable snapshots and the cold tier are now generally available for self-managed users. Both are also available in Elastic Cloud along with a cold slider. If you’d like to know more details, please visit the searchable snapshots page or read our dedicated blog.
Threat detection in action with EQL, now generally available
Event query language or EQL has come a long way in helping with threat investigation, identification, and prevention. For those not familiar with EQL, it’s a sequential correlation language that allows you to view multiple events within a system, draw conclusions to give a better perspective of that system, and observe these sequences over a span of time.
Since our announcement in 7.9, we’ve been continuously developing and maturing EQL to assist in threat detection. Let’s walk through one example of how EQL can help identify a MITRE ATT&CK™: Spearphishing (T1193); PowerShell (T1086).
In this attack there is a scriptable child process such as a PowerShell, VBScript or cmd.exe within an MS Office product such as Word, Excel, or Powerpoint.
EQL
process where
  process.parent.name in (
    "WINWORD.EXE", "EXCEL.EXE", "POWERPNT.EXE"
  )
  and process.name in (
    "powershell.exe", "cscript.exe", "wscript.exe", "cmd.exe"
  )
EQL will then use these previous sequence correlations over a span of time to identify the validity.
In this EQL query we are asking “Did MS Office create a VBScript and then execute over a max span of 5 minutes?”
sequence with maxspan=5m
  [file where file.extension == "exe"
    and process.name in ("WINWORD.EXE")
  ] by file.path
  [process where true] by process.executable
The power in EQL is that it allows you to match a sequence of events of various types. It’s similar to other query languages, which helps reduce the learning curve. And it’s built for security — specifically threat hunting and behavior detection.
Find the path with geo_line aggregation
The new geo_line aggregation aggregates all the geo_point values within a bucket into a LineString ordered by the chosen sort field (usually timestamp). This feature is useful when you have a set of locations of an object, and you want the path that the object travelled.
An example of a use case is in shipping logistics. You can collect GPS coordinates of your freight trucks on a regular interval, sort by the timestamp of each such location document, and draw a line that represents the path the truck traveled.
Track security configuration changes with a new security_config_change event.type
As an administrator, making security changes like adding a user or a user role is trivial, but troubleshooting access issues or auditing these changes was impossible.
With the new event.type security_config_change, adding a user or a role is now tracked in the audit log. With this change, there is no need to log the entire payload to audit details of changes to security settings because they are now available with a dedicated event type.
Here’s an example of what is logged when the Put User API is invoked to create or update a native user:
{"type":"audit", "timestamp":"2020-12-30T22:10:09,749+0200", "node.id":"0RMNyghkQYCc_gVd1G6tZQ", "event.type":"security_config_change", "event.action":"put_user", "request.id":"VIiSvhp4Riim_tpkQCVSQA", "put":{"user":{"name":"user1","enabled":false,"roles":["admin","other_role1"],"full_name":"Jack Sparrow","email":"[email protected]","has_password":true,"metadata":{"cunning":10}}}}
For additional information or examples, be sure to check out the audit event types documentation.
A UI is worth a thousand API calls
Elasticsearch UI enhancements are one of the many examples of how Elastic continues to provide a better user experience. Here are some of the major UI enhancements in 7.11.
Autocomplete for Pain|less
Not an expert in Painless scripting? Can’t quite remember the correct syntax? Not a problem with the new autocomplete UI for painless scripts. With helpful autocomplete syntax suggestions, including mapped fields and source, and inline error reporting, you save time and frustration with scripting in Painless. You can find this new UI everywhere painless is used in Kibana.

Searchable snapshots in ILM UI
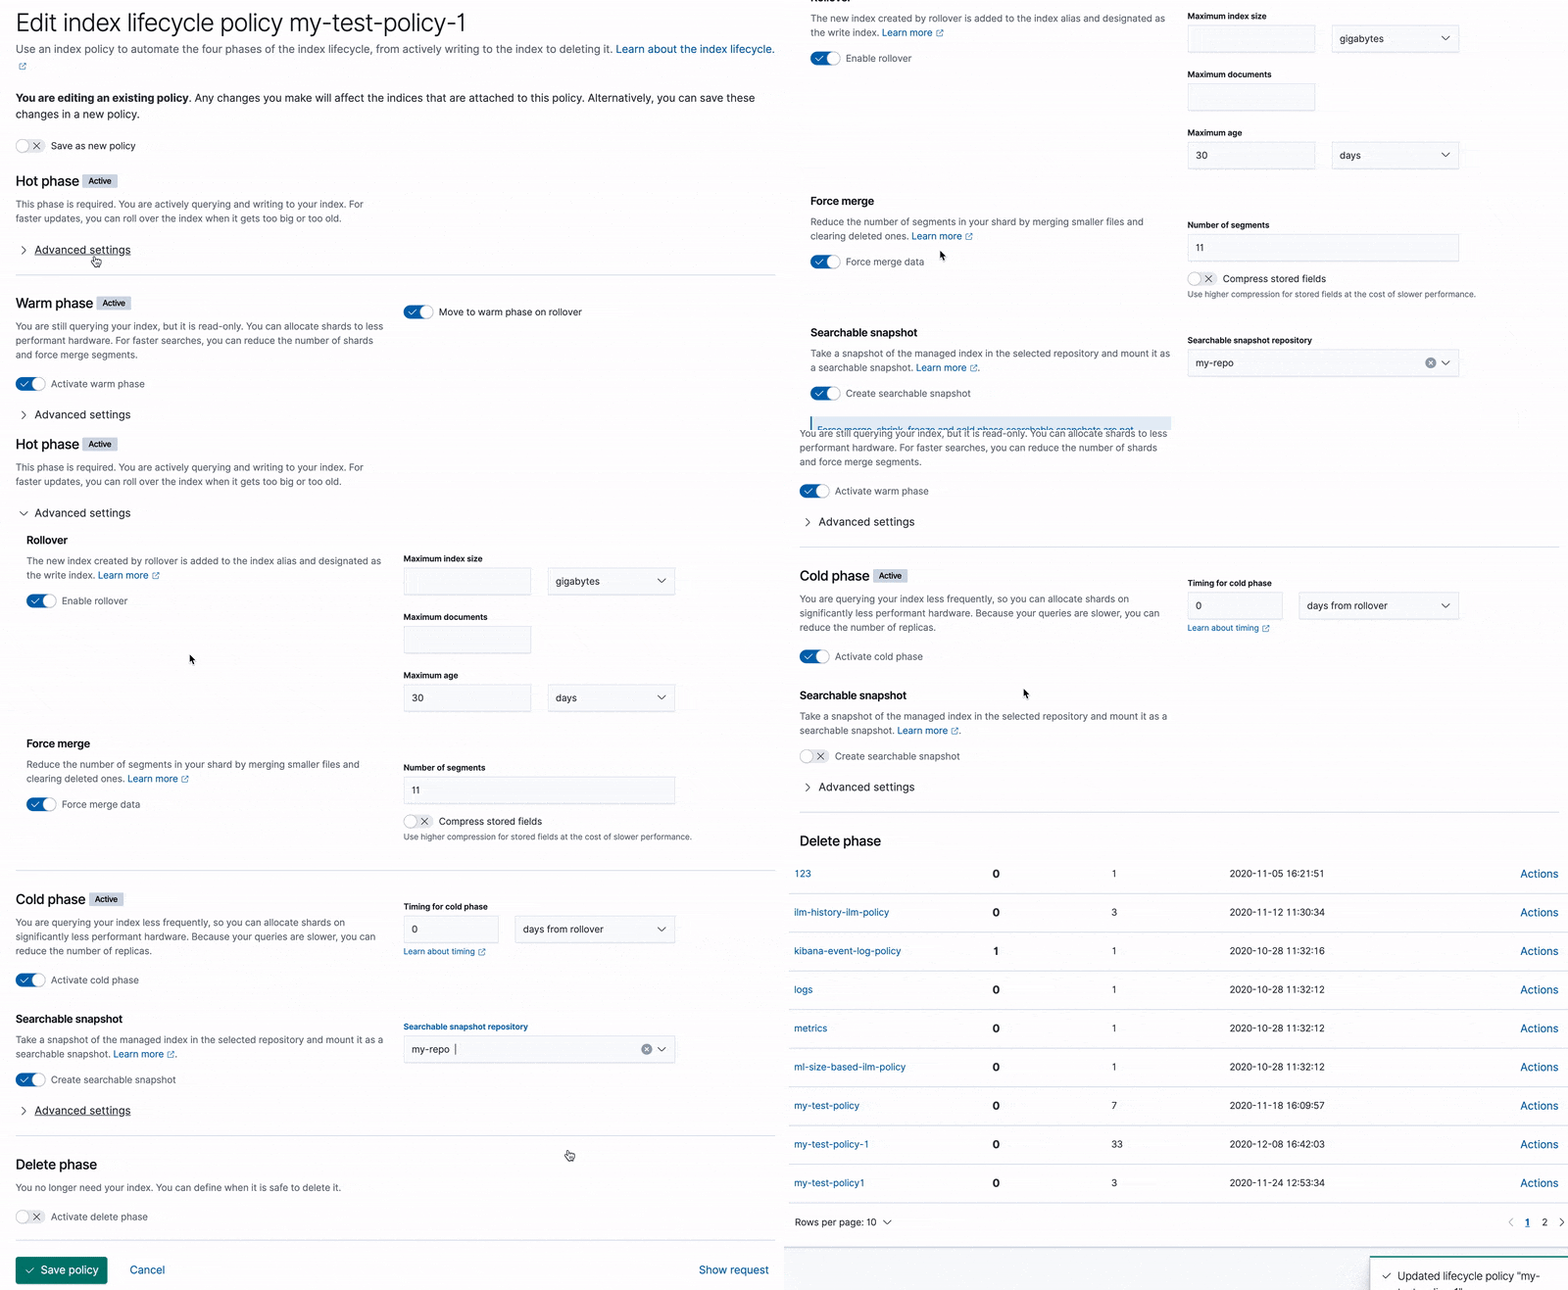
If you are a longtime user of Elasticsearch, you know that index lifecycle management has come a long way when it comes to moving data and having the ability to configure it within the UI. With the recent addition of data tiers and searchable snapshots, you now have the ability to configure hot and cold phases and searchable snapshots within the ILM policies UI.
Runtime fields editor in the index template
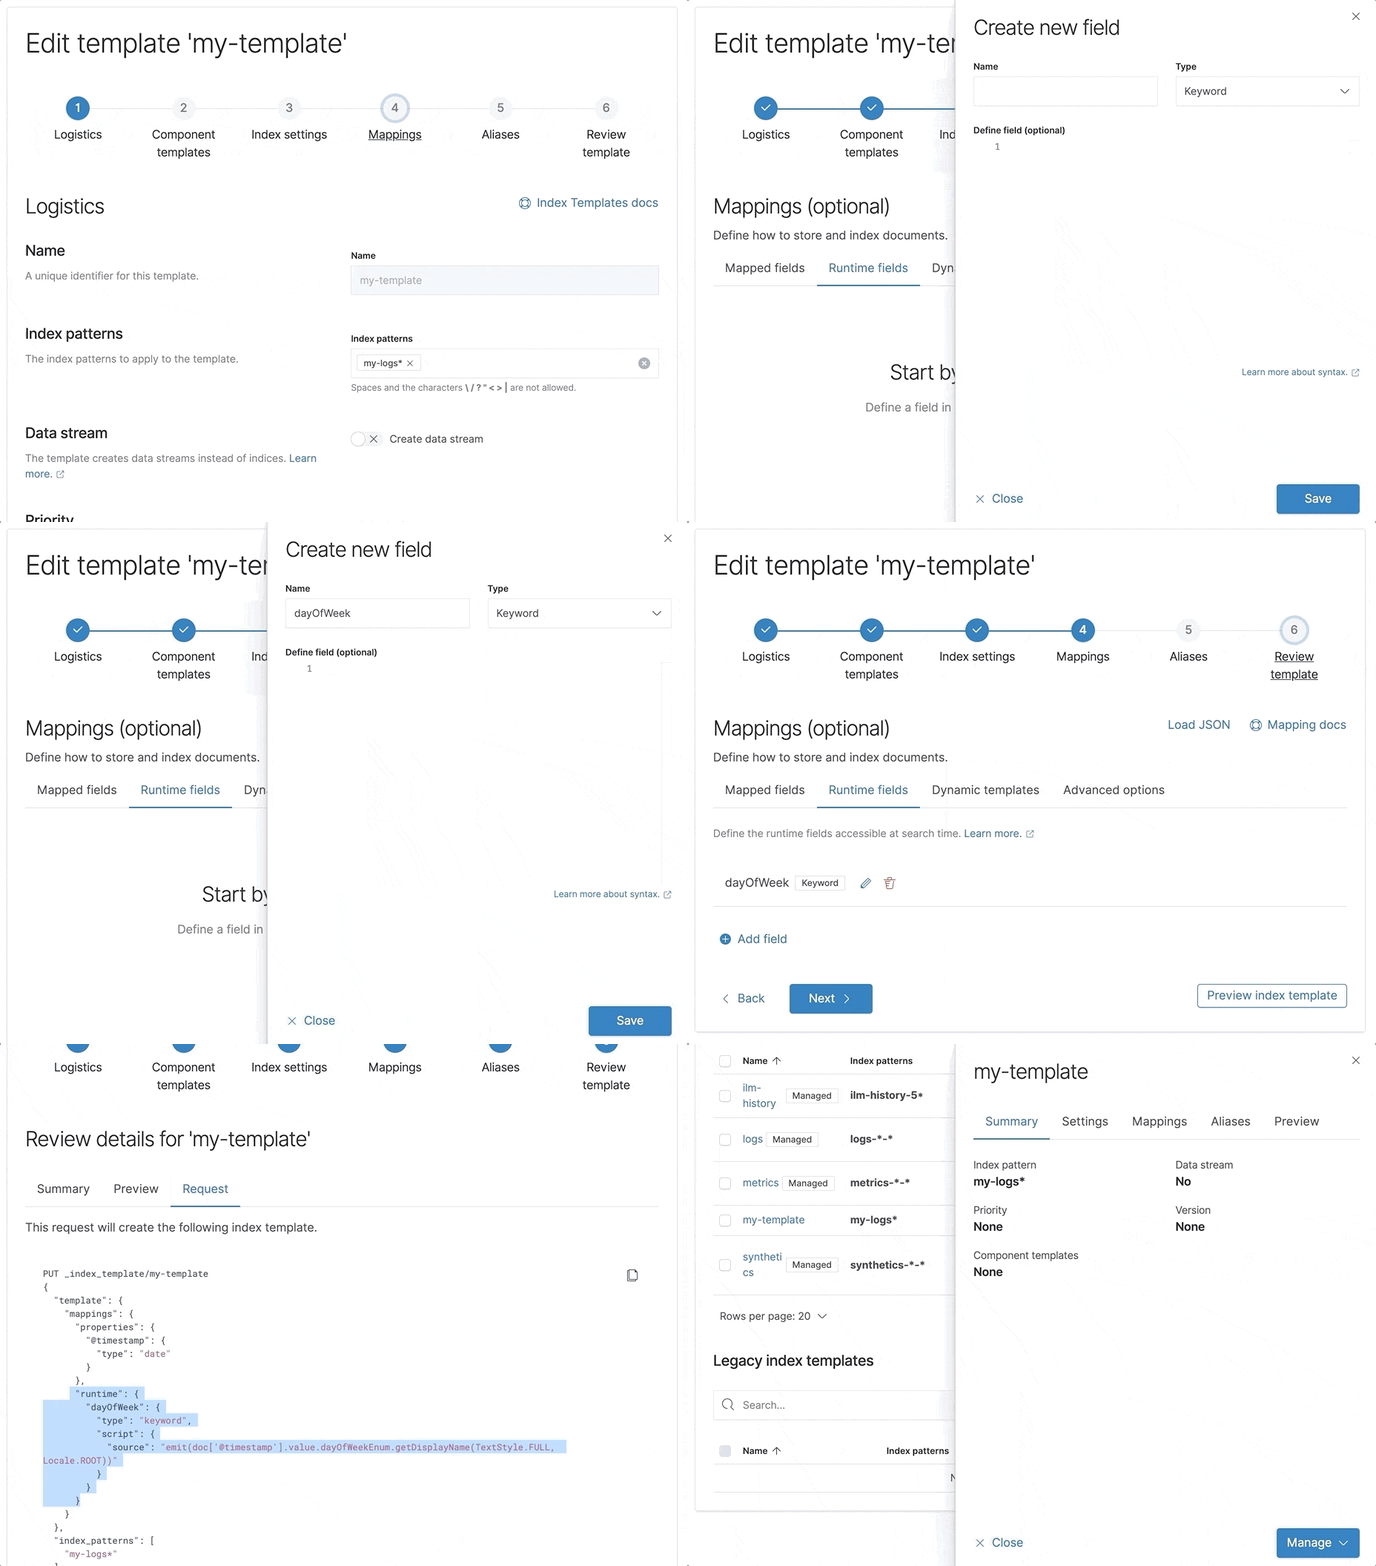
The beta release of runtime fields delivers schema on read to Elasticsearch, which opens many new workflows. One of the ways to define runtime fields is during the creation of an index template. With the index template mapping editor, you can explore the possibilities by creating and editing runtime fields in your index template mappings.
Transform adds a new type: Latest in machine learning
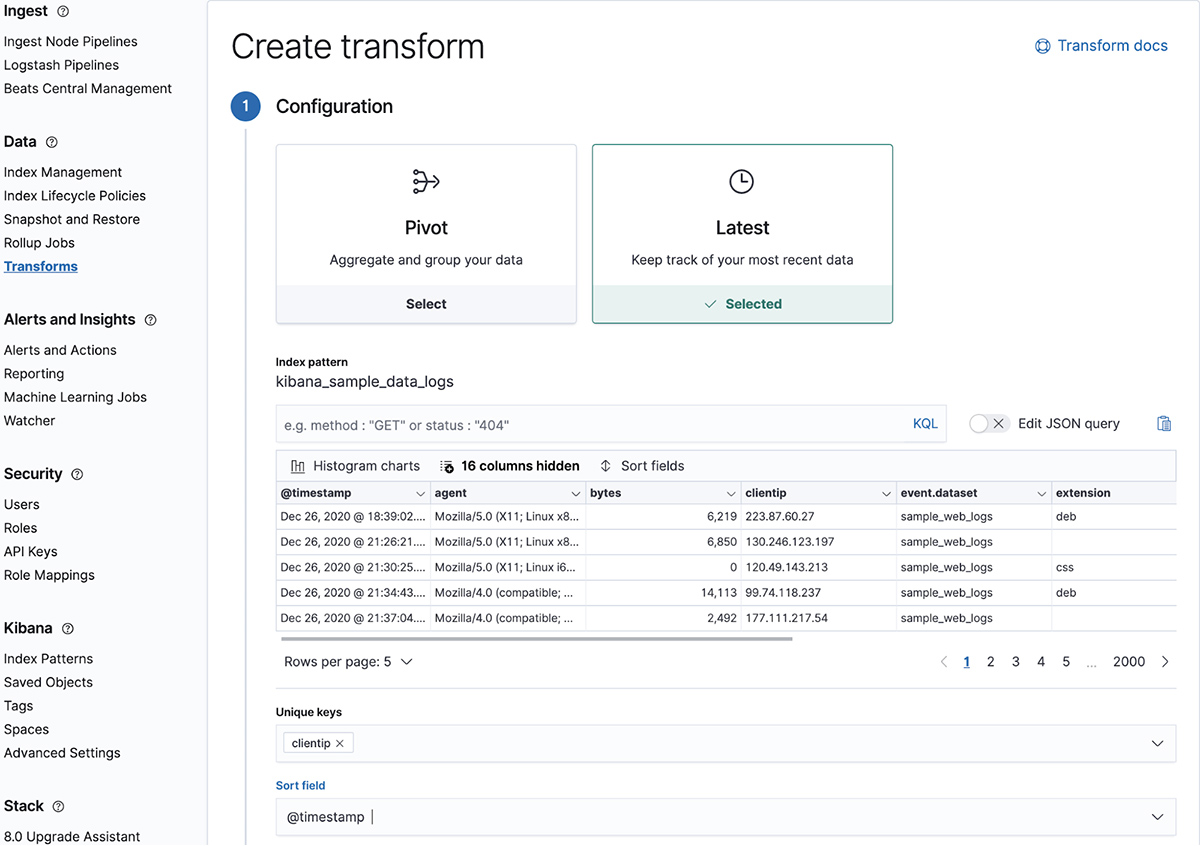
Transforms in 7.11 has added another type focused on allowing you to copy the most recent documents to a new index. This new type of Transform is called Latest and works by identifying one or more fields as a unique key and a date field for sorting, then creating an index that can be updated with the most recent document.
Scenarios where this becomes especially useful include where companies are trying to keep track of the latest purchase their customers have made or in a monitoring setting where tracking the latest event coming from a host is critical.
That's all folks…
7.11 is another monumental release for Elasticsearch, and we couldn't cover all of it within this blog. Be sure to check out more in the release highlights.
Ready to get your hands dirty and try some of the new functionalities? Spin up a free 14-day trial of Elastic Cloud or download Elasticsearch today. Try it out and be sure to let us know what you think on Twitter (@elastic), in our forum, or join us on our community slack channel.
