Play: Modernizing telecommunications with the Elastic Stack
The telecommunications world is in the middle of its fourth industrial revolution. Organisations are trying to bring out as many new services as possible to monetise their infrastructure, but despite their modern approach, they still own and maintain legacy — and most importantly — multi-vendor infrastructures. Due to complex organisational structures and decentralised management systems, most responsibilities are divided between multiple departments. This means that operational departments experience difficulties due to siloed information and lack of communication.
Lack of access to data prevents teams from reacting to issues quickly, which can impact their relationship with subscribers. Many operators have already realised the need to pursue unification of operational data and improvement in issue detection at speed and scale. Otherwise customer attrition is unavoidable.
In an environment like this, there is a very important need to bring everything into one unified picture. This centralisation of data is foundational to AIOps, and it enables telecommunication teams to remove access barriers and improve analysis speed within their stored data. Elastic Observability can help telco companies do this by seamlessly fitting into an existing ecosystem and creating a unified view of their data.
In this blog post, we'll take a look at how Play — the biggest mobile operator in Poland — did just this with the Elastic Stack.
Playing with Elastic
Play has successfully optimised its operational workforce with thorough planning and data-driven operations. They've created a transport network management model that is built on data normalisation and unification between vendors and network elements. This unification creates a great source of data for further analysis. Without advanced data analytics tools, Play had limited visibility into issues, which is very important for resolution.
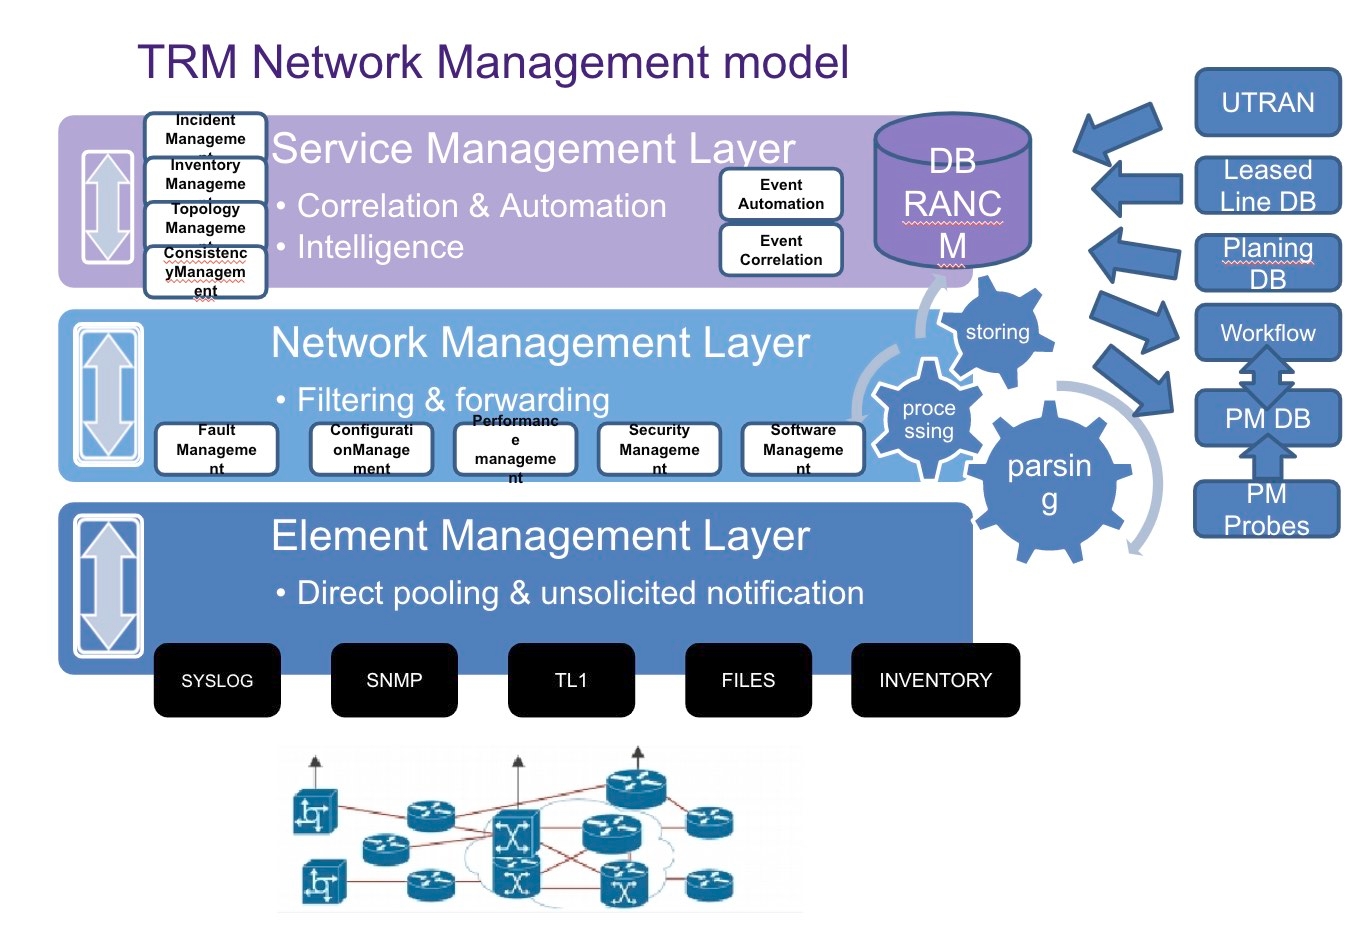
With this new model, it turned out that the core foundation was almost entirely built already. The only new additions were 1) the data ingest layer, which required slight reorganisation and denormalisation to make it ready for future, and 2) the unified datastore for analysis. With its lightning speed and nearly limitless scalability, Play decided on the Elastic Stack as the core for data analysis and the extremely important visualisation layer.
Let's take a look at what Play has been able to achieve with this new, unified architecture.
Radio line monitoring with Elastic
Radio lines are necessary to provide communication over vast areas where fixed line connections are not viable from an economic perspective. They provide the link between core network elements and endpoints like eNB, NodeB and BTS. They are a crucial part of infrastructure which requires the shortest possible mean time to resolution (MTTR) to ensure network quality and availability.
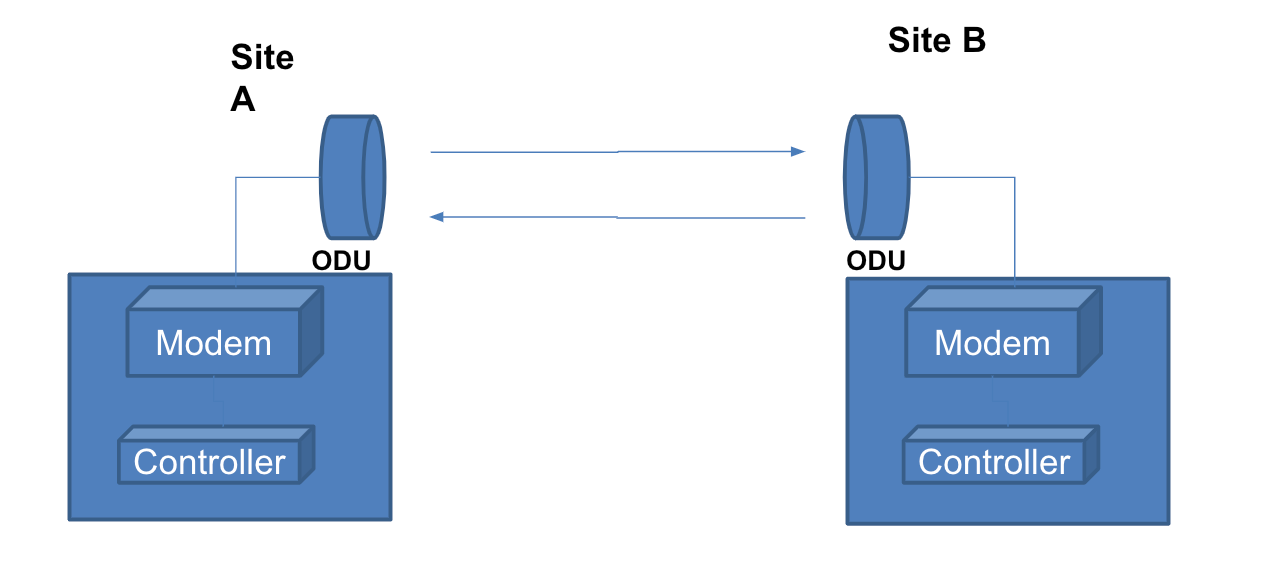
The Elastic Stack comes as an integrated suite of components, from data ingest through storage, processing and analysis to presentation and automated notification. Each stage of the data processing pipeline is designed to ensure the highest level of productivity. Let's take a look at the steps Play took to monitor their microwave links with the help of Elastic.
Data ingest: How to make it simple
One of the fastest ways to retrieve data from a complex system and ingest it into the Elastic Stack is through database integration. Teams usually have expertise in SQL, so it is fairly easy to write the necessary queries. Relational database management systems (RDBMS) also enable customers to create views on data and make enrichment (joins) on the SQL level. Play’s infrastructure (transmission infrastructure) data is stored in a RDBMS in curated form, so it was relatively straightforward to load it into the Elastic Stack.

Data enrichment: Why is it so important?
Most of the available systems provide a limited view, as they are specialised in one area. Today, system capability enables organisations to store much more data and, most importantly, process it faster. It is possible to merge multiple domains like planning, inventory management, performance management, fault management, configuration management, software management and environmental monitoring.
Having all information in a single space enables entirely new analytical possibilities, leading to much faster issue resolution and new discoveries.
Areas of interest that can be covered are:
- Understanding the influence of multiple factors on observed measurements
- The contribution of human factors to error rate
- Understanding network element performance by element type, vendor, location, type of installation
- The contribution of weather and environmental conditions to measurements
- Overview of the platform and surrounding systems and connections
- Much faster problem source identification
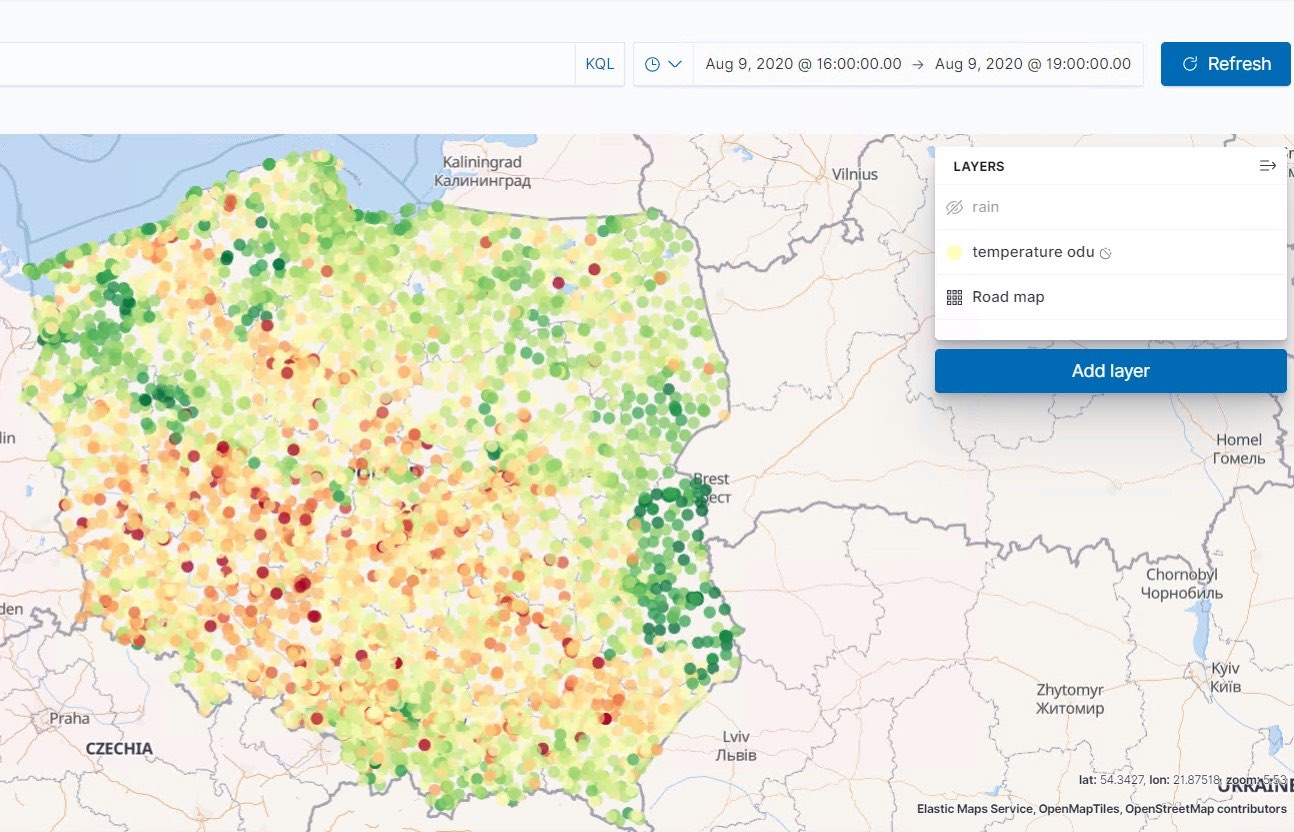
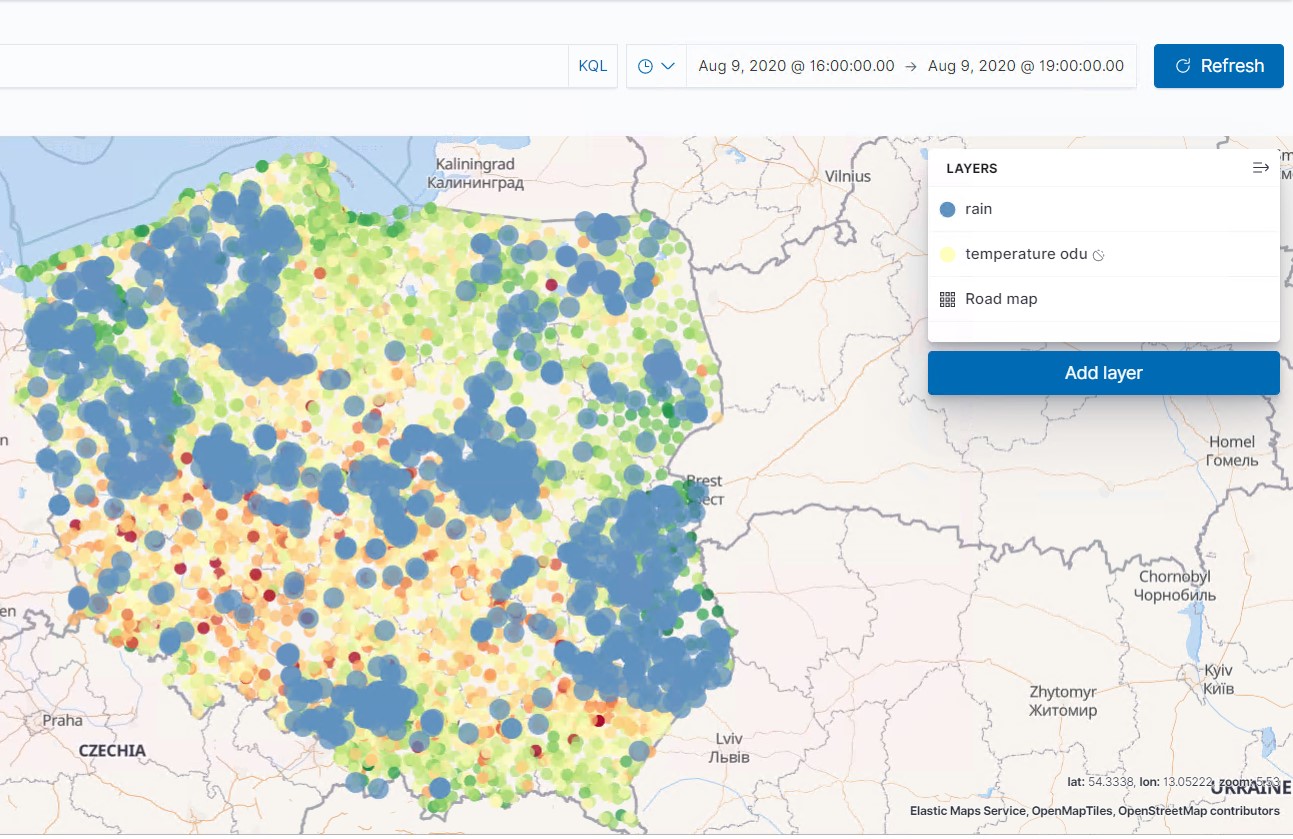
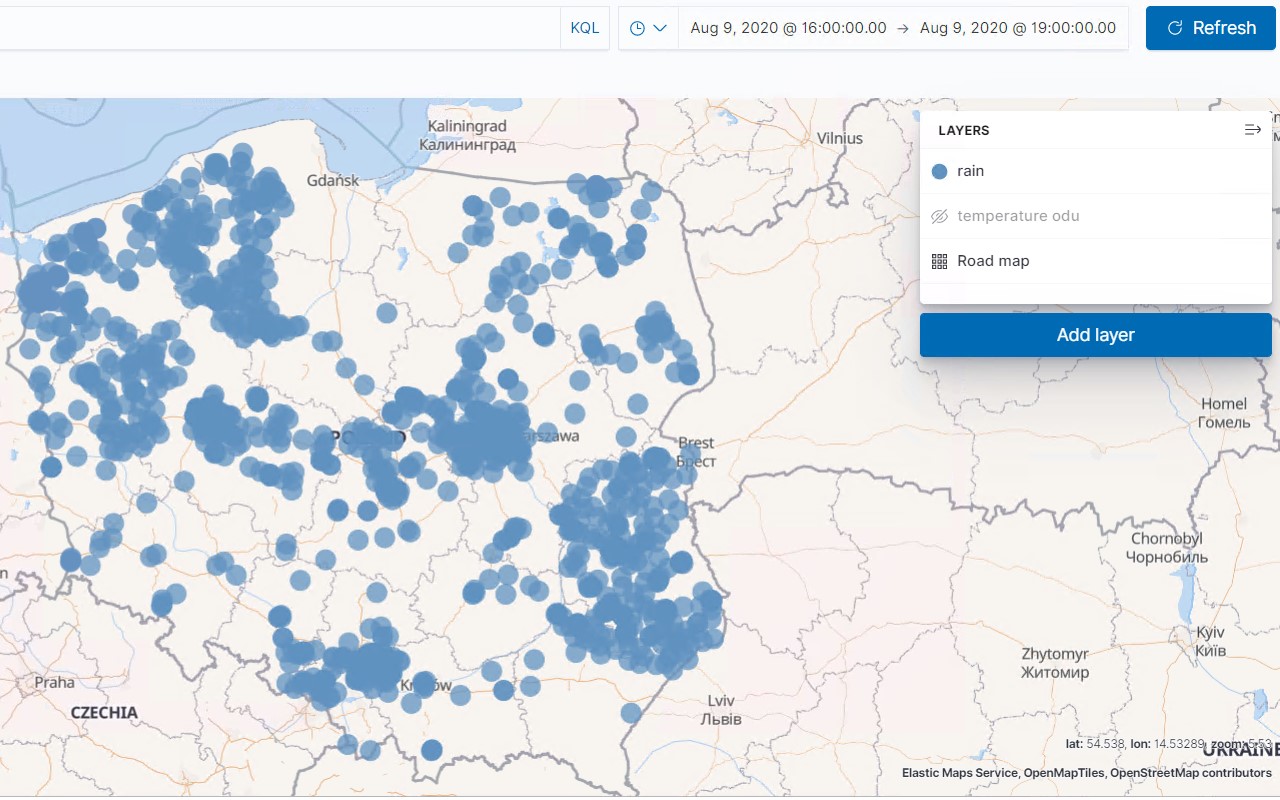
Another aspect of this attitude is that it helps to find hidden information in existing data sets that were previously unknown ("unknown unknowns"). A good example is calculating temperature changes in the time domain, which can give information about rapid changes that in turn can point to rainfall in certain areas. Rain has a high impact on radio transmission links, but it is a temporary phenomenon. From an operations point of view, this information should be filtered out so as not to disturb decisions about real and durable failures. On the other hand, being able to see link performance during rain is a good filter for optimisation analysis.
This is alternative and quite precise (temperature taken at exact point of interest) information which can be a good filter for machine learning processes.
Unified storage and processing
Elasticsearch is the core of the Elastic Stack, and it's used to store and analyse data. It can store any type of data, making it the perfect observability tool. It enables users to answer all possible questions based on all their data set: transport, RAN, HW, planning, CP, PM, environment, physical structures, topology subcontractors, and more.
The Elastic Stack enables users to combine various types of data, including static and time series data. This, along with shared features for various types of data, provides a wide range of analysis and presentation possibilities. By applying this new paradigm, users will see much more and much faster, which affects the convenience and speed of troubleshooting.
Data presentation: Where analysis meets visualisations
Play’s transmission infrastructure is distributed across vast areas. Being able to automate failure detection processes accelerates problem resolution.
Automated incident detection using machine learning
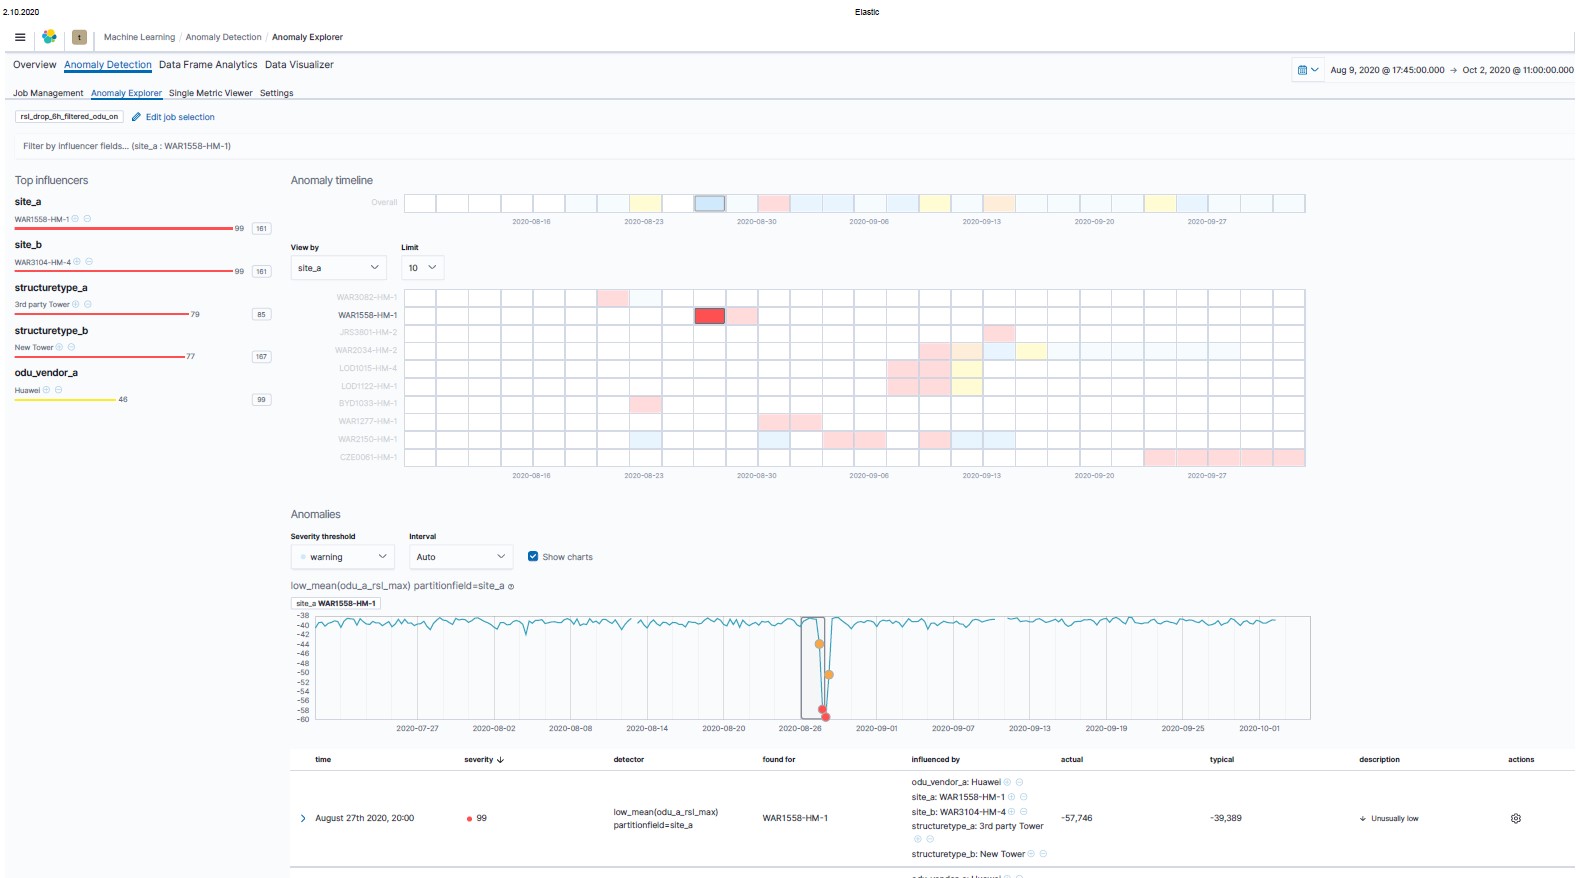
Anomaly detection in the Elastic Stack provides unsupervised methods to find all data points that can be used to indicate a problem. Analysis is spread across all radio links (thousands analysed at the same time). No static rules have to be set — it just requires a simple job to be set for all entities at once, which only takes about 3 minutes. Further analysis can be done immediately after detection and notification through a link between anomalies and user-defined dashboards. This dashboard view is limited to time and entity (influencer) involved in the anomaly.
The screenshot below shows an anomaly detection dashboard indicating significant anomalies in RSL (received signal level). RSL defines link quality; a signal that is too low causes communication problems.
Anomaly explanation with custom-built dashboards
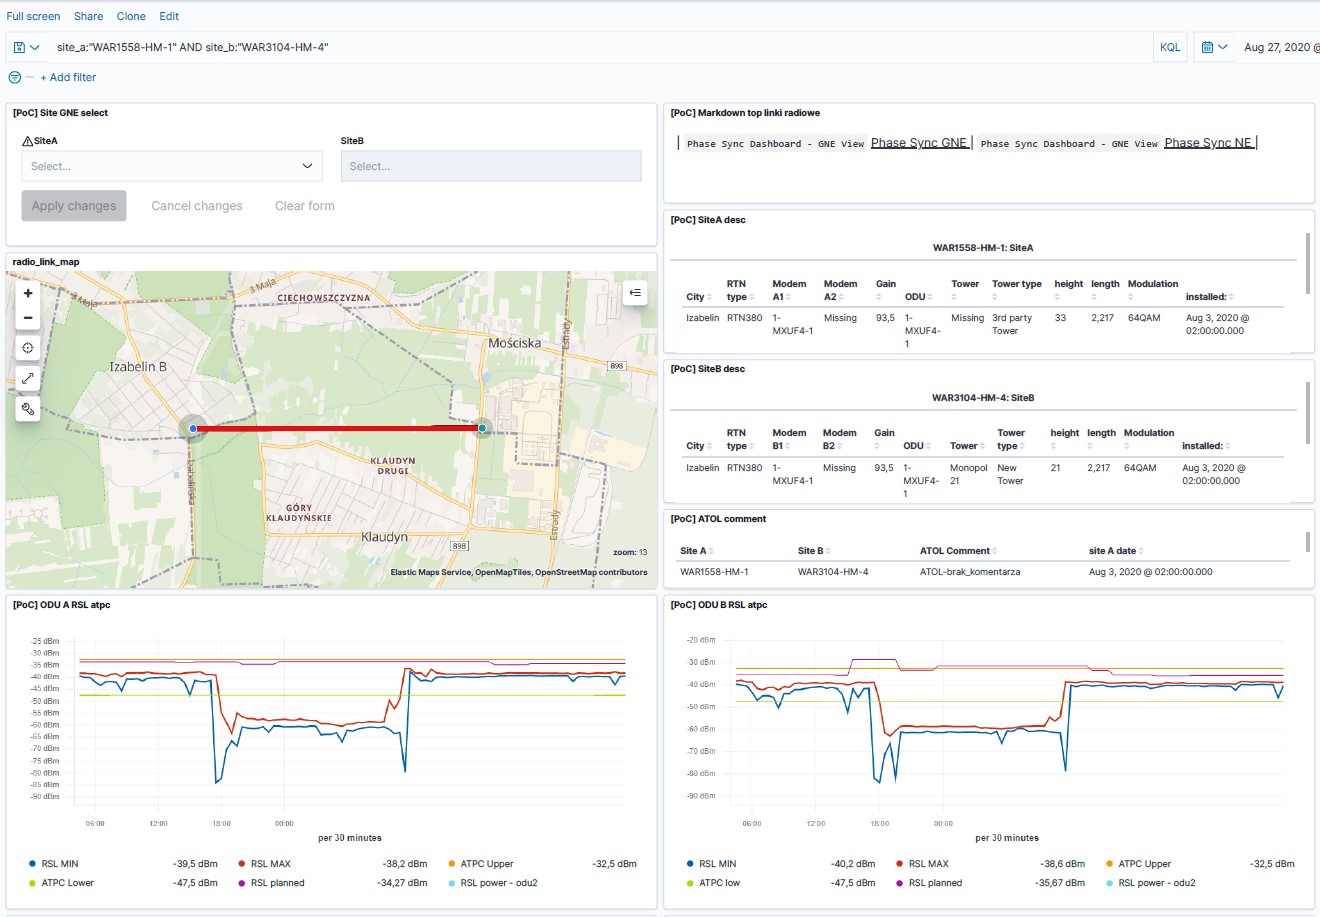
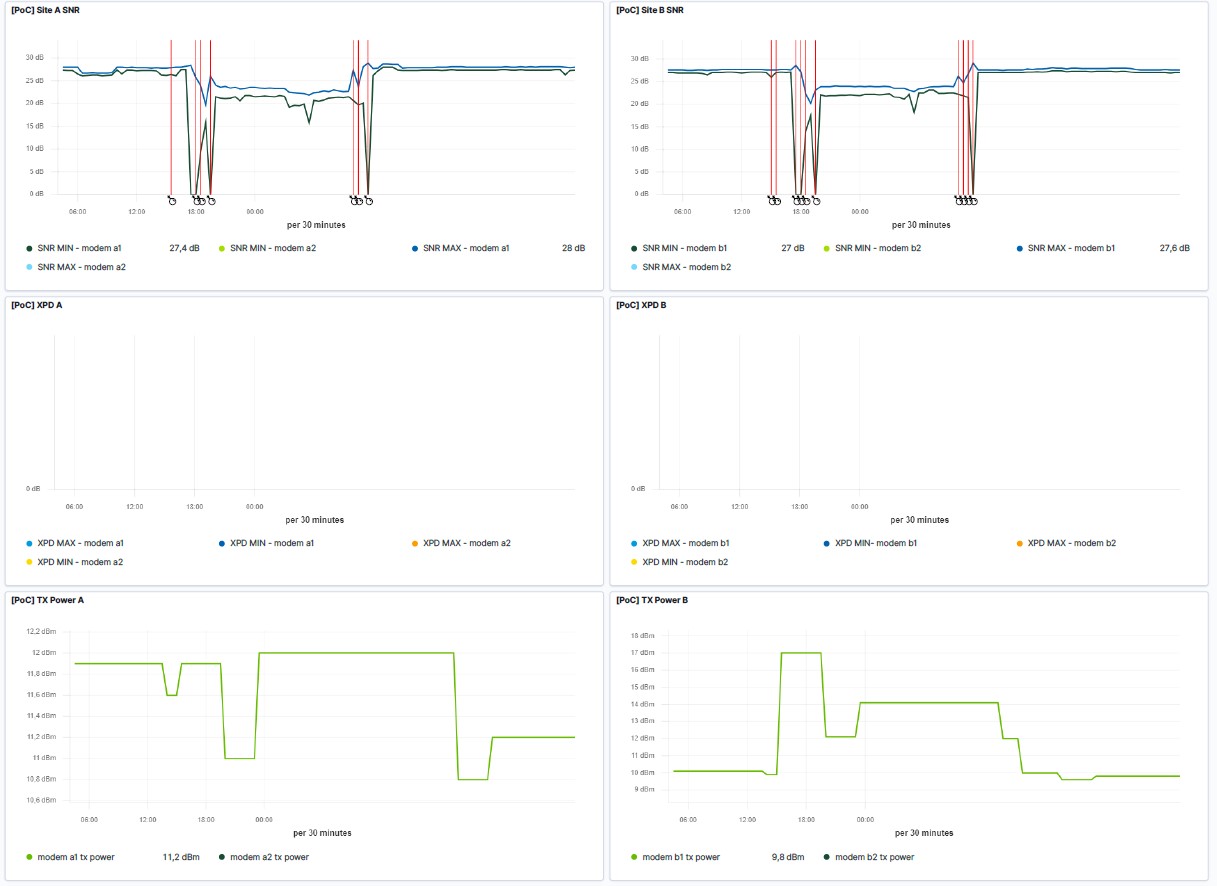
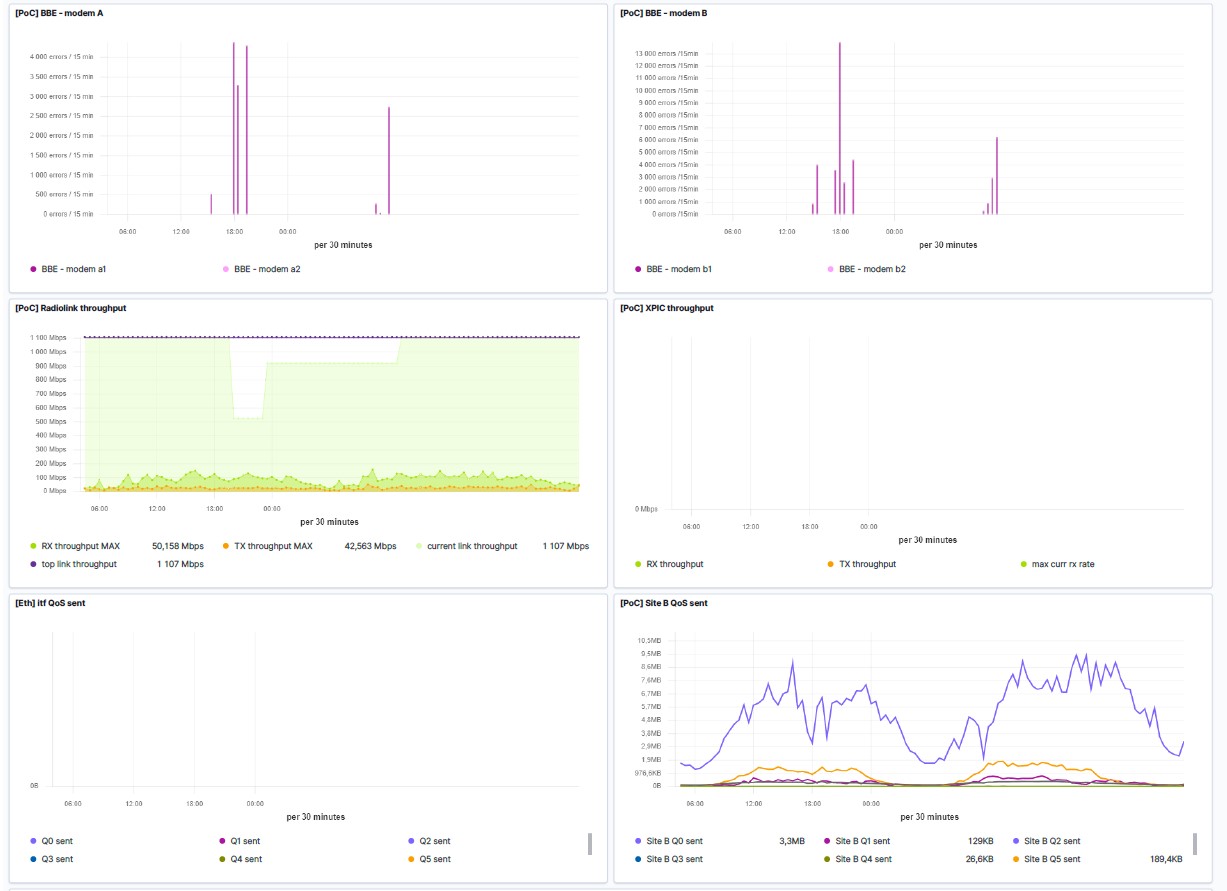
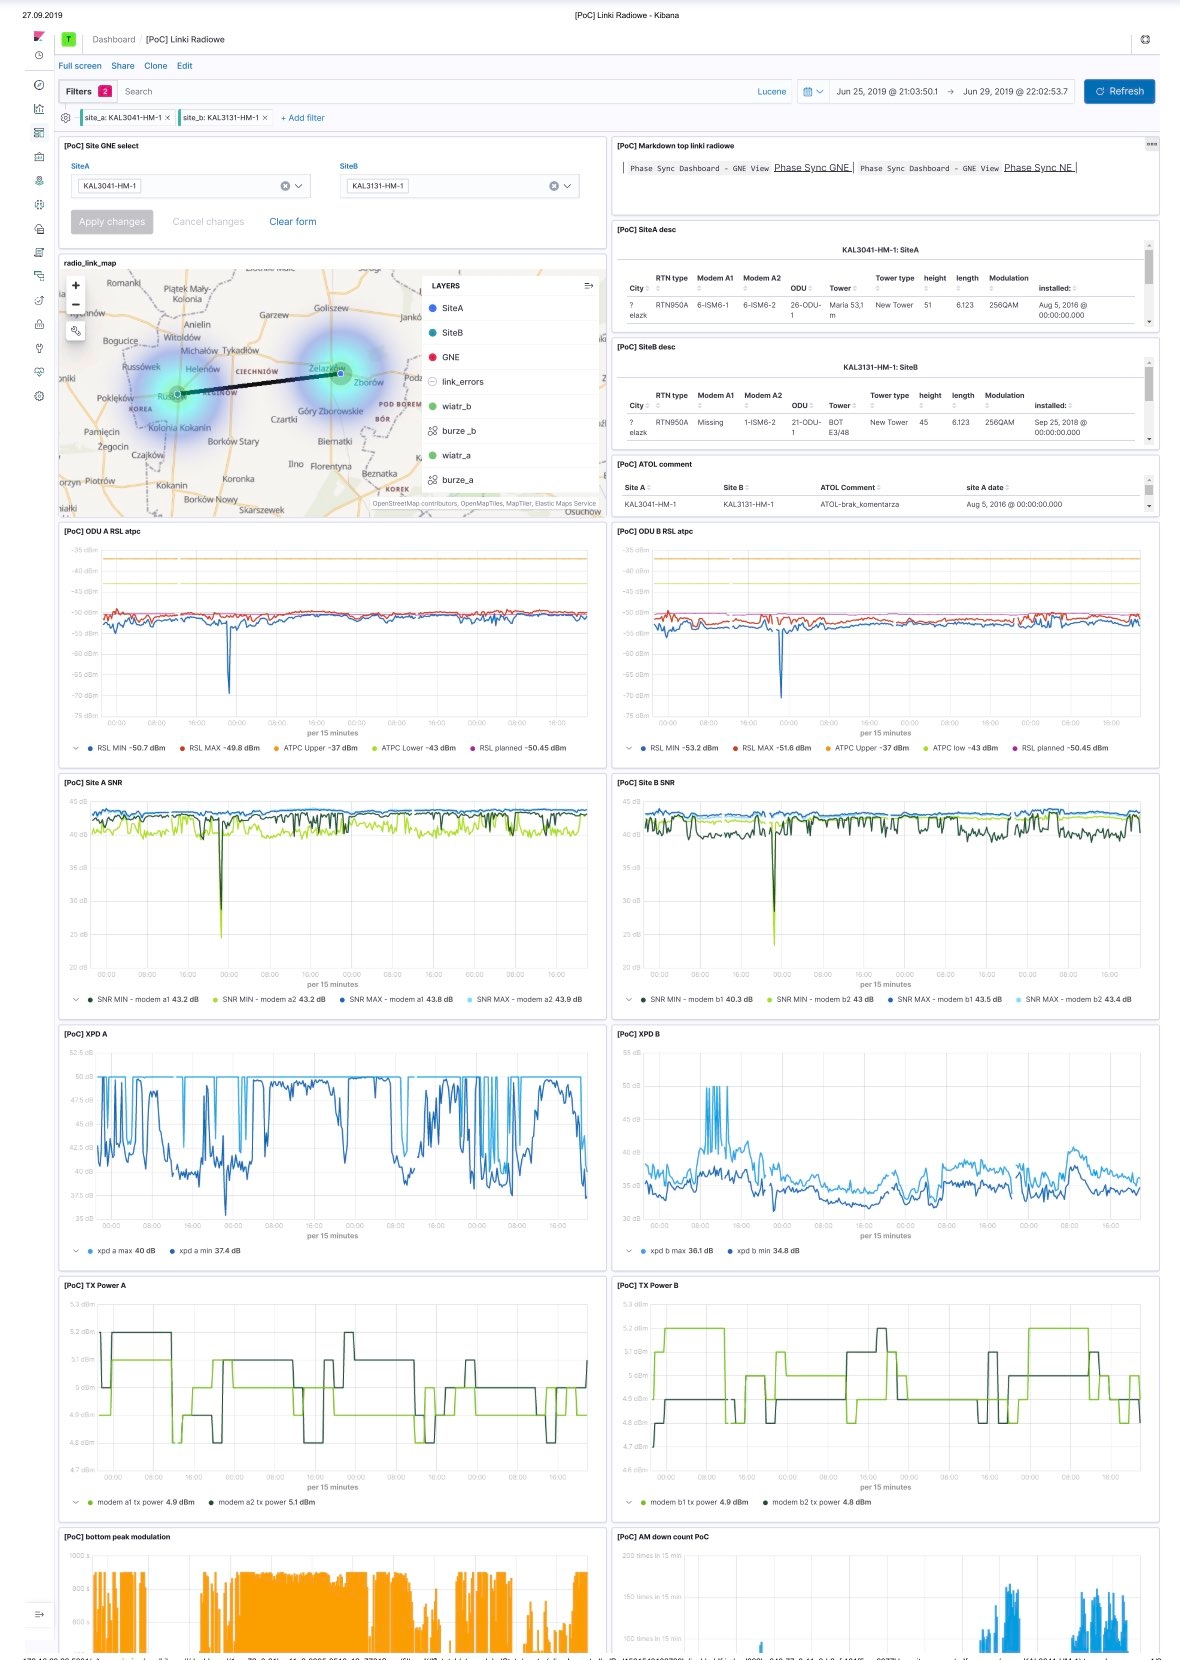
Anomalies can be explained further using a direct link between the anomaly detected and a dashboard. Most importantly, the dashboard shows the exact time and device that is experiencing a problem. The dashboards below show how such visualisations can present a very informative overview. They can present static inventory data such as:
- Radio line settings
- Installation type: tower type, height
- ODU and modem type
- Date of installation
- Geographic location
As well as dynamic parameters such as:
- RSL
- Calculated planned RSL
- SNR
- QOS
- Modulation
- Throughputs
- Link capacity
- Current link capacity calculated from modulation
- Errors
Geo visualisations
Elastic Maps enables users to overlay information such as wind, temperature, rain, storms and humidity. Being able to visualise this geospatial data is very useful for monitoring radio line behaviour:
Conclusion
Play has used the Elastic Stack to significantly reduce the time required to set up and provision rules for problem detection. With Elastic, Play can identify anomalies in their high-scale infrastructure with minimal effort, and visualisations are instantly available. This enables the operations team to identify, target and report problems in minutes.

Bartłomiej Podleś is a Transmission Operations Manager at Play. He has used his 20 years of industry experience to set up RAN and Transmission operations team at Play from scratch. With expertise across optimal telco technological processes, including creating long term maintenance software, he is currently focused on cross-domain preventive maintenance solutions based on big data and machine learning for zero-touch/self-repairing processes for network maintenance. He is also an aficionado of vintage Japanese motorcycles!