Monitoring Applications with Elasticsearch and Elastic APM
What is Application Performance Monitoring (APM)?
When talking about APM, I find it helpful to talk about it in the same breath as the other facets of "observability": logs and infrastructure metrics. Logs, APM, and Infrastructure Metrics make up the observability trifecta:
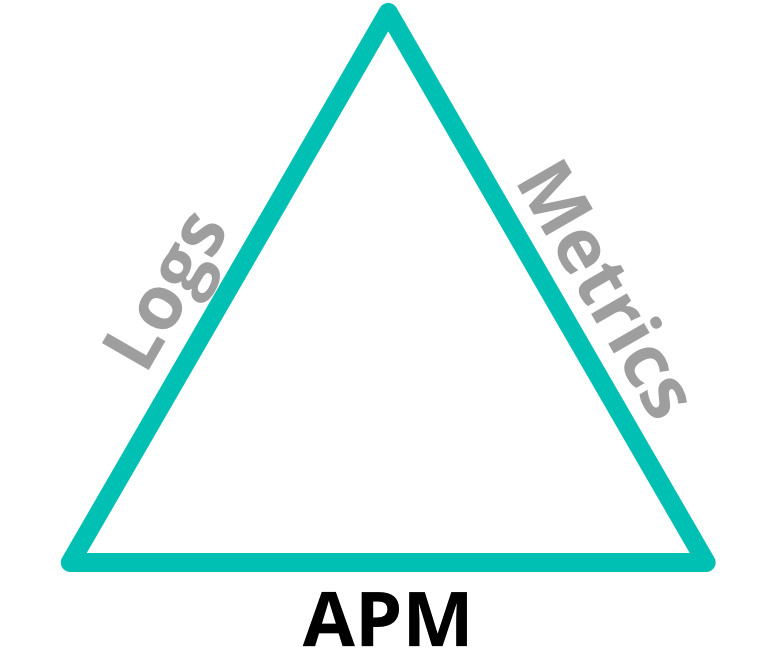
There is overlap in these areas — just enough to help correlate across each of them. The logs might indicate that an error occurred, but perhaps not why. The metrics might show that CPU usage spiked on a server, but not indicate what was causing it. So when we use them in concert, we can solve a much more broad set of problems.
Logs
First, let's dig into some definitions. There is a real subtle difference between logs and metrics. In general, logs are events which are emitted when something happens — a request is received and responded to, a file was opened, a printf was encountered in the code.
For example, a common log format comes from the Apache HTTP server project (fake, and trimmed for length):
264.242.88.10 - - [22/Jan/2018:07:08:53 -0800] "GET /ESProductDetailView HTTP/1.1" 200 6291
264.242.88.10 - - [22/Jan/2018:07:08:53 -0800] "POST /intro.m4v HTTP/1.1" 404 7352
264.242.88.10 - - [22/Jan/2018:16:38:53 -0800] "POST /checkout/addresses/ HTTP/1.1" 500 5253
Logs still tend to be at the component level, rather than looking at the application as a whole. Logs are nice in the respect that they are typically human readable. In the example above, we see an IP address, a field that is apparently not set, a date, the page the user was accessing (plus the method), and a couple of numbers. From experience, I know that the numbers are the response code (200 is good, 404 is not as good but better than a 500), and the amount of data returned.
Logs are handy because they are usually available on the host/machine/container instance running the corresponding application or service, and, as we see above, they are somewhat human readable. The downsides of logs tie into their very nature: if you don't code it, it won't print it. You explicitly have to do something equivalent to puts in Ruby, or system.out.println in Java to get it out there. Even if you do that, formatting is important. The Apache logs above have what looks like a weird date format. Take the date "01/02/2019" for example. To me (in the United States), that's January 2nd, 2019, but to a good number of folks reading this I bet it's February 1st. Think about things like that when you format logging statements.
Metrics
Metrics, on the other hand, tend to be periodic summaries or counts — in the last 10 seconds, the average CPU was 12%, the amount of memory used by an application was 27MB, or the primary disk was at 71% capacity (at least mine is, I just checked).
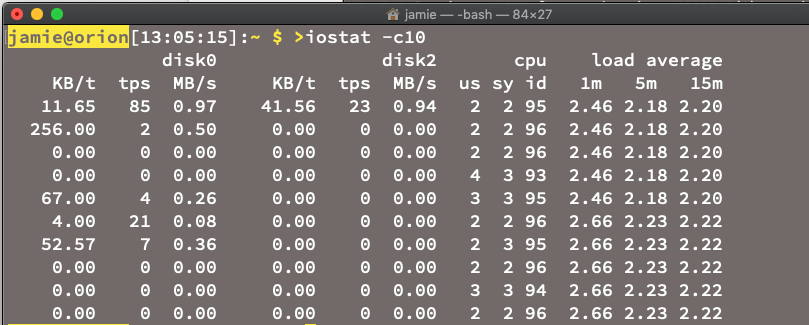
Above is a screenshot of iostat running on a Mac. That's a lot of metrics in there. Metrics are useful when wanting to show trends and history, and they excel when trying to create simple, predictable, reliable rules to catch incidents and anomalies. One problem with metrics is that they tend to monitor the infrastructure layer, grabbing data about the component instance level — things like hosts, containers, and network — rather than the custom application level. Because metrics tend to be sampled over a period of time, brief outliers run the risk of being "averaged out".
APM
Application Performance Monitoring bridges the gaps between metrics and logs. While logs and metrics tend to be more cross-cutting, dealing with infrastructure and components, APM focuses on applications, allowing IT and developers to monitor the application layer of their stack, including the end-user experience.
Adding APM to your monitoring lets you:
- Understand what your service is spending its time on, and why it crashes.
- See how services interact with each other and visualize bottlenecks
- Proactively discover and fix performance bottlenecks and errors
- Hopefully, before too many of your customers are impacted
- Increase productivity of the development team
- Track the end-user experience in the browser
One key thing to note is that APM speaks code (we'll see more on that in a bit).
Let's take a look at how APM compares to what we get from logs. We had this log entry:
264.242.88.10 - - [22/Jan/2018:07:08:53 -0800] "GET /ESProductDetailView HTTP/1.1" 200 6291
When looking at this entry initially, all seemed good. We responded successfully (200), and sent back 6291 byte — what it doesn't show is that it took 16.6 seconds, as seen on this APM screenshot:
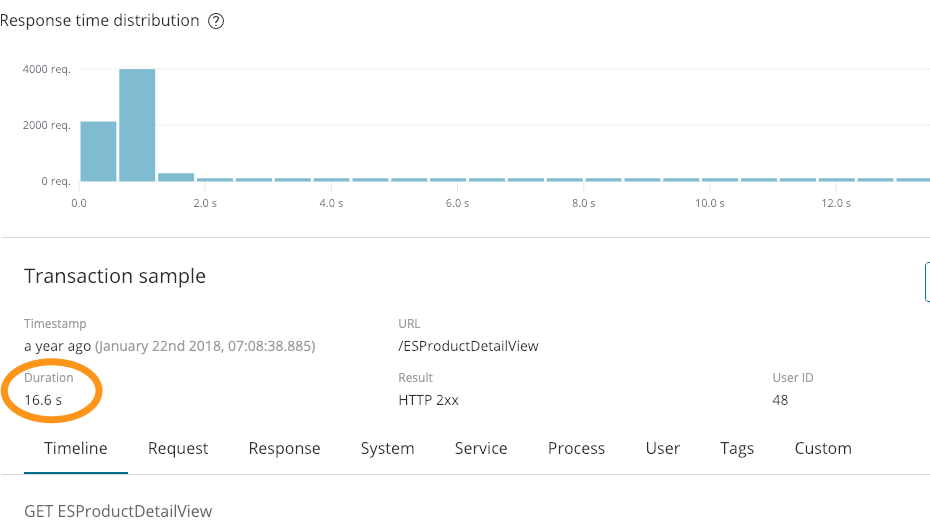
That extra bit of context is pretty informative. We also had an error in the above logs:
264.242.88.10 - - [22/Jan/2018:07:08:53 -0800] "POST /checkout/addresses/ HTTP/1.1" 500 5253
APM also captures errors for us:
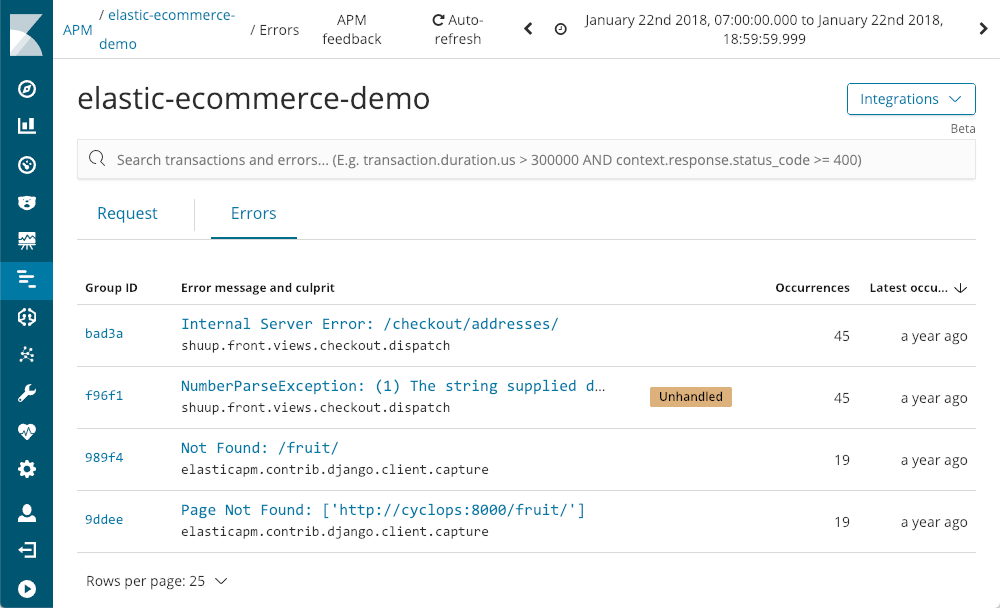
It shows us when they last happened, how often they happened, and whether or not they were handled by the application. As we drill down to an exception, using the NumberParseException as an example, we are greeted with a visualization of the distribution of the number of times that error has occurred in the window:
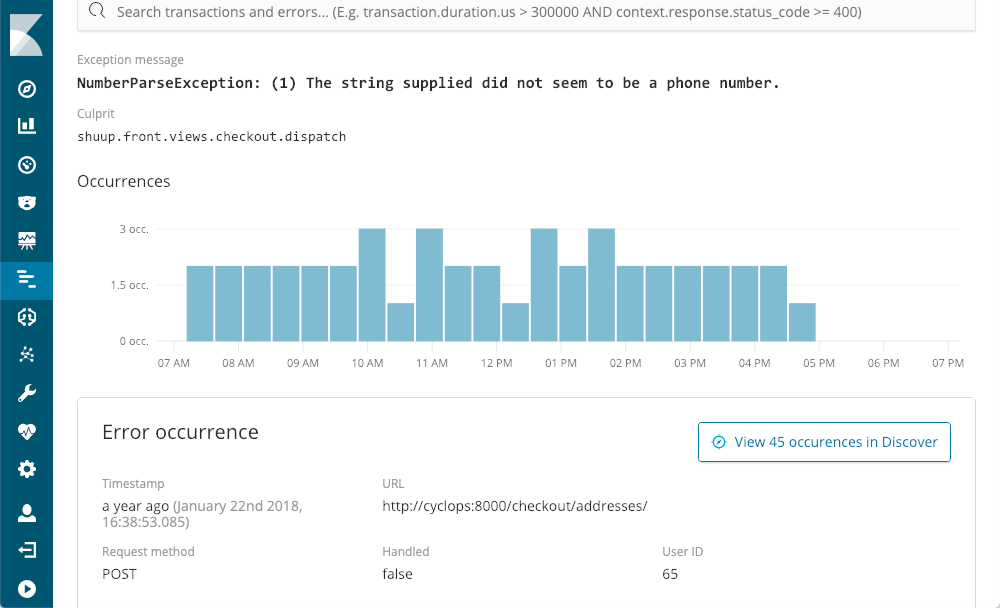
We can immediately see that it happens a few times per period, but pretty much all day. We could likely find the corresponding stack trace in one of the log files, but odds are that it wouldn't have the context and metadata that is available when using APM:
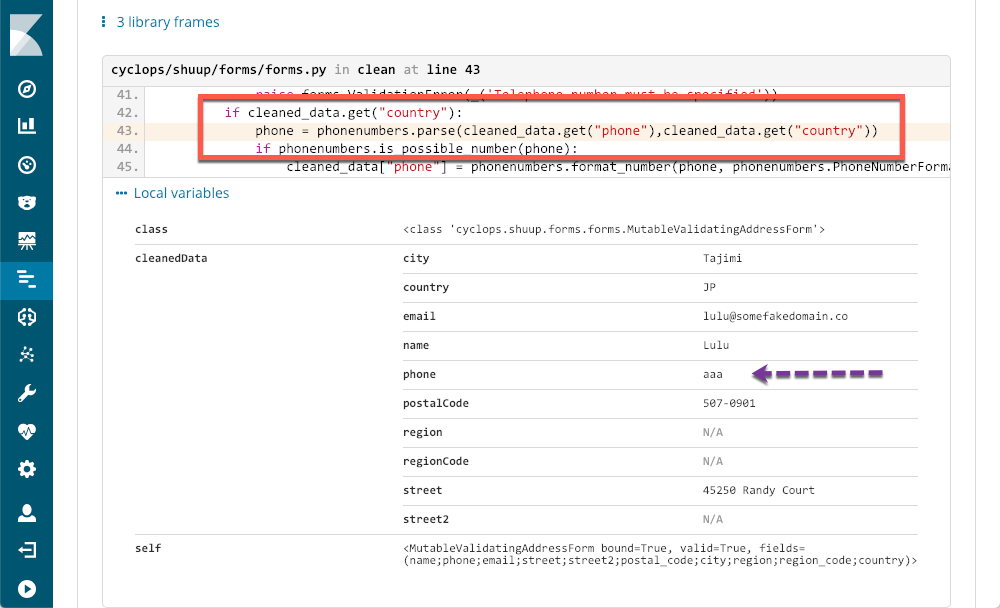
The red rectangle shows the line of code that caused the exception, and the metadata provided by APM shows me exactly what the problem is. Even a non-python programmer like myself can see exactly what the problem is, and have enough information to open a ticket.
APM Feature Tour (with Screenshots)
I can tell you about Elastic APM all day (find me on Twitter and I'll prove it), but I'm guessing you'd rather see what it can do. Let's take a tour.
Opening APM
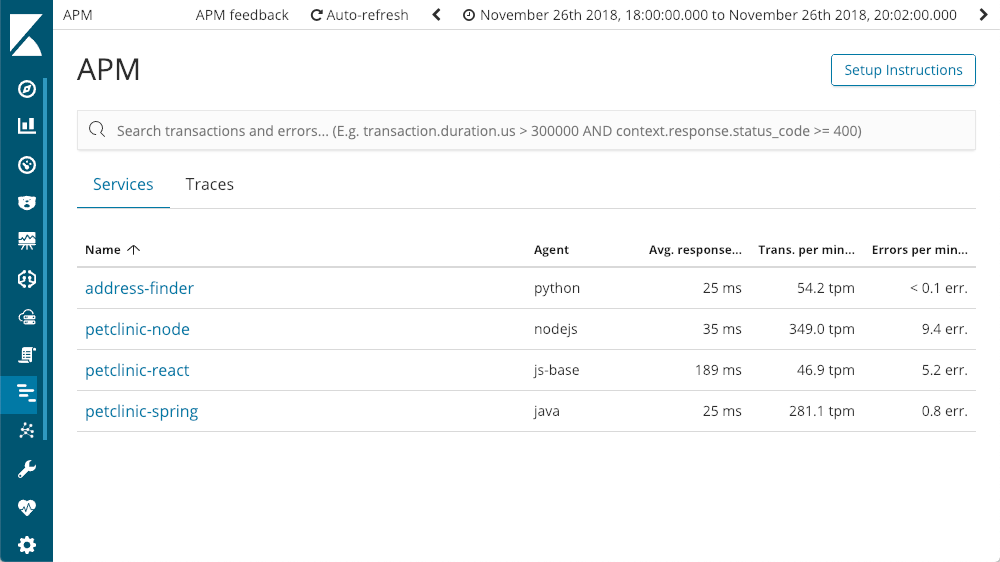
When we enter the APM application in Kibana, we see all of the services we have instrumented with Elastic APM:
Drilling into Services
We can drill down to individual services — let's try the "petclinic-spring" service. Each of the services will have a similar layout:
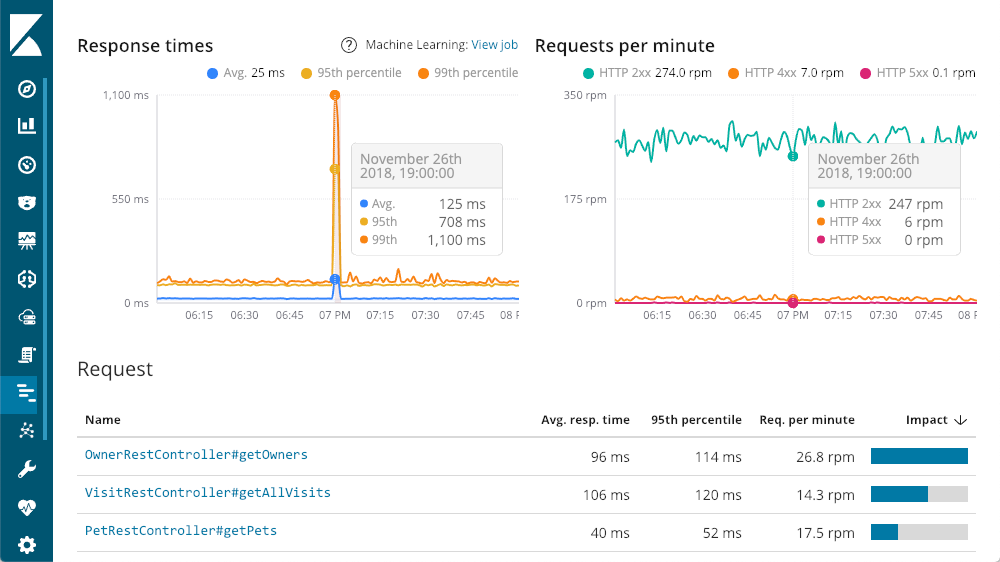
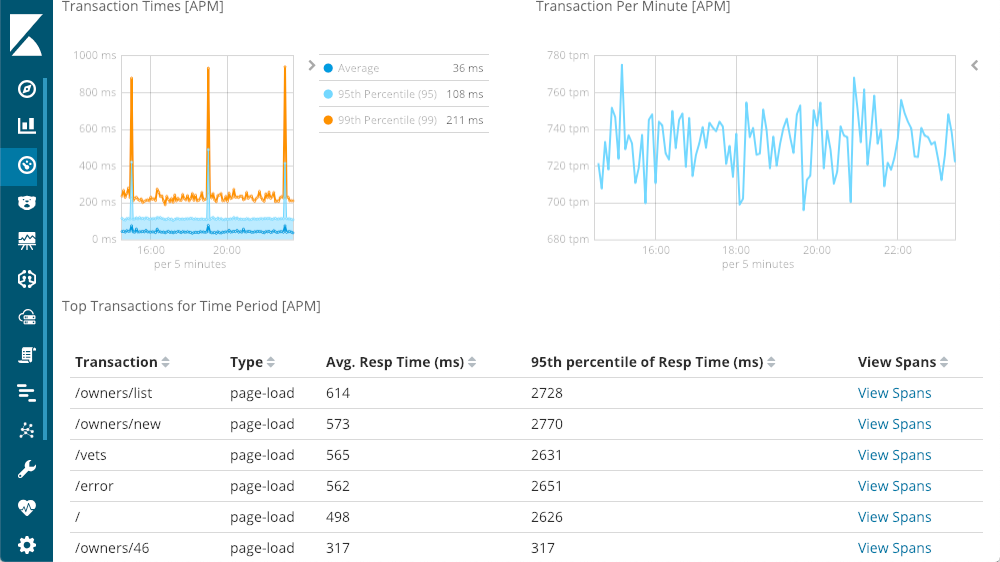
The top left gives me response times — Average, 95th, and 99th percentiles, to show me where my outliers are. We can also show or hide the various line elements to get a better feel for how the outliers impact the overall chart. The top right has my response codes - these are broken down into requests per minute (RPM), as opposed to times. As you can see in the chart, as you move the mouse over either chart you get a popup showing the summary at that point in time. Our first insight is available before we even start digging - that huge spike in latency doesn't have any 500 responses (server errors).
Drilling into Transaction Response Times
Continuing our tour of the transaction summary, we get to the bottom, the request breakdown. Each request is basically a different endpoint in our application (though you can augment the defaults using the various agent APIs). I can sort with the column headings, but I personally like the "impact" column — it takes into consideration latency and popularity of a given request. In this case, our "getOwners" seems the be causing the most pain, but it is still averaging a pretty respectable latency of 96ms. Dropping down into the details of that transaction, we see the same layout we saw earlier:
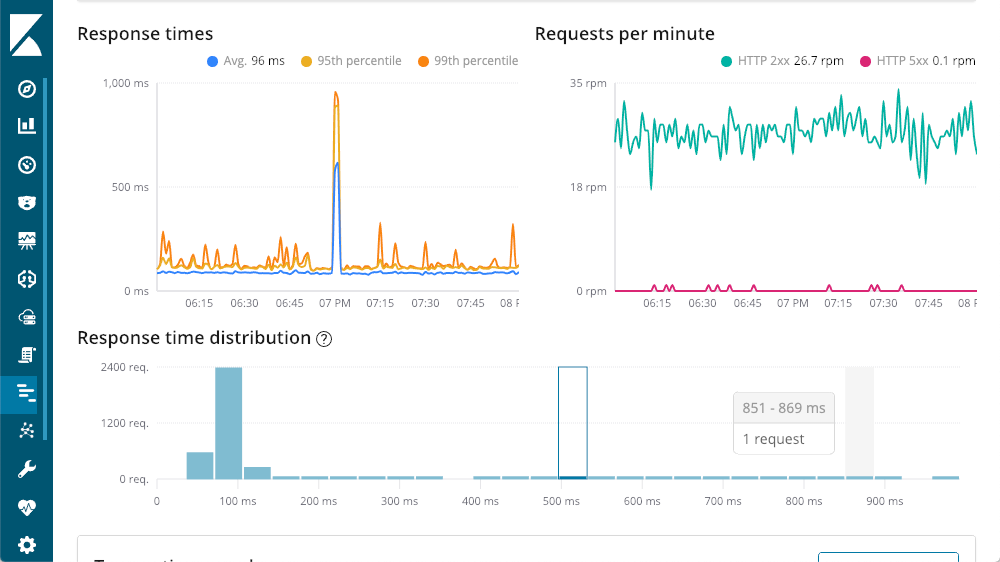
Operation Waterfall
But even the slowest requests are still less than a second. Scrolling down we have a waterfall view of the operations in the transaction:
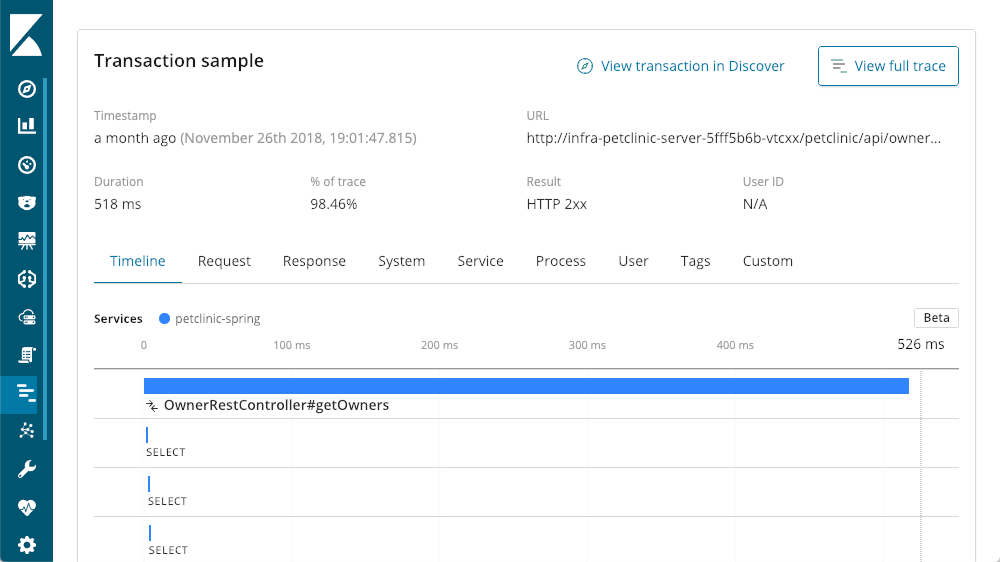
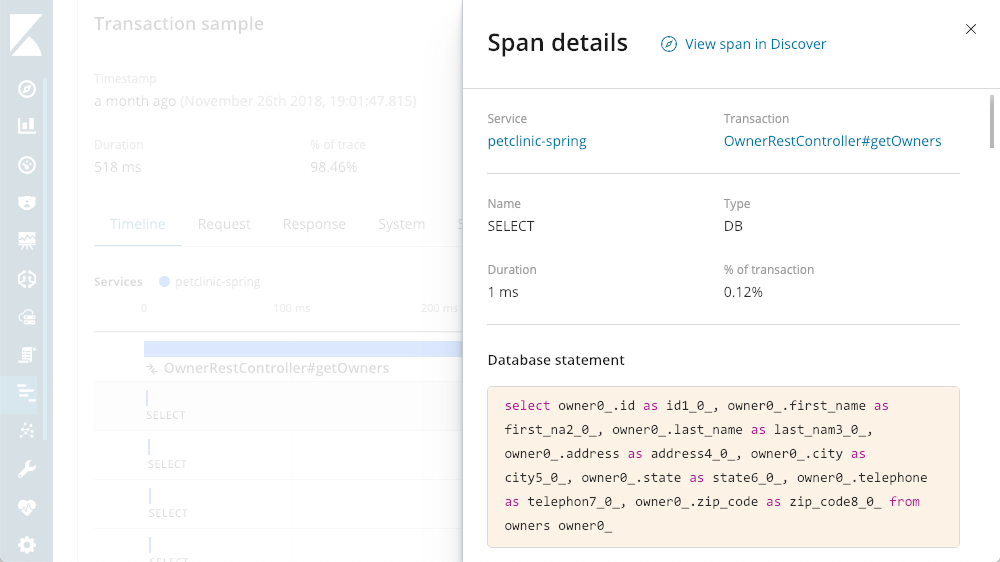
Query Detail Viewer
There sure are a lot of SELECT statements going on. With APM, I have the ability to see the actual queries being executed:
Distributed Tracing
We are dealing with a multi-tiered microservice architecture in this application stack. Since we have all of the tiers instrumented with Elastic APM, we can zoom out a bit by hitting that "View full trace" button to see everything involved in this call, showing a distributed trace of all the components which took part in the transaction:
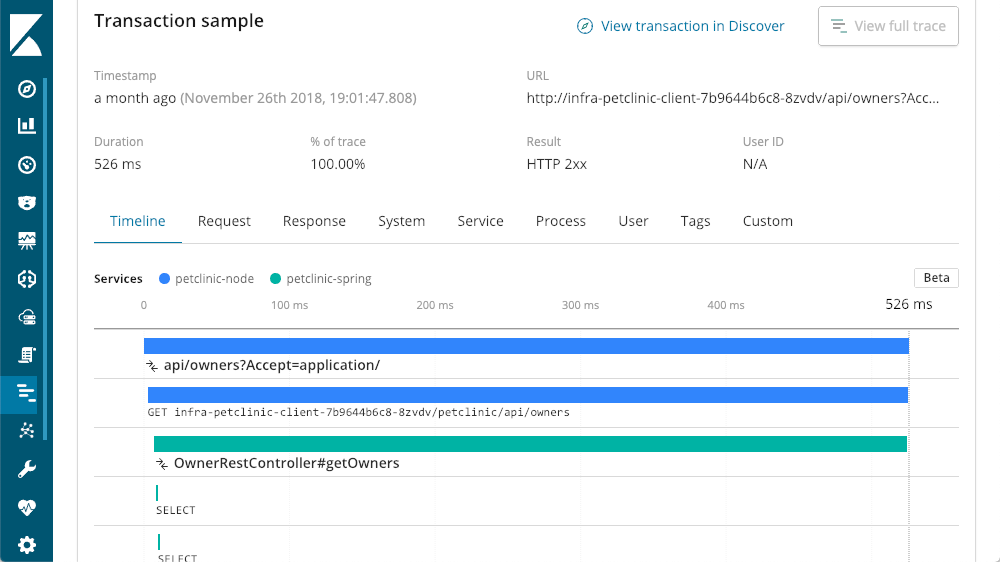
Layers of Traces
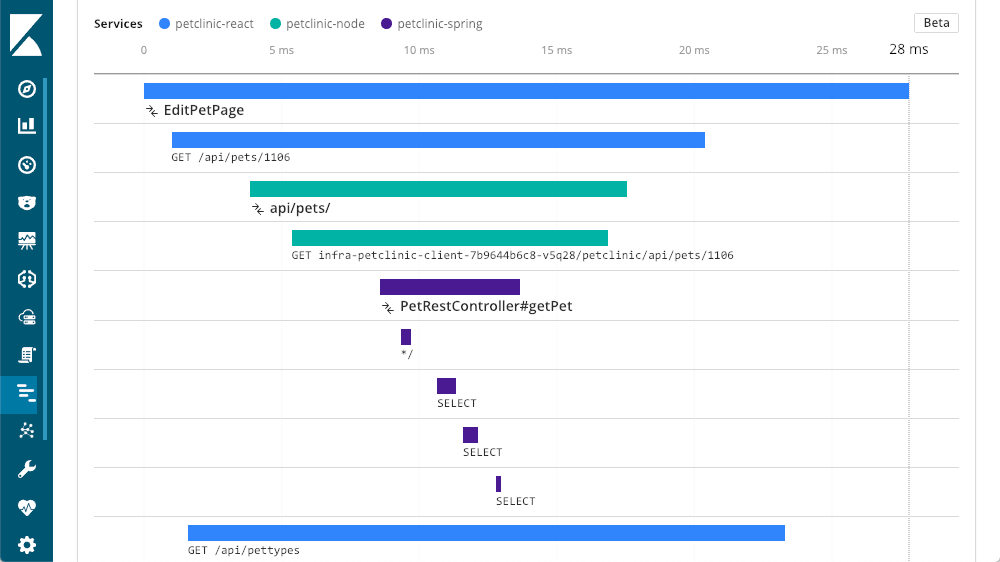
In this case, the layer we started at, the Spring layer, is a service that the other layers call. We can now see that "petclinic-node" called the "petclinic-spring" layer. That's just two layers, but we can see many more, in this example we have a request that started from the browser (React) layer:
Real User Monitoring
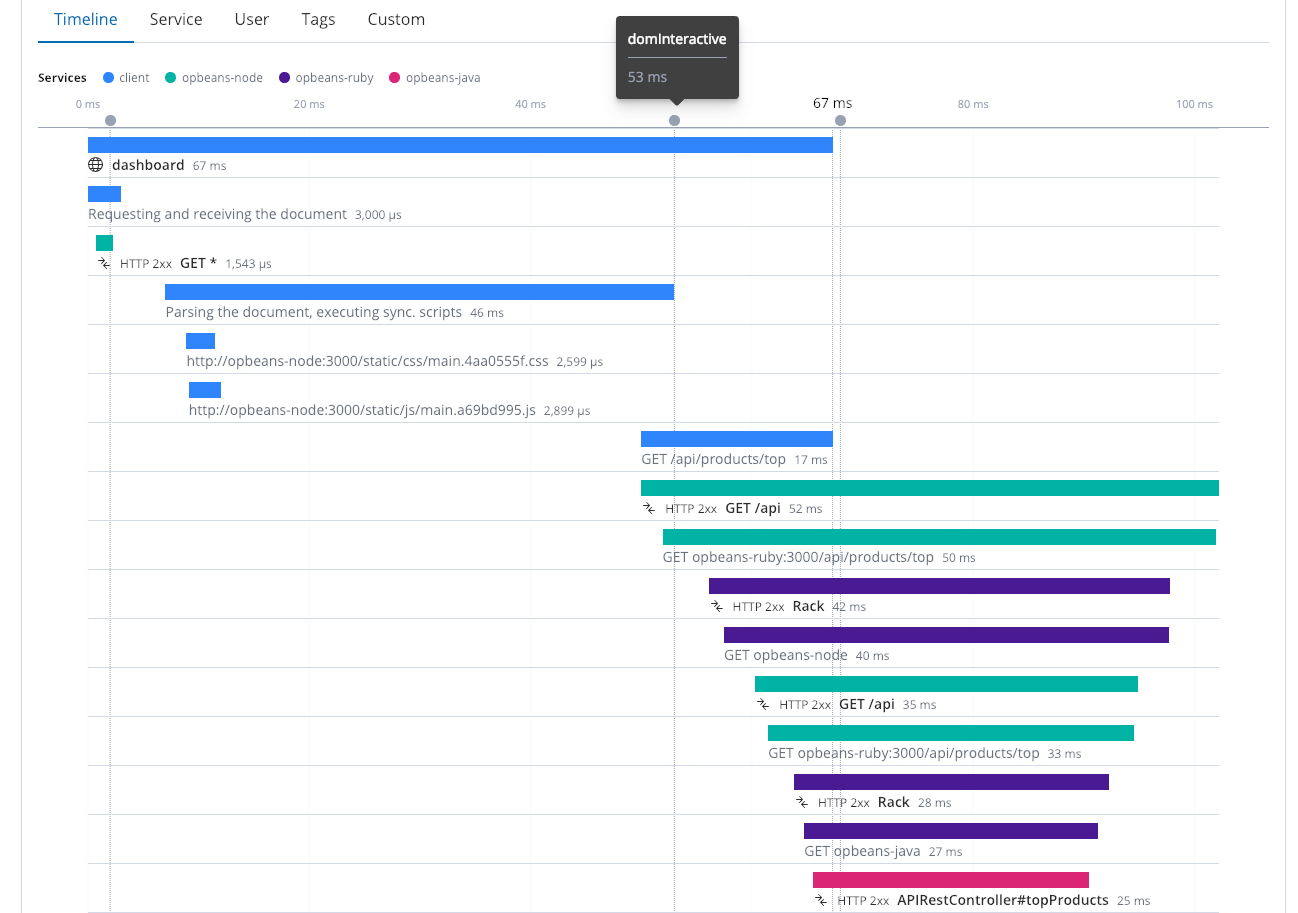
To get the most value out of distributed tracing it is important to instrument as many of your components and services as you can, including leveraging Real User Monitoring (or RUM). Just because you have fast service response times doesn't mean things work quickly in the browser- it's important to gauge the end-users' experiences in the browser. This distributed trace shows four different services, working together. It includes the web browser (the client), along with several services. At 53ms, the dom was interactive, and at 67ms we see that the dom is complete.
Not just a Pretty Face
Elastic APM isn't just about a turnkey APM UI, geared for application developers, and the data backing it isn't there to only serve that UI. In fact, one of the best parts about Elastic APM data is that it is just another index. The information is right there, alongside your logs, metrics, even your business data, allowing you to see how a server slowdown impacts your revenue, or leverage APM data to help plan what your next round of code enhancements should be (hint: take a look at the requests with the highest impact).
APM ships with default visualizations and dashboards, allowing us to mix and match them with visualizations from logs, metrics, or even our business data.
Getting Started with Elastic APM
Elastic APM can run alongside Logstash and Beats, with a similar deployment topology:
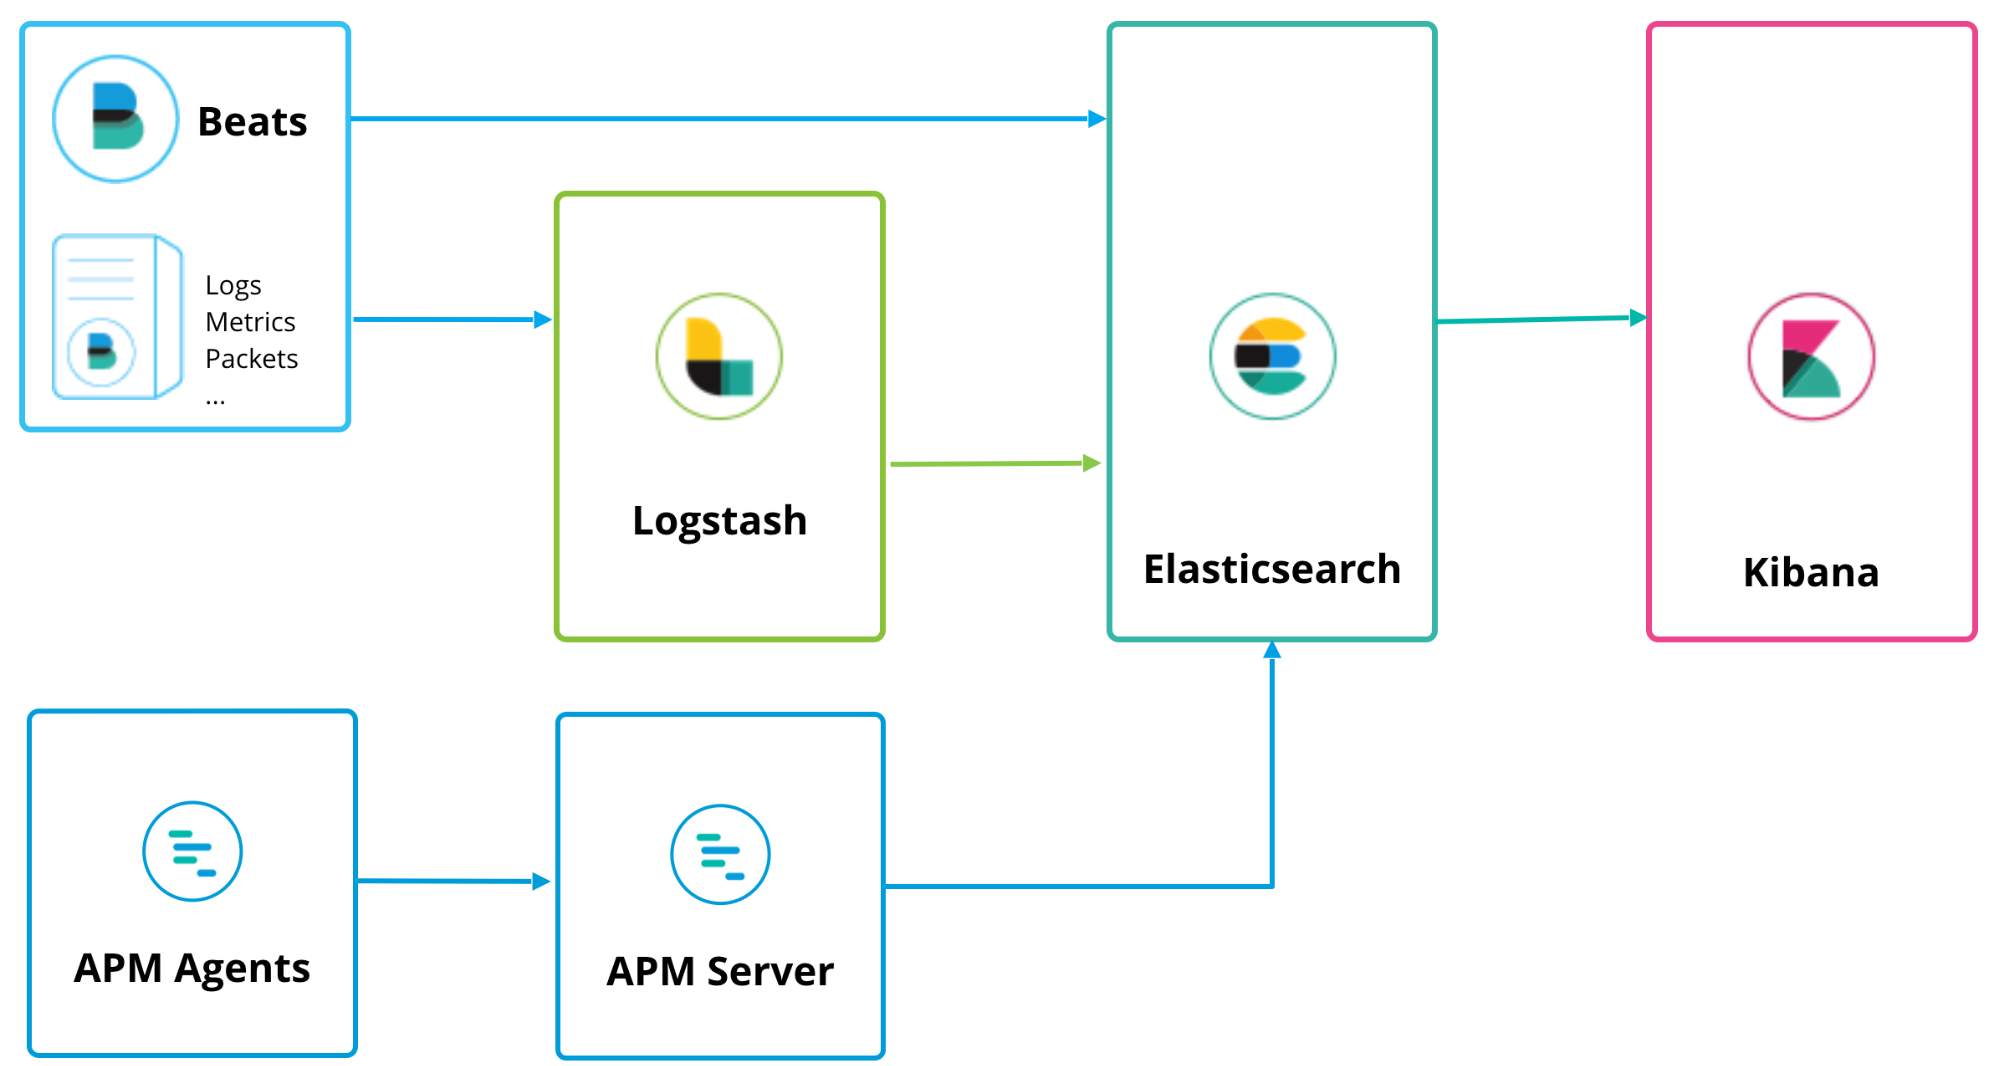
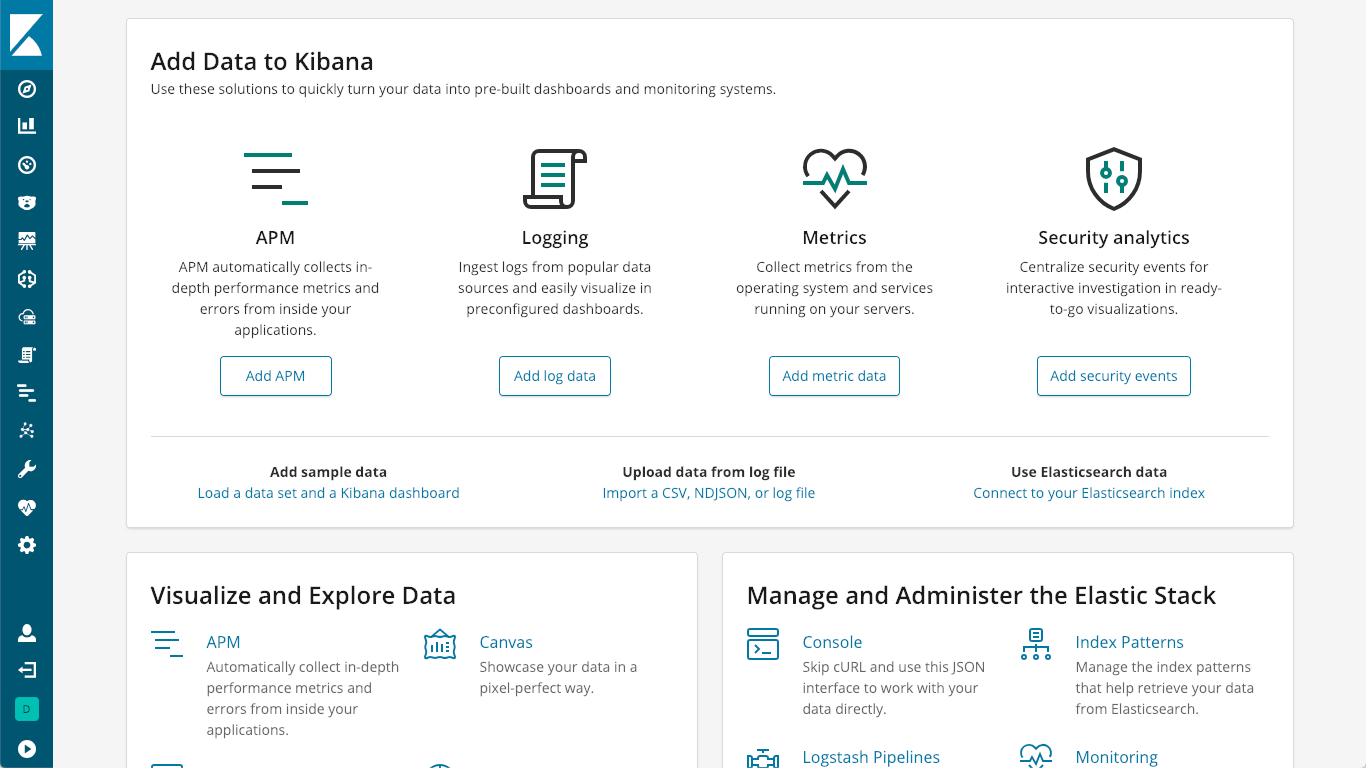
The APM Server acts as a data processor, forwarding APM data from the APM agents to Elasticsearch. Installation is pretty straightforward, and can be found on the "install and run" page of the documentation, or you can simply click on the "K" logo in your Kibana to get to the Kibana home screen, where you will see an option to "Add APM":
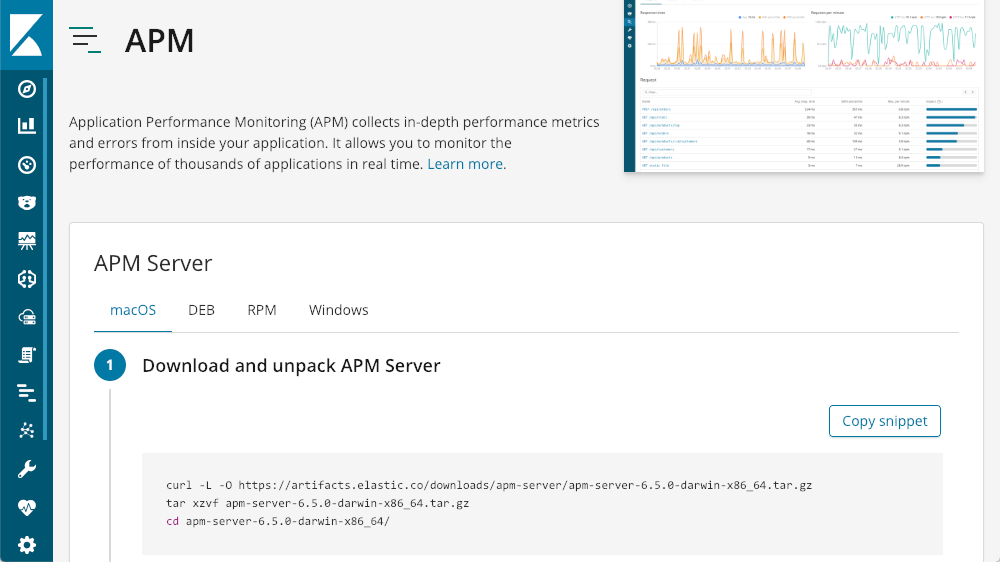
Which then walks you through getting an APM Server up and running:
Once you get that up and running, Kibana has tutorials for each agent type built right in:
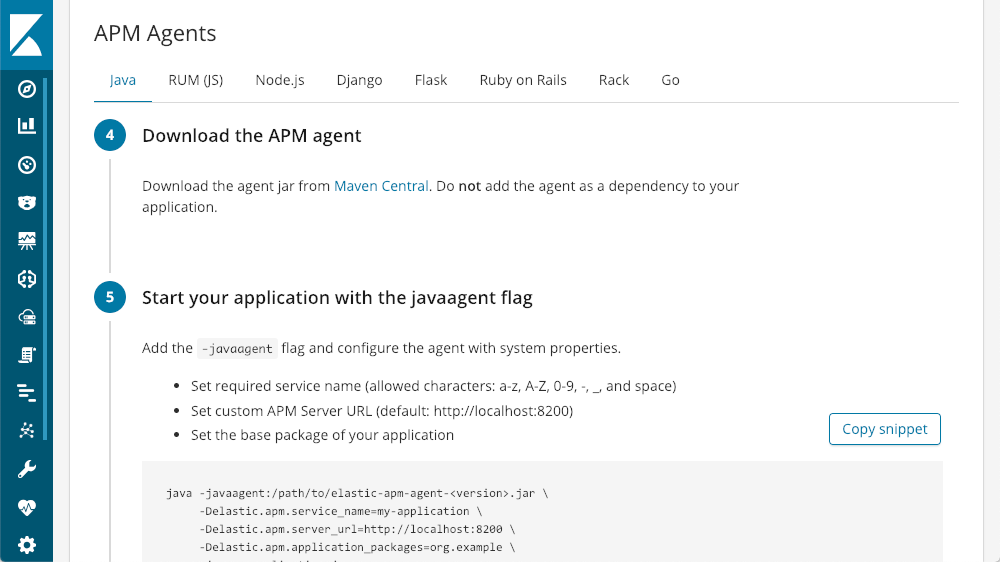
You can be up and running with only a few lines of code.
Take Elastic APM for a Spin
There's really no better way to learn something new than jumping in and getting your hands dirty, and we have several different ways at our disposal. If you want to see the interface, live and in person, you can click around in our APM demo environment. If you'd rather run things locally, you can follow the steps on our APM Server download page.
The shortest path is via the Elasticsearch Service on Elastic Cloud, our SaaS offering where you can have an entire Elasticsearch deployment — including an APM server (as of 6.6), a Kibana instance, and a machine learning node — up and running in minutes (and there is a free two-week trial). The best part is that we maintain your deployment infrastructure for you.
Enabling APM on the Elasticsearch Service
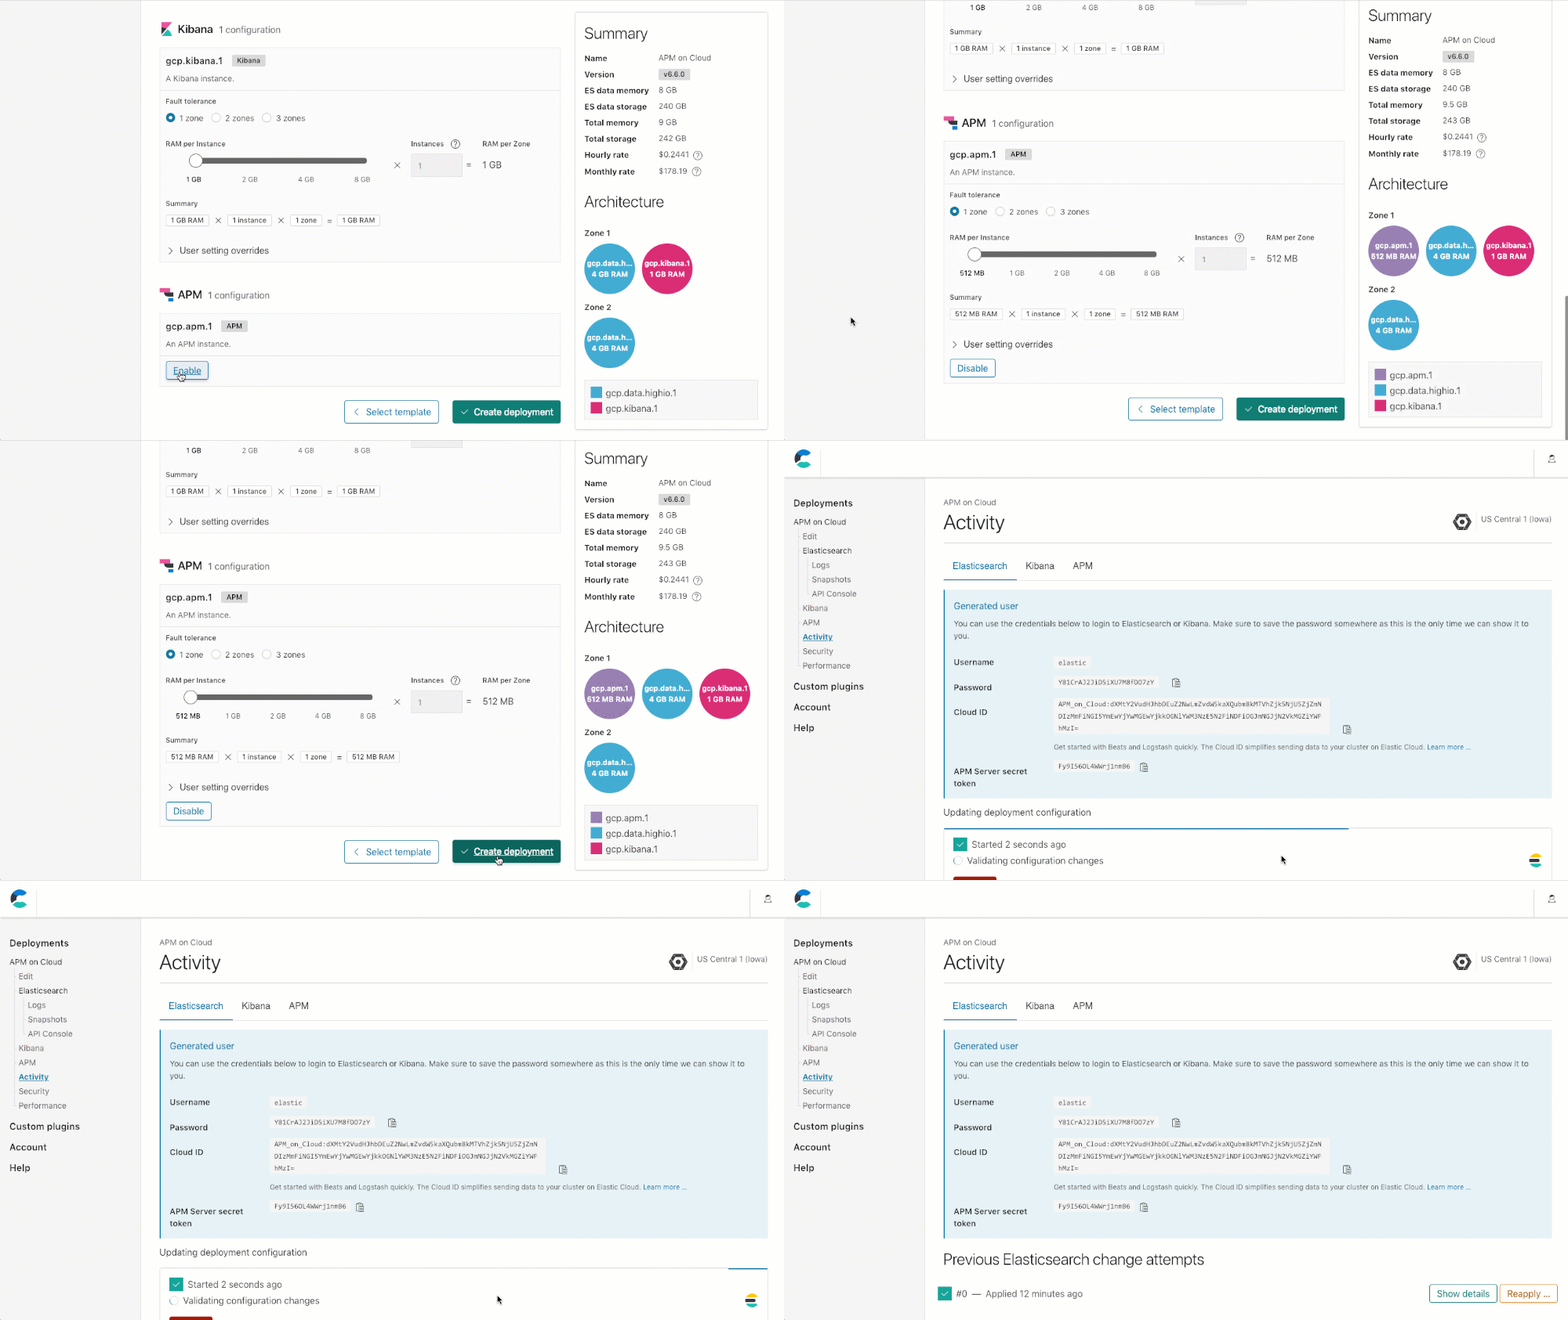
To create your cluster with APM (or add APM to an existing cluster), you simply scroll down to the APM configuration section on your cluster, click on "Enable", and then either "Save changes" (when updating an existing deployment), or "Create deployment" (when creating a new deployment).
Licensing
The Elastic APM Server and all of the APM agents are all open source, and the curated APM UI is included in the default distribution of the Elastic Stack under the free Basic license. The integrations we referenced earlier (alerting and machine learning) tie to the underlying license for the base feature, so Gold for alerting, and Platinum for machine learning.
Summary
APM lets us see what is going on with our applications, at all tiers. With integrations to machine learning and alerting, combined with the power of search, Elastic APM adds a whole other layer of visibility into your application infrastructure. We can use it to visualize transactions, traces, errors, and exceptions, all from the context of a curated APM user interface. Even when we aren't having issues, we can leverage the data from Elastic APM to help prioritize fixes, to get the best performance out of our applications, and fight bottlenecks.
If you want to find out more about Elastic APM and observability, check out a few of our past webinars:
- Instrument and Monitor Java Applications using Elastic APM
- Using the Elastic Stack for Application Performance Monitoring
- Using Elasticsearch, Beats and Elastic APM to monitor your OpenShift Data
- Unifying APM, Logs, and Metrics for Deeper Operational Visibility
- Tracking your Infrastructure Logs & Metrics in the Elastic Stack (ELK Stack)
Try it out today! Hit us up on the APM topic on our discuss forum or submit tickets or feature requests on our APM GitHub repos.