Rally and Elasticsearch benchmarks: How to interpret ingest-only tracks


 Share on Twitter
Share on Twitter

 Share on LinkedIn
Share on LinkedIn

 Share on Facebook
Share on Facebook

 Share by Email
Share by Email

 Print this page
Print
In the previous blog post, we installed Rally, set up the metrics collection, and ran our first race (aka benchmark). Any time you execute Rally it should serve a purpose. It should have a clearly defined goal, such as testing if my cluster can deal with 5TB of ingest per day. It needs to deal with 300.000 documents per second. It should handle spikes of 500.000 documents for x amount of time. All of those clear goals should be captured and tested against. Running Rally for the sake of running might not yield any benefit because you do not know what you are targeting to tune.
Elastic does not recommend running Rally against a cluster that is in production. Rally tracks feature destructive actions and can lead to data loss. Additionally, benchmarking a cluster receiving load from somewhere else is not that useful since Rally metrics cannot be adequately interpreted.
Disclaimer: The following benchmarks were run against three Elasticsearch nodes running on e2-standard-16 in GCP. None of those benchmarks can be used as a reference point to what your Elasticsearch cluster should be capable of. No references or any other thing can be drawn from the output of the benchmarks discussed in this blog.
The race
Our first race is using the append-no-conflicts challenge on the http_logs track. This track is nice because it is a simple indexing challenge that will try to write as fast as possible. We are setting it up to use one primary and one replica. The exact command used is this:
esrally race --user-tags=’{"benchmark_id": "1.1-http_logs-w20p1r1"}’ --track=http_logs --kill-running-processes --target-hosts=https://to-benchmark.elastic.co:9200 --pipeline=benchmark-only --client-options="verify_certs:false,basic_auth_user:'rally',basic_auth_password:’*’" --track- params='{"bulk_indexing_clients":20,"number_of_shards":1,"number_of_replicas":1}'
--challenge=append-no-conflicts-index-only
The entire output looks like this. Let us go through it step by step.
    ____        ____
   / __ \____ _/ / /_  __
  / /_/ / __ `/ / / / / /
 / _, _/ /_/ / / / /_/ /
/_/ |_|\__,_/_/_/\__, /
                /____/

[INFO] Race id is [99efadde-0c97-420b-a348-3ffa64cf3388]
[INFO] Racing on track [http_logs], challenge [append-no-conflicts-index-only] and car ['external'] with version [8.12.1].

[WARNING] merges_total_time is 1433768 ms indicating that the cluster is not in a defined clean state. Recorded index time metrics may be misleading.
[WARNING] merges_total_throttled_time is 366296 ms indicating that the cluster is not in a defined clean state. Recorded index time metrics may be misleading.
[WARNING] indexing_total_time is 11289407 ms indicating that the cluster is not in a defined clean state. Recorded index time metrics may be misleading.
[WARNING] refresh_total_time is 184085 ms indicating that the cluster is not in a defined clean state. Recorded index time metrics may be misleading.
[WARNING] flush_total_time is 866810 ms indicating that the cluster is not in a defined clean state. Recorded index time metrics may be misleading.
Running delete-index                                                           [100% done]
Running create-index                                                           [100% done]
Running check-cluster-health                                                   [100% done]
Running index-append                                                           [100% done]
Running refresh-after-index                                                    [100% done]
Running force-merge                                                            [100% done]
Running refresh-after-force-merge                                              [100% done]
Running wait-until-merges-finish                                               [100% done]

------------------------------------------------------
    _______             __   _____
   / ____(_)___  ____ _/ /  / ___/_________  ________
  / /_  / / __ \/ __ `/ /   \__ \/ ___/ __ \/ ___/ _ \
 / __/ / / / / / /_/ / /   ___/ / /__/ /_/ / /  /  __/
/_/   /_/_/ /_/\__,_/_/   /____/\___/\____/_/   \___/
------------------------------------------------------

|                                                         Metric |         Task |            Value |   Unit |
|---------------------------------------------------------------:|-------------:|-----------------:|-------:|
|                     Cumulative indexing time of primary shards |              |    196.216       |    min |
|             Min cumulative indexing time across primary shards |              |      0           |    min |
|          Median cumulative indexing time across primary shards |              |      0           |    min |
|             Max cumulative indexing time across primary shards |              |    146.632       |    min |
|            Cumulative indexing throttle time of primary shards |              |      0           |    min |
|    Min cumulative indexing throttle time across primary shards |              |      0           |    min |
| Median cumulative indexing throttle time across primary shards |              |      0           |    min |
|    Max cumulative indexing throttle time across primary shards |              |      0           |    min |
|                        Cumulative merge time of primary shards |              |     77.193       |    min |
|                       Cumulative merge count of primary shards |              |     41           |        |
|                Min cumulative merge time across primary shards |              |      0           |    min |
|             Median cumulative merge time across primary shards |              |      0           |    min |
|                Max cumulative merge time across primary shards |              |     65.6786      |    min |
|               Cumulative merge throttle time of primary shards |              |     21.9476      |    min |
|       Min cumulative merge throttle time across primary shards |              |      0           |    min |
|    Median cumulative merge throttle time across primary shards |              |      0           |    min |
|       Max cumulative merge throttle time across primary shards |              |     20.2746      |    min |
|                      Cumulative refresh time of primary shards |              |      2.78462     |    min |
|                     Cumulative refresh count of primary shards |              |    400           |        |
|              Min cumulative refresh time across primary shards |              |      0           |    min |
|           Median cumulative refresh time across primary shards |              |      0           |    min |
|              Max cumulative refresh time across primary shards |              |      1.07823     |    min |
|                        Cumulative flush time of primary shards |              |     16.0124      |    min |
|                       Cumulative flush count of primary shards |              |     58           |        |
|                Min cumulative flush time across primary shards |              |      0.0001      |    min |
|             Median cumulative flush time across primary shards |              |      0.0003      |    min |
|                Max cumulative flush time across primary shards |              |     12.7057      |    min |
|                                        Total Young Gen GC time |              |     12.677       |      s |
|                                       Total Young Gen GC count |              |    215           |        |
|                                          Total Old Gen GC time |              |      0           |      s |
|                                         Total Old Gen GC count |              |      0           |        |
|                                                     Store size |              |     43.9349      |     GB |
|                                                  Translog size |              |      1.53668e-06 |     GB |
|                                         Heap used for segments |              |      0           |     MB |
|                                       Heap used for doc values |              |      0           |     MB |
|                                            Heap used for terms |              |      0           |     MB |
|                                            Heap used for norms |              |      0           |     MB |
|                                           Heap used for points |              |      0           |     MB |
|                                    Heap used for stored fields |              |      0           |     MB |
|                                                  Segment count |              |     36           |        |
|                                    Total Ingest Pipeline count |              |      0           |        |
|                                     Total Ingest Pipeline time |              |      0           |      s |
|                                   Total Ingest Pipeline failed |              |      0           |        |
|                                                 Min Throughput | index-append | 148682           | docs/s |
|                                                Mean Throughput | index-append | 175950           | docs/s |
|                                              Median Throughput | index-append | 166383           | docs/s |
|                                                 Max Throughput | index-append | 244183           | docs/s |
|                                        50th percentile latency | index-append |    330.002       |     ms |
|                                        90th percentile latency | index-append |   1870.95        |     ms |
|                                        99th percentile latency | index-append |   4708.83        |     ms |
|                                      99.9th percentile latency | index-append |   8383.23        |     ms |
|                                     99.99th percentile latency | index-append |  10537.2         |     ms |
|                                       100th percentile latency | index-append |  14476           |     ms |
|                                   50th percentile service time | index-append |    330.002       |     ms |
|                                   90th percentile service time | index-append |   1870.95        |     ms |
|                                   99th percentile service time | index-append |   4708.83        |     ms |
|                                 99.9th percentile service time | index-append |   8383.23        |     ms |
|                                99.99th percentile service time | index-append |  10537.2         |     ms |
|                                  100th percentile service time | index-append |  14476           |     ms |
|                                                     error rate | index-append |      0           |      % |


----------------------------------
[INFO] SUCCESS (took 3867 seconds)
----------------------------------Analyzing the race
The race report starts with a disclaimer in our case since we did not tear down the cluster and started from a fresh installed cluster. In most cases we can ignore those warnings since we are not interested in any of those cumulative timings. The only thing to keep in mind is that if you are targeting an existing cluster that’s already running, make sure that Rally is the only tool communicating with it, and don’t forget that Rally has destructive potential as it will delete indices and data streams that are part of the race. Rally is expecting a new and fresh cluster after every run and many calculations of such telemetry is based on measuring at the end. One way to get rid of those messages would be a full cluster reboot since most of the node information resets on a restart. We have detailed documentation on the telemetry that Rally collects.
The race reports a lot of values that might not be interesting at all depending on the type. In our case (an ingest-only race), we want to focus on just the ingest-related metrics. The informative data is after Store Size.
Store size
The store size represents the actual stored data in the shards, and in this case, it is ~44GB. This is a useful metric when you want to get the storage down. There are many optimizations to take from changing the mapping for text fields to match_only_text as well as setting it to synthetic source. All of those have implications, so read through them carefully.
Translog size, heap used metrics
We can discard all of those metrics as not interesting to use in this case.
Segment count
The segment count can be discarded since it is based on this call GET _all/_stats?level=shards, which then uses the _all.primaries.segments.count. Since this includes all primaries running on the nodes and not just the segments from the indexes Rally created, it is not very useful for us.
Ingest pipeline metrics
These metrics are relevant if we use an ingest pipeline, which we are not in this case. Since ingest pipelines are often used in conjunction with indexing workloads those metrics can be very helpful. The overall count just tells you how many documents were processed by the ingest pipeline. The total time is the entire time all documents spent in that pipeline, this can be in seconds, minutes, hours, depending on the complexity and how many documents you sent through. You can use this to calculate an average value and therefore know how long on average a single document spends in the ingest pipeline.
The failed parameter helps you identify how many documents failed. This only indicates failures that are not part of any ignore_missing or ignore_failure setting on the processors in an ingest pipeline. Note that opposed to other metrics, the ingest pipeline metrics are calculated using start and end deltas, so you don’t need a fresh cluster to test against. Check the telemetry documentation to learn more.
Throughput metrics
There are a couple of throughput metrics that are the most important ones in an indexing-only track. Those tell you how many documents per second can be processed in your setup. The min throughput is the value that is the minimum achieved. Mean is the average throughput, median is the value in the middle of the data set, and max relates to the highest recorded throughput. How do you interpret those values in a general manner?
The maximum value can most of the time be discarded. Maximum is mostly achieved in the very first few seconds of the benchmarks when no queues, no caches, no nothing are used up. In most production environments, there is consistent load on the cluster, thus the same maximum value cannot be reached.
The median and mean are the most important ones, and they should be very close together. One reason the mean might be off is due to being able to sustain a higher burst, thus having a swayed distribution towards the maximum value instead of a gaussian curve. In our case, we can roughly ingest 17.500 documents per seconds based on the average value into a single shard in an append-only manner. For the median we are a bit lower with only 16.600 documents per second.
This value is important as it tells us that I can expect continuous ingest workloads for a single primary shard with that data to be roughly around 16.000-18.000 documents per second. Again, one caveat must be implied: right now, we are looking at just the documents per second for a single primary shard with one replica shard enabled. We did not yet look at the CPU usage during that time to identify if we are CPU bottlenecked, disk bottlenecked, or any other additional factor. What we should refrain from doing is multiplying this assumption — as in, a single Elasticsearch node holding 10 primary shards with the same data will be able to throughput 16.000 to 18.000 documents per second.
Percentile latencies
There are two percentiles — the first for the latency and then the service time. Percentiles represent the amount of data under a certain threshold. Percentiles are a nice way to see how consistent we are. It is also a way for us to know certain thresholds. In our case, 90% of all indexing requests are completed within two seconds. The other 10% take the longest time. For example, we see that going from 90% to 99% of all requests takes quite a bit longer — oftentimes twice as long. The 99th percentile is around 4.7 seconds. This means that we can handle 99% of all requests below 4.7 seconds. However, that is twice as long as the two seconds for 90% of the request. This is the part where tuning and optimizations come into place.
Altering bulk sizes and altering the amount of concurrent workers might play nicely with us. The difference between latency and service time latency are also covered in this FAQ in the official Rally docs. Generally speaking, when you use Rally for ingest-only, the service time will be equal to the latency.
Error rate
Any indexing error can occur due to mapping conflicts, broken messages, ingest pipeline failures, and many more issues. The error rate lets us know how many messages failed.
Rally metrics in Kibana
In the first blog post, we set up the Rally and Stack Monitoring to send telemetry and information about the race as well to another cluster. Let’s take a look at some of the documents rally sends. There is the rally-metrics, rally-results, and rally-races index. For the dashboards and further analysis, I would recommend creating a data view that looks at rally-metrics, as those are streamed during the Rally itself and you get live data.
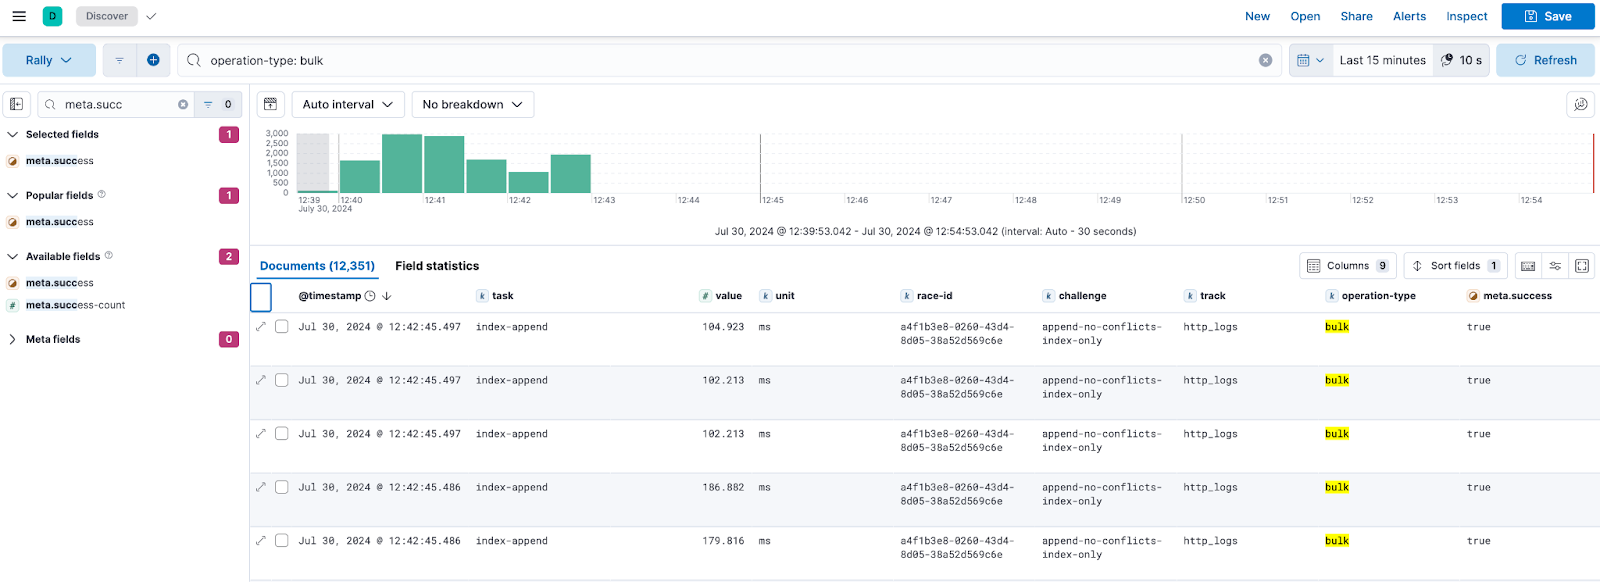
We have multiple fields that are interesting and some we can ignore for this case. Most docs contain the same fields and values.
| Field name | Description |
| challenge | The challenge name as specified in the esrally command |
| meta.tag_* | The tags specified in the run --user-tags=’{"benchmark_id": "1.1-http_logs-w20p1r1"}’. In this case, it will be meta.tag_benchmark_id and have the value 1.1-http_logs-w20p1r1. |
| meta.error-count | The total number of errors that are encountered in this one particular request |
| meta.distribution_version | Telling us the version of the target cluster — in our case 8.14.3 |
| meta.index | Telling us which index is being targeted by the metrics in this doc. This can be useful when running a larger benchmark with multiple different target indices or data streams, where each one has different ingest pipelines or different shard settings. |
| meta.success | True or false |
| meta.success-count | Same as meta.error-count — counts the success ones in this one request |
| meta.took | In the time Elasticsearch reports to Rally, such as for this bulk operation, Elasticsearch took 90 (which is in milliseconds). |
| operation | The operation as part of the challenge (e.g. index-append) |
| operation-type | In this case, the operation type is bulk. |
| race-id | The unique race-id to uniquely identify a race in a dashboard |
| sample-type | Depending on the race, there might be a warming up phase, allowing the Elasticsearch cluster to prefill its caches and so on. This sample-type field will tell you whether it is warm or normal. |
| task | Task name is the same as operation name unless task name is explicitly defined with "name" property (reference). |
| track | The track being used is http_logs. |
| tracks-params.* | The various parameters we supply during the esrally call. Bulk clients, number of replicas, number of shards, bulk size, and so on. |
| unit | Used to know in what unit the value is (in milliseconds most of the time). |
| value | The time it took for esrally to complete this one operation. In this case, it is a single bulk request that took 104 milliseconds. This value should always be larger than meta.took since this includes the time it takes Rally to communicate to Elasticsearch and receive the responses. I recommend using this value in any dashboard for any analysis as it makes sure to uncover issues in your network. A very high difference between value and meta.took can show congestion on firewalls and load balancers. |
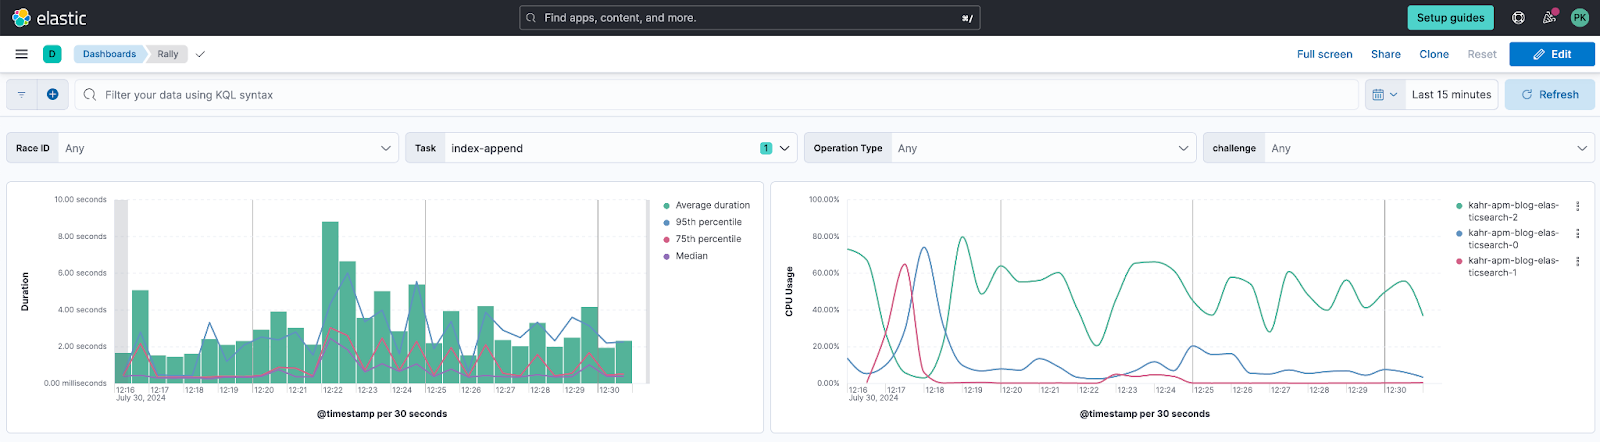
I personally like to build my visualizations in such a way that I can easily see what the average is and if the average is dragged up by some long running actions. That is why I recommend resorting to percentiles when doing such analysis.
Use the average as a bar chart and then apply an additional layer as a line chart that represents the different thresholds you want to see, such as the 95th percentile, 75th percentile, and the median.
The fields to use are:
Value and then apply the duration time formatter for milliseconds.
There are two fields that report the duration. There is meta.took which represents the time Elasticsearch took to process the data. And then there is the value which is the entire round trip, including Rally sending the data until it received the response. Both values are in milliseconds.
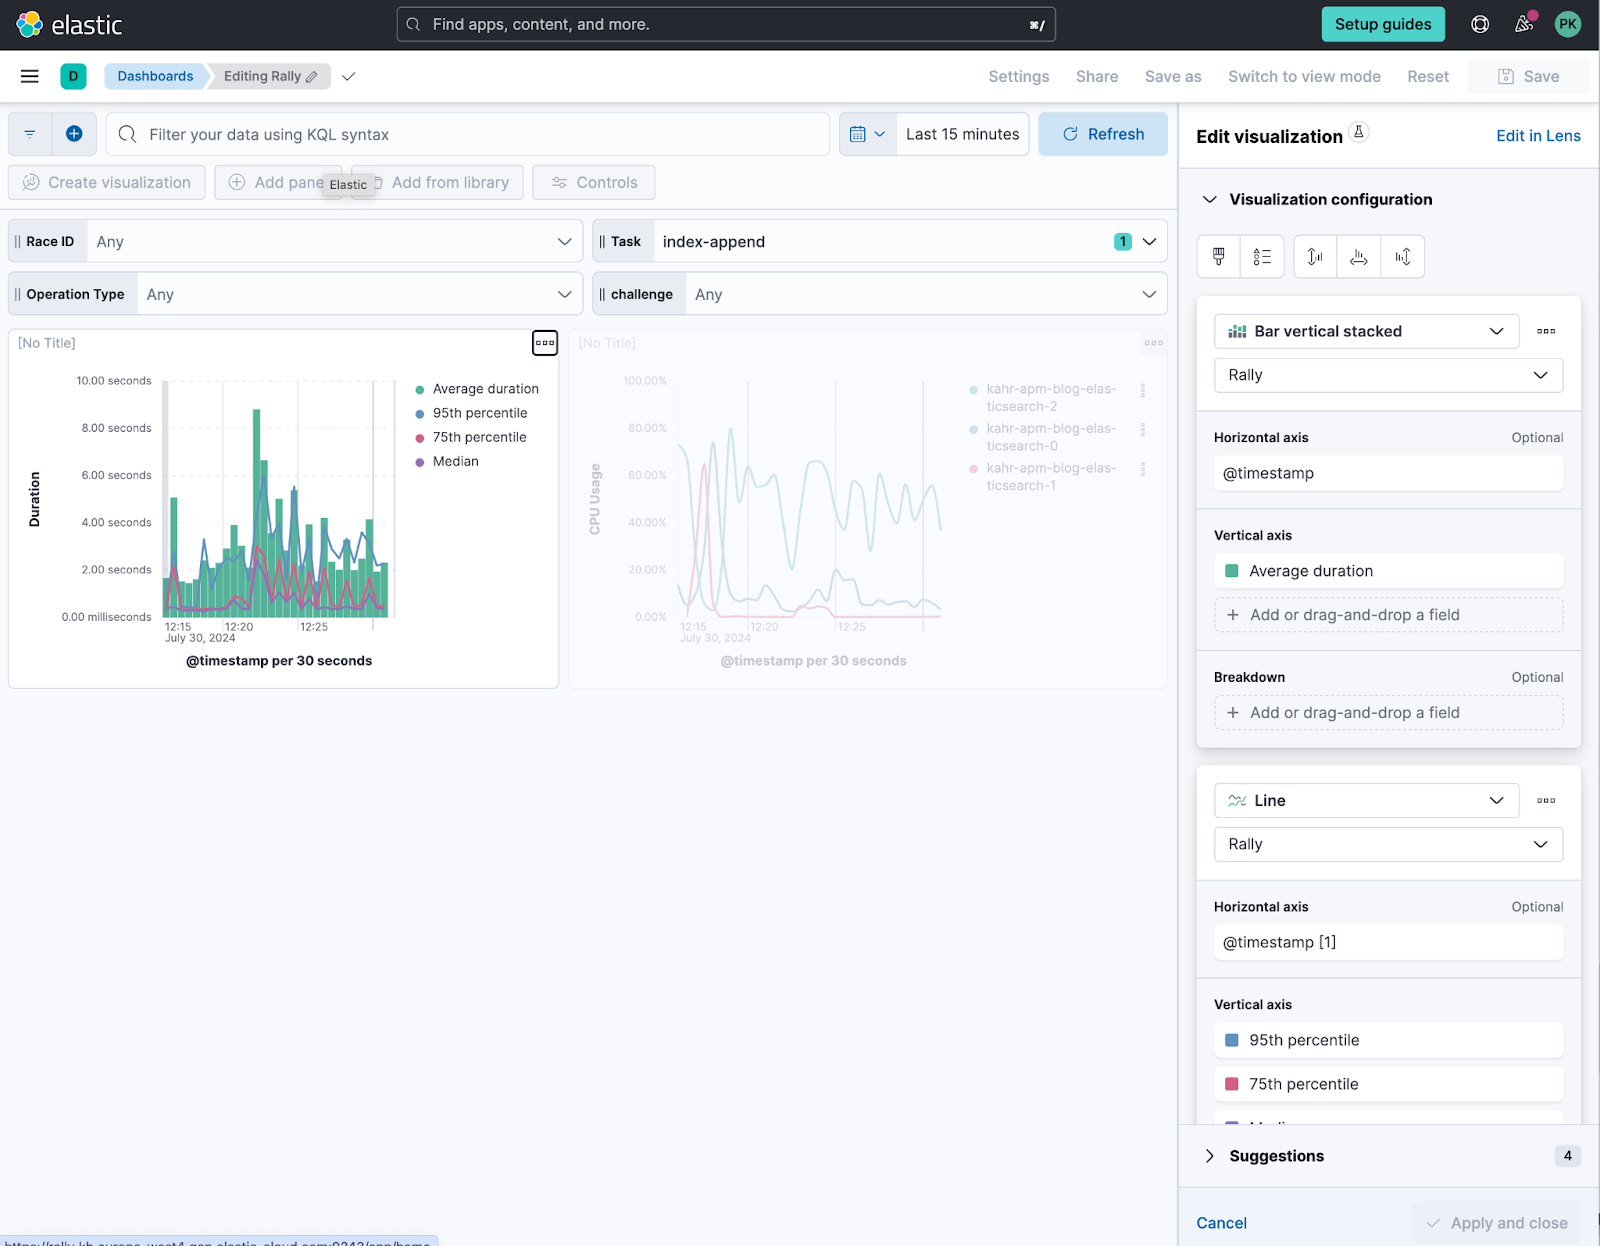
For the CPU usage on the right, since I am using Elastic Agent with the Stack Monitoring metrics, I also have access to the host.cpu.usage which returns the CPU usage in 0-100% regardless of core count. This also includes anything else running on that host, which in our case is fine to use since it only hosts Elasticsearch.
The controls on top of the dashboard are just the following fields.
race.id
task
operation-type
challenge
There are still a couple of improvements to perform, such as the error count versus success, visibility of the entire time, and analyzing the different time certain actions take.
What's next
In this blog, we explained what a race report looks like and how to interpret the numbers. In the next blog post, we will take a look at tuning the race and understanding how different values, such as CPU usage tie into an ingest-only track.
The release and timing of any features or functionality described in this post remain at Elastic's sole discretion. Any features or functionality not currently available may not be delivered on time or at all.
Share
- Share on Twitter
Share on Twitter
- Share on LinkedIn
Share on LinkedIn
- Share on Facebook
Share on Facebook
- Share by Email
Share by Email
- Print this page
Print