How to instrument your Ruby app with the Elastic APM Ruby agent
Sending performance metrics from your Ruby app to APM Server can be as easy as installing the elastic-apm Rubygem. Most integrations are plug-n-play, and Rails and Rack support is built in.
However there are several ways to add more information to the data as well as ways to set up your own custom instrumentations.
Adding more info to the already instrumented parts
To add more information to the data you are already gathering, Elastic APM has a few concepts.
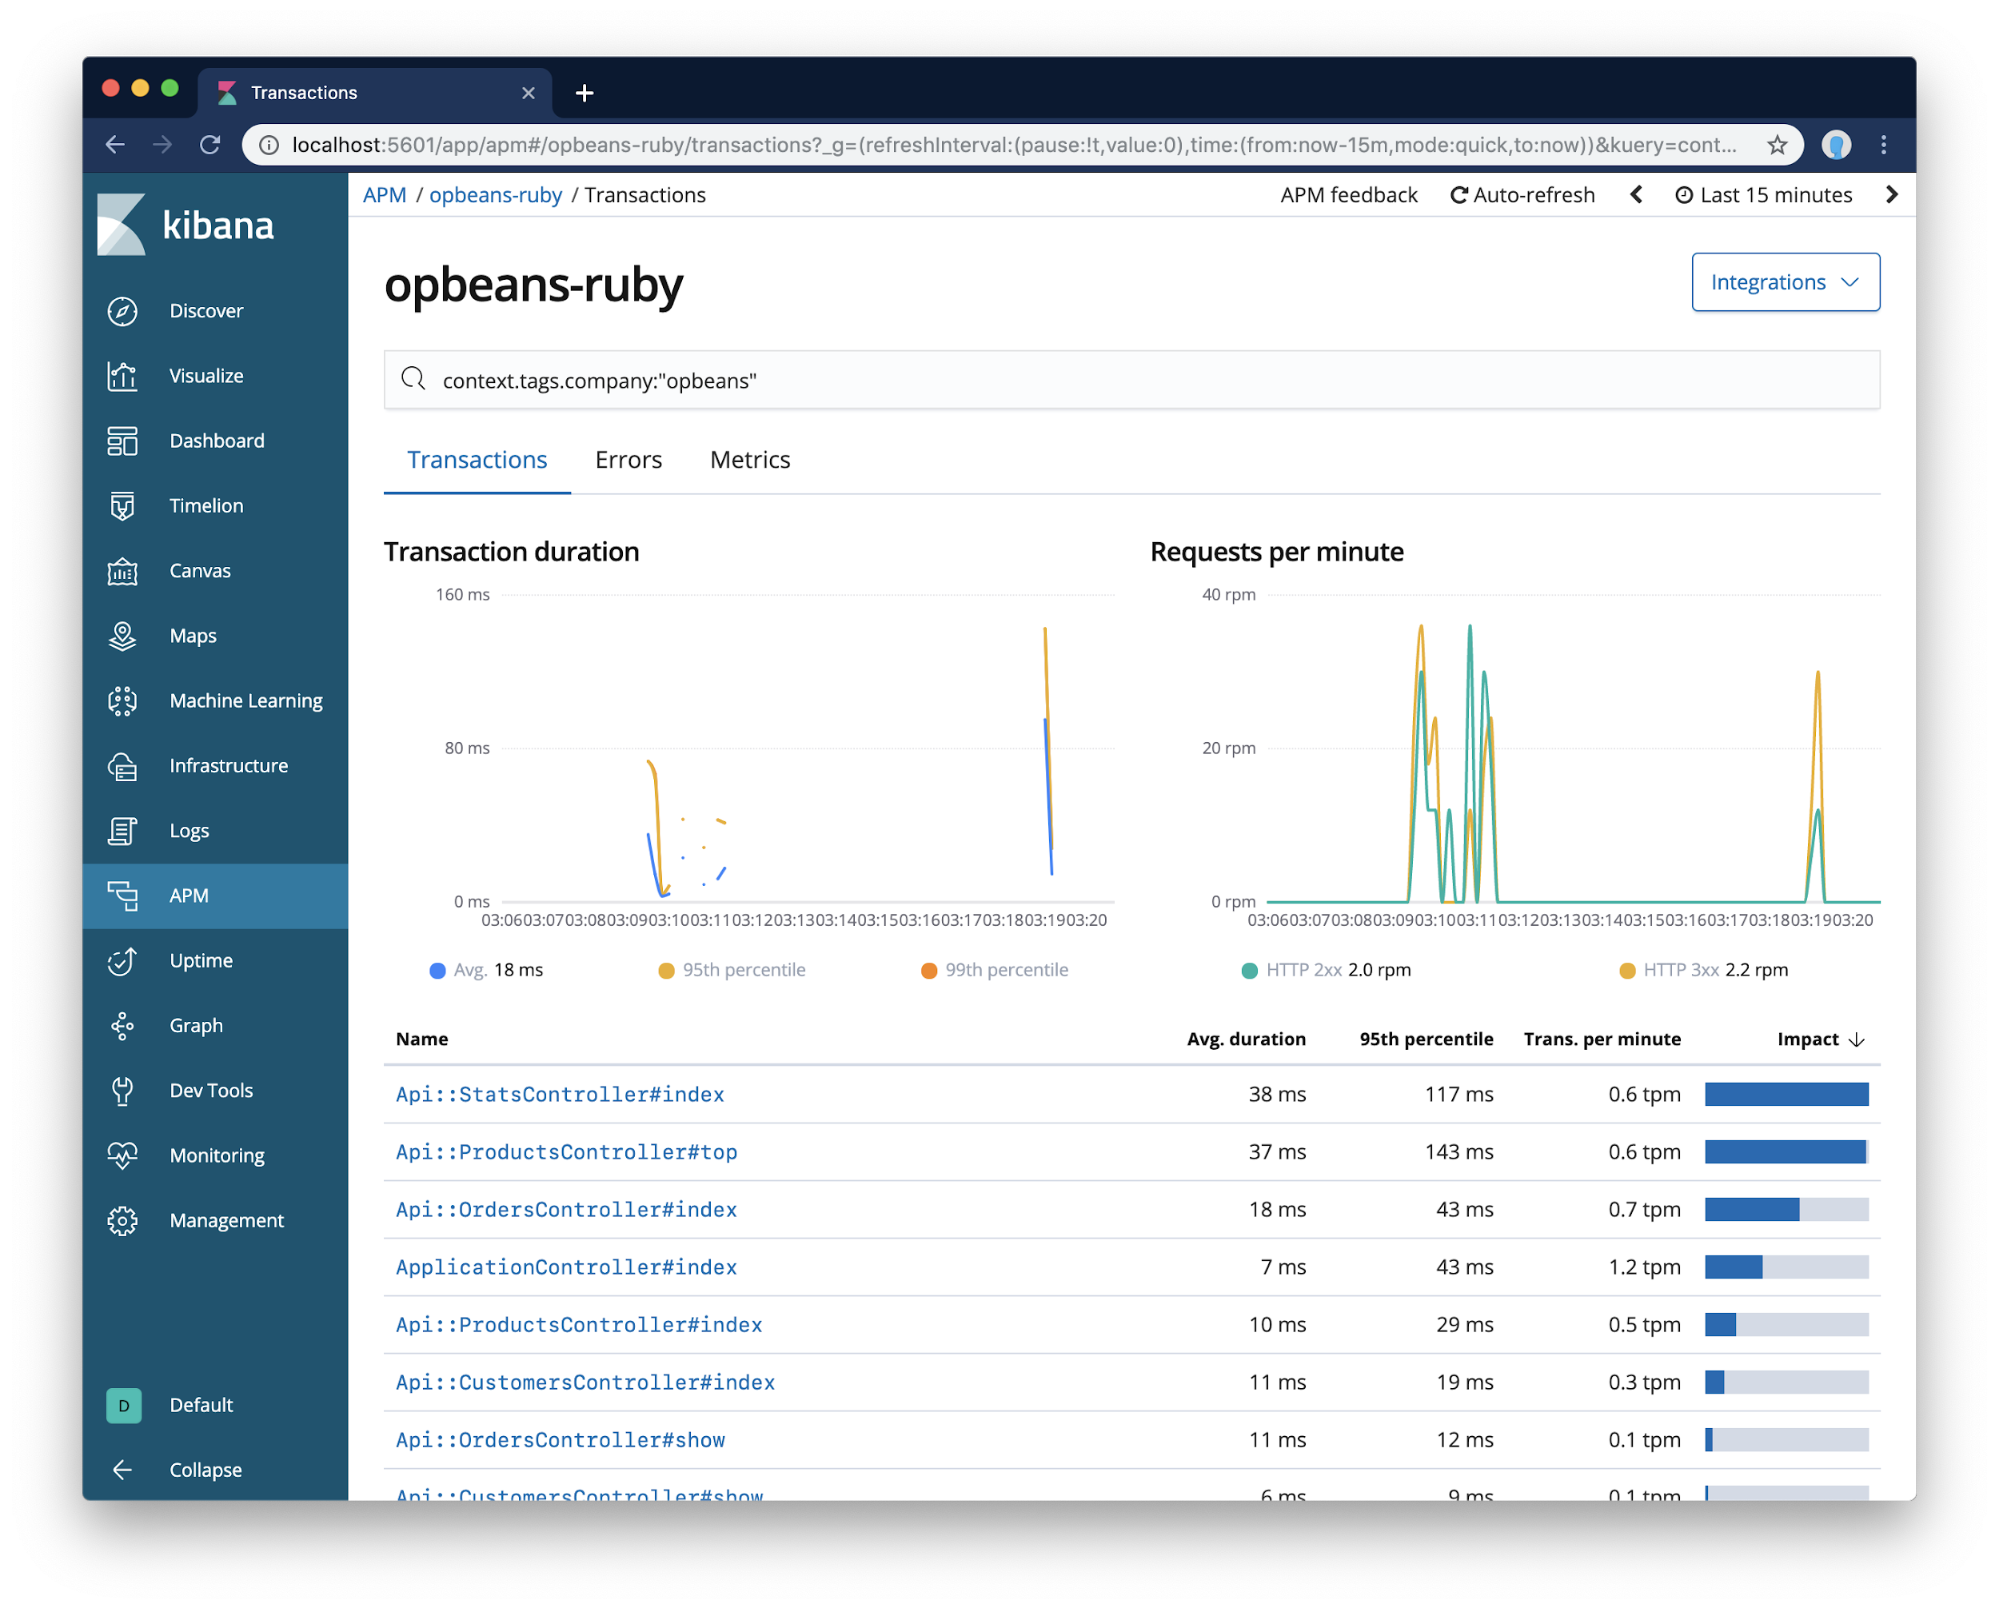
Let's say your app is built around the concept of companies, you could assign the current_company.short_name to every transaction and error. Tags are simple key-value pairs, and they are indexed in Elasticsearch and thereby both filterable and queryable, so you can slice and dice your metrics in any way you want:
class ApplicationController < ActionController::Base
  before_action do
    ElasticAPM.set_label :company, current_company.short_name
  end
end
This will make it way easier to see if certain performance problems or exceptions are only affecting some of your customers.
Users are another widespread concept, and Elastic APM has a place for that as well:
class ApplicationController < ActionController::Base
  before_action do
    ElasticAPM.set_label :company_id, current_company.id
    ElasticAPM.set_user current_user
  end
end
The agent will include the id, email and username fields of whatever is passed. You can of course customize the fields to whatever they may be called in your app.
The SpanHelpers module
If you have your eyes on a specific method that you want to track the duration of, you can use the SpanHelpers module. It provides two methods, span_method and span_class_method.
class ThingsController < ApplicationController
  include ElasticAPM::SpanHelpers

  # ...

  def do_the_work
    # ...
  end
  span_method :do_the_work

  def self.do_other_work
    # ...
  end
  span_class_method :do_other_work

  # ... alternative syntax for newer versions of Ruby

  span_method \
  def do_the_work
    # ...
  end
end
See the Elastic APM Ruby agent SpanHelpers docs.
This approach is great if what you want to measure is a simple method call. If you want more granular control there's the general usage API.
Creating transactions and spans manually
To create transactions and spans manually, the agent provides a public API. The agent itself uses this API internally to instrument most of the supported libraries.
The first thing you'll need is a transaction. If you are inside a request in your Rails app, Rack app using middleware, or a background job in one of the supported job runners, then you're most likely already inside a transaction.
If you aren't, create a transaction like so:
ElasticAPM.start # if it isn't started already

begin
  transaction = ElasticAPM.start_transaction 'Optional name', 'optional.type'
  # It's your responsibility to make sure the transactions are ended.
  # To make sure we do so, we wrap in begin..ensure.
ensure
  ElasticAPM.end_transaction
end
Alternatively, there's a block version of the same that makes sure to end afterwards:
ElasticAPM.with_transaction do |transaction|
  # if you need to, you can alter the transaction inside, eg:
  transaction.name = method_that_returns_the_name

  # be aware that if the agent isn't started, `transaction` is nil but the block is still evaluated
end
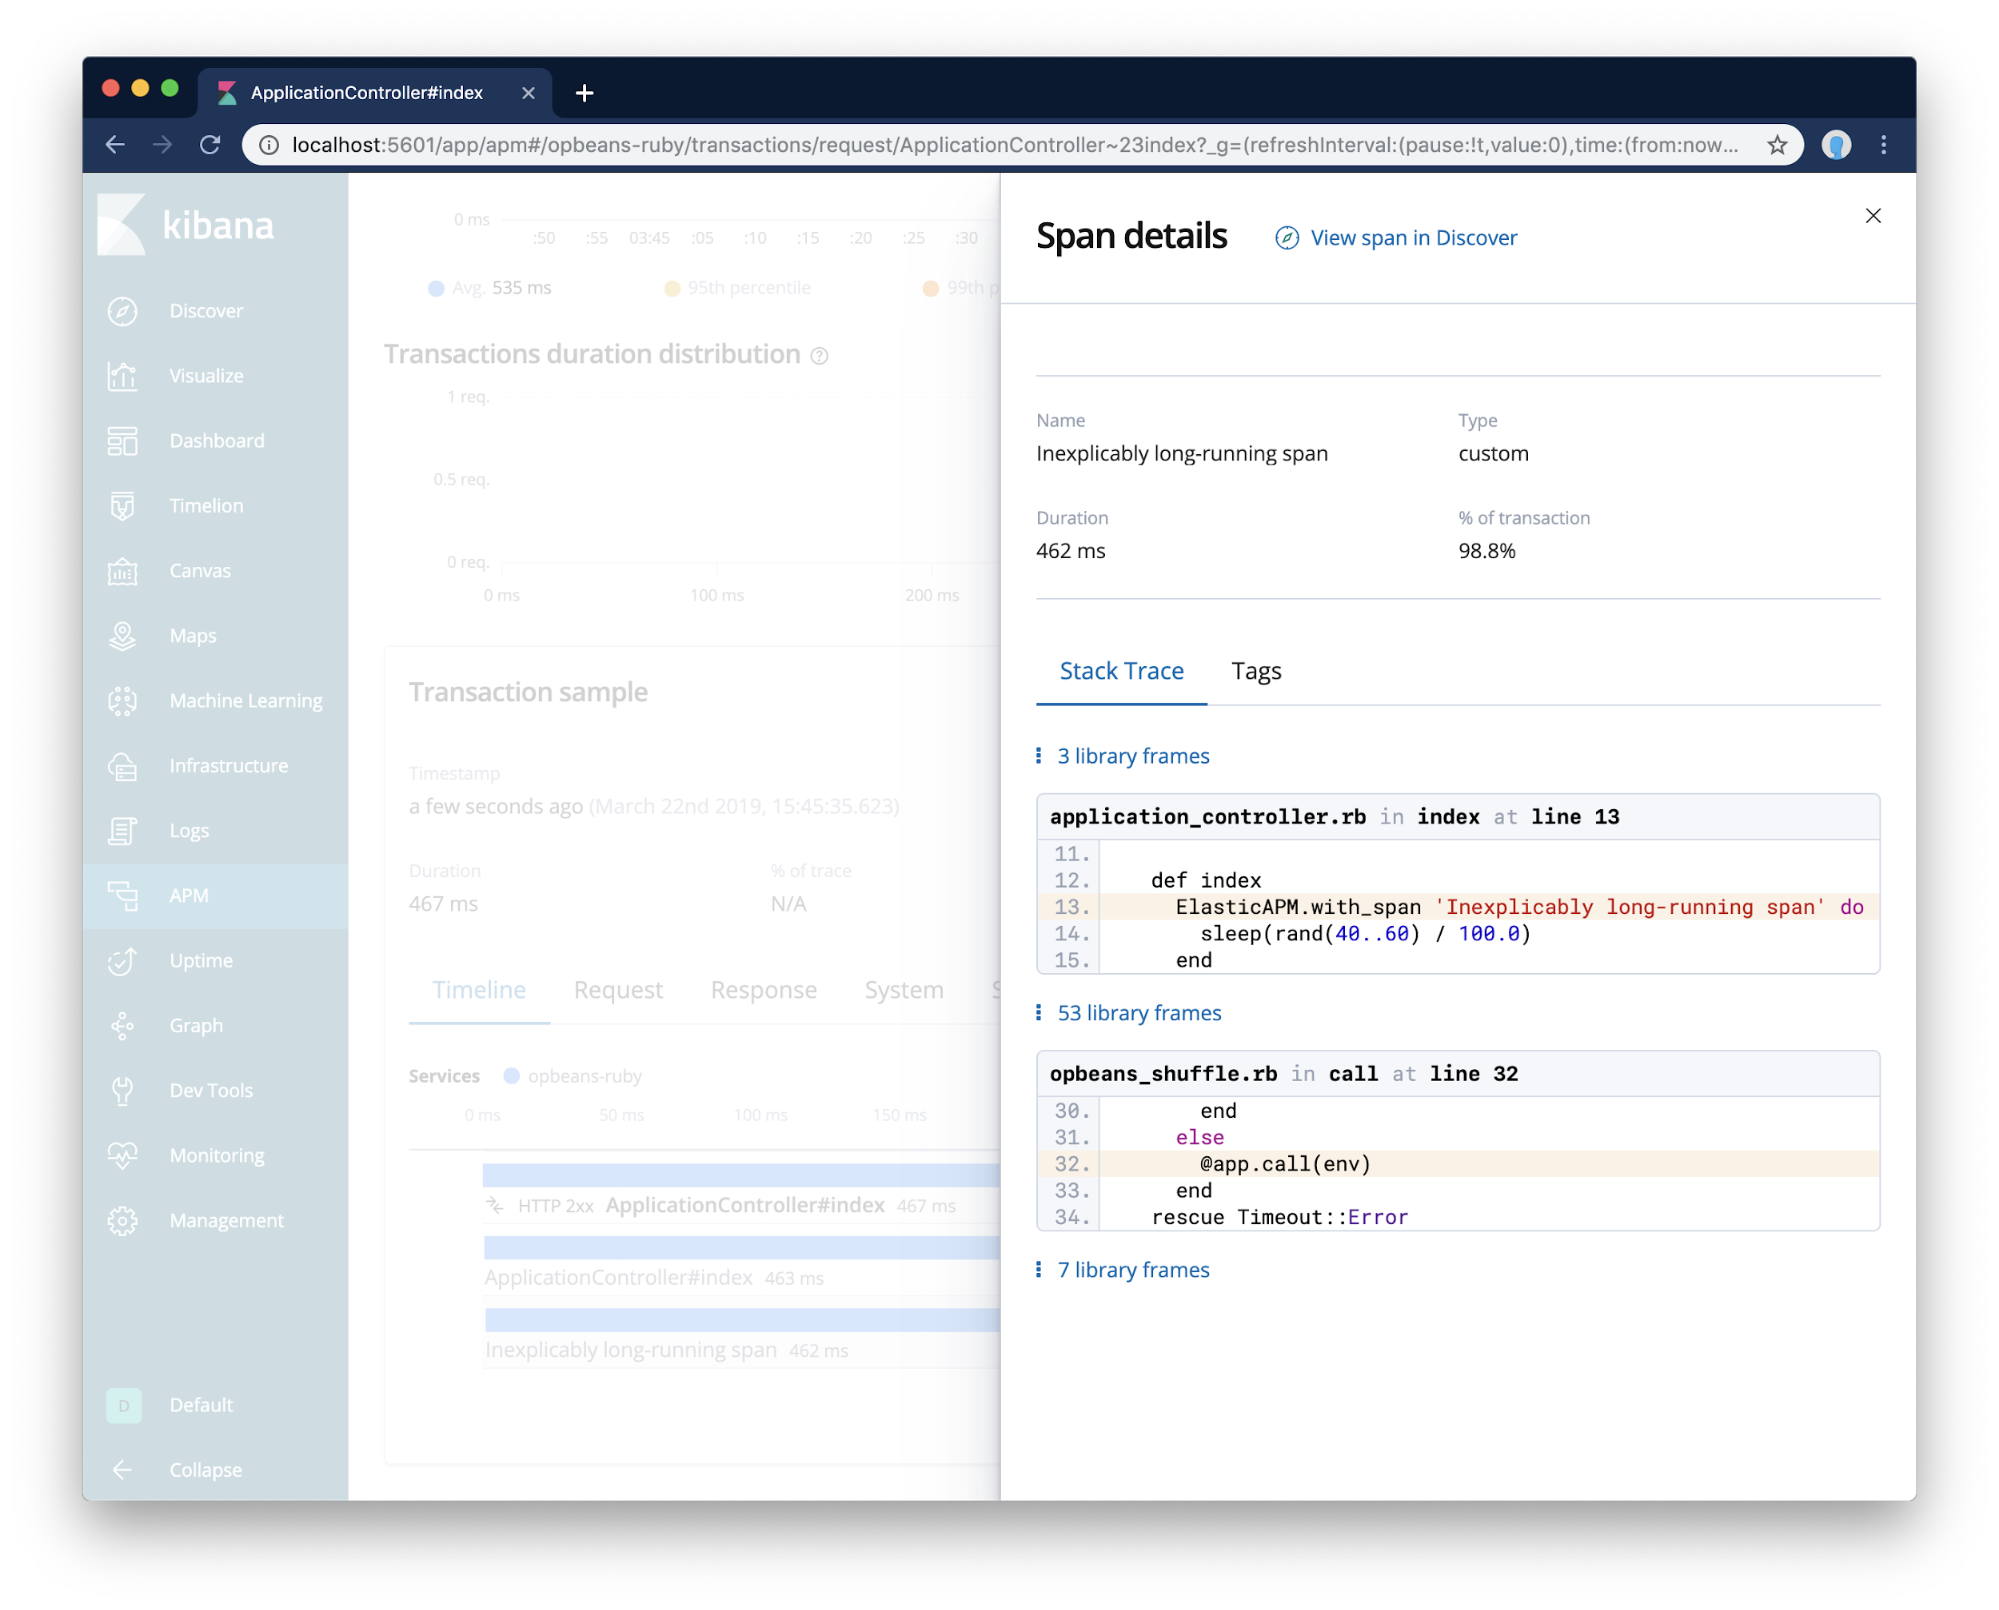
Inside transactions, spans are the individual pieces of work that your app performs. If you are using any of the automatically instrumented libraries all you have to do is wrap them in a transaction.
If you need additional spans, the API matches the transaction:
begin
  span = ElasticAPM.start_span 'Required name', 'optional.type'
ensure
  ElasticAPM.end_span
end

# Or the block form
ElasticAPM.with_span 'Hard work' do |span|
  # ...
end
See the APM Ruby agent docs for the public API.
Easy to get going, easy to expand
We've done our best to make the initial, minimal setup of the Ruby APM agent as easy as possible. If you don't want to, you don't need any of the above and you will still, most likely, get a lot of usable information.
However, if you'd like to get your hands dirty dissecting every part of the beast that is your app, Elastic APM provides the tools to do that, too.
Try it out
How well is your Ruby running? Where is it spending its time? Where should you focus your next sprint to improve the user experience? Elastic APM and the Ruby agent can help answer all of these questions, and more. Instrument your app, and either download the Elastic stack and run locally, or send your traces to the Elasticsearch Service on Elastic Cloud with a free trial, which includes an APM server. As always, if you have any questions, ideas, thoughts, or concerns, reach out on the Discuss forum.

