How to instrument your Go app with the Elastic APM Go agent
Elastic APM (application performance monitoring) provides rich insights into application performance and visibility for distributed workloads, with official support for a number of languages including Go, Java, Ruby, Python, and JavaScript (Node.js and real user monitoring (RUM) for the browser).
To gain these insights into performance you must instrument your application. Instrumentation is the act of altering the application’s code in order to measure its behaviour. For some of the supported languages, all that is needed is to install an agent. For example, Java applications can be automatically instrumented using a simple ‑javaagent flag, which uses bytecode instrumentation — this is the process of manipulating the compiled Java byte code, typically when a Java class is loaded when the program starts. In addition to this, it is common for a single thread to take control of an operation from start to end, so thread-local storage can be used to correlate operations.
Go programs are, generally speaking, compiled to native machine code, which is not so amenable to automated instrumentation. Moreover, the threading model of Go programs is unlike most other languages. In a Go program, a “goroutine” which executes code may move between operating system threads, and logical operations often span multiple goroutines. So then, how do you instrument a Go application?
In this article, we will look at how to instrument a Go application with Elastic APM, in order to capture detailed response time performance data (tracing), capture infrastructure and application metrics, and to integrate with logging — the observability trifecta. We will build up an application and its instrumentation throughout the article, covering the following topics in order:
- Web requests
- SQL queries
- Custom spans
- Outgoing HTTP requests
- Panic tracking
- Logging integration
- Infrastructure and application metrics
Tracing web requests
The Elastic APM Go agent provides an API for “tracing” operations, such as incoming requests to a server. Tracing an operation involves recording events describing the operation, e.g. operation name, type/category, and some attributes like the source IP, authenticated user, etc. The event will also record when the operation started, how long it took, and identifiers describing the operation’s lineage.
The Elastic APM Go agent supplies a number of modules for instrumenting various web frameworks, RPC frameworks, database drivers; and for integrating with several logging frameworks. Check out the full list of the supported technologies.
Let’s add Elastic APM instrumentation to a simple web service using the gorilla/mux router, and show how we would go about capturing its performance via Elastic APM.
Here is the original, uninstrumented code:
package main
import (
        "fmt"
        "log"
        "net/http"
        "github.com/gorilla/mux"
)
func helloHandler(w http.ResponseWriter, req *http.Request) {
        fmt.Fprintf(w, "Hello, %s!\n", mux.Vars(req)["name"])
}
func main() {
        r := mux.NewRouter()
        r.HandleFunc("/hello/{name}", helloHandler)
        log.Fatal(http.ListenAndServe(":8000", r))
}
To instrument the requests served by the gorilla/mux router, you will need a recent version of gorilla/mux (v1.6.1 or newer) with support for middleware. Then, all you need to do is import go.elastic.co/apm/module/apmgorilla, and add the following line of code:
r.Use(apmgorilla.Middleware())
The apmgorilla middleware will report each request as a transaction to the APM Server. Let’s take a little break from instrumentation, and see how that looks in the APM UI.
Visualising performance
We’ve instrumented our web service, but it has nowhere to send the data. By default, the APM agents will attempt to send data to an APM Server at http://localhost:8200. Let’s set up a fresh stack, using the recently released Elastic Stack 7.0.0. You can download the default deployment of the stack for free, or you can start a 14-day free trial of the Elasticsearch Service on Elastic Cloud. If you would rather run your own, you may find the example Docker Compose configuration at https://github.com/elastic/stack-docker.
Once you have set up the stack, you can configure your application to send data to the APM Server. You will need to know the APM Server’s URL and secret token. When using Elastic Cloud, these can be found on the “Activity” page during deployment, and on the “APM” page after deployment completes. During the deployment, you should also take note of the password for Elasticsearch and Kibana, as you won’t be able to see it again afterwards (though you can reset it if necessary).
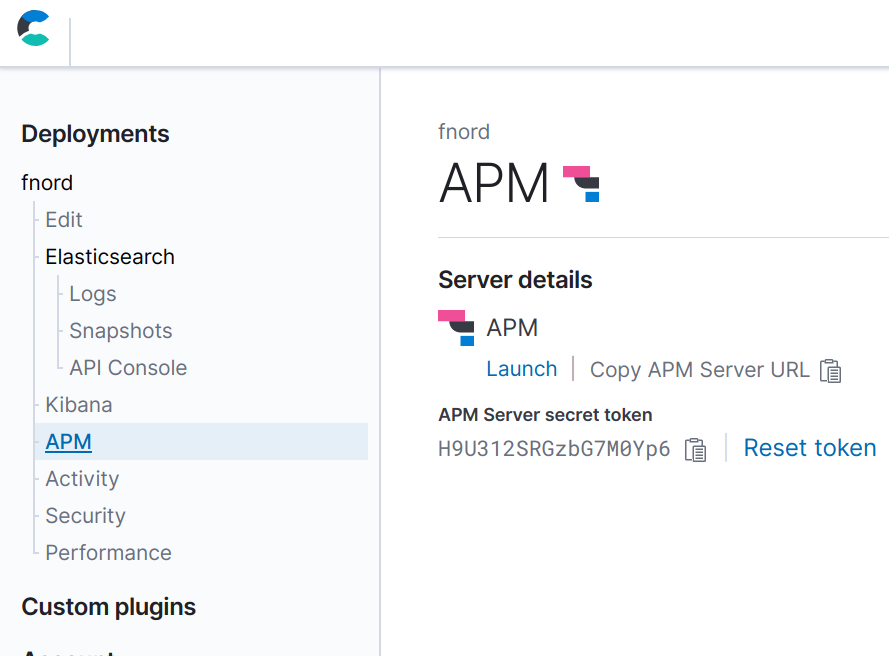
The APM Go agent is configured via environment variables. To configure the APM Server URL and secret token, export the following environment variables so they will get picked up by your application:
export ELASTIC_APM_SERVER_URL=https://bdf8658ddda74d47af1875242c3ef203.apm.europe-west1.gcp.cloud.es.io:443
export ELASTIC_APM_SECRET_TOKEN=H9U312SRGzbG7M0Yp6
Now if we run the instrumented program, we should see some data in the APM UI before long. The agent will periodically send metrics: CPU and memory usage, and Go runtime statistics. Whenever a request is served, the agent will also record a transaction; these are buffered and sent in batches, by default, every 10 seconds. So, let’s run the service, send some requests, and see what happens.
In order to see that events are being sent to the APM Server successfully, we can set a couple of additional environment variables:
export ELASTIC_APM_LOG_FILE=stderr
export ELASTIC_APM_LOG_LEVEL=debug
Now, start the application (hello.go contains the instrumented program from before):
go run hello.go
Next we’ll use github.com/rakyll/hey to send some requests to the server:
go get -u github.com/rakyll/hey
hey http://localhost:8000/hello/world
In the application’s output, you should see something like this:
{"level":"debug","time":"2019-03-28T20:33:56+08:00","message":"sent request with 200 transactions, 0 spans, 0 errors, 0 metricsets"}
And in the output of hey, you should see various statistics, including a histogram of the response time latencies. If we now open up Kibana and navigate to the APM UI, then we should see a service called “hello”, with one transaction group called “/hello/{name}”. Let’s see:
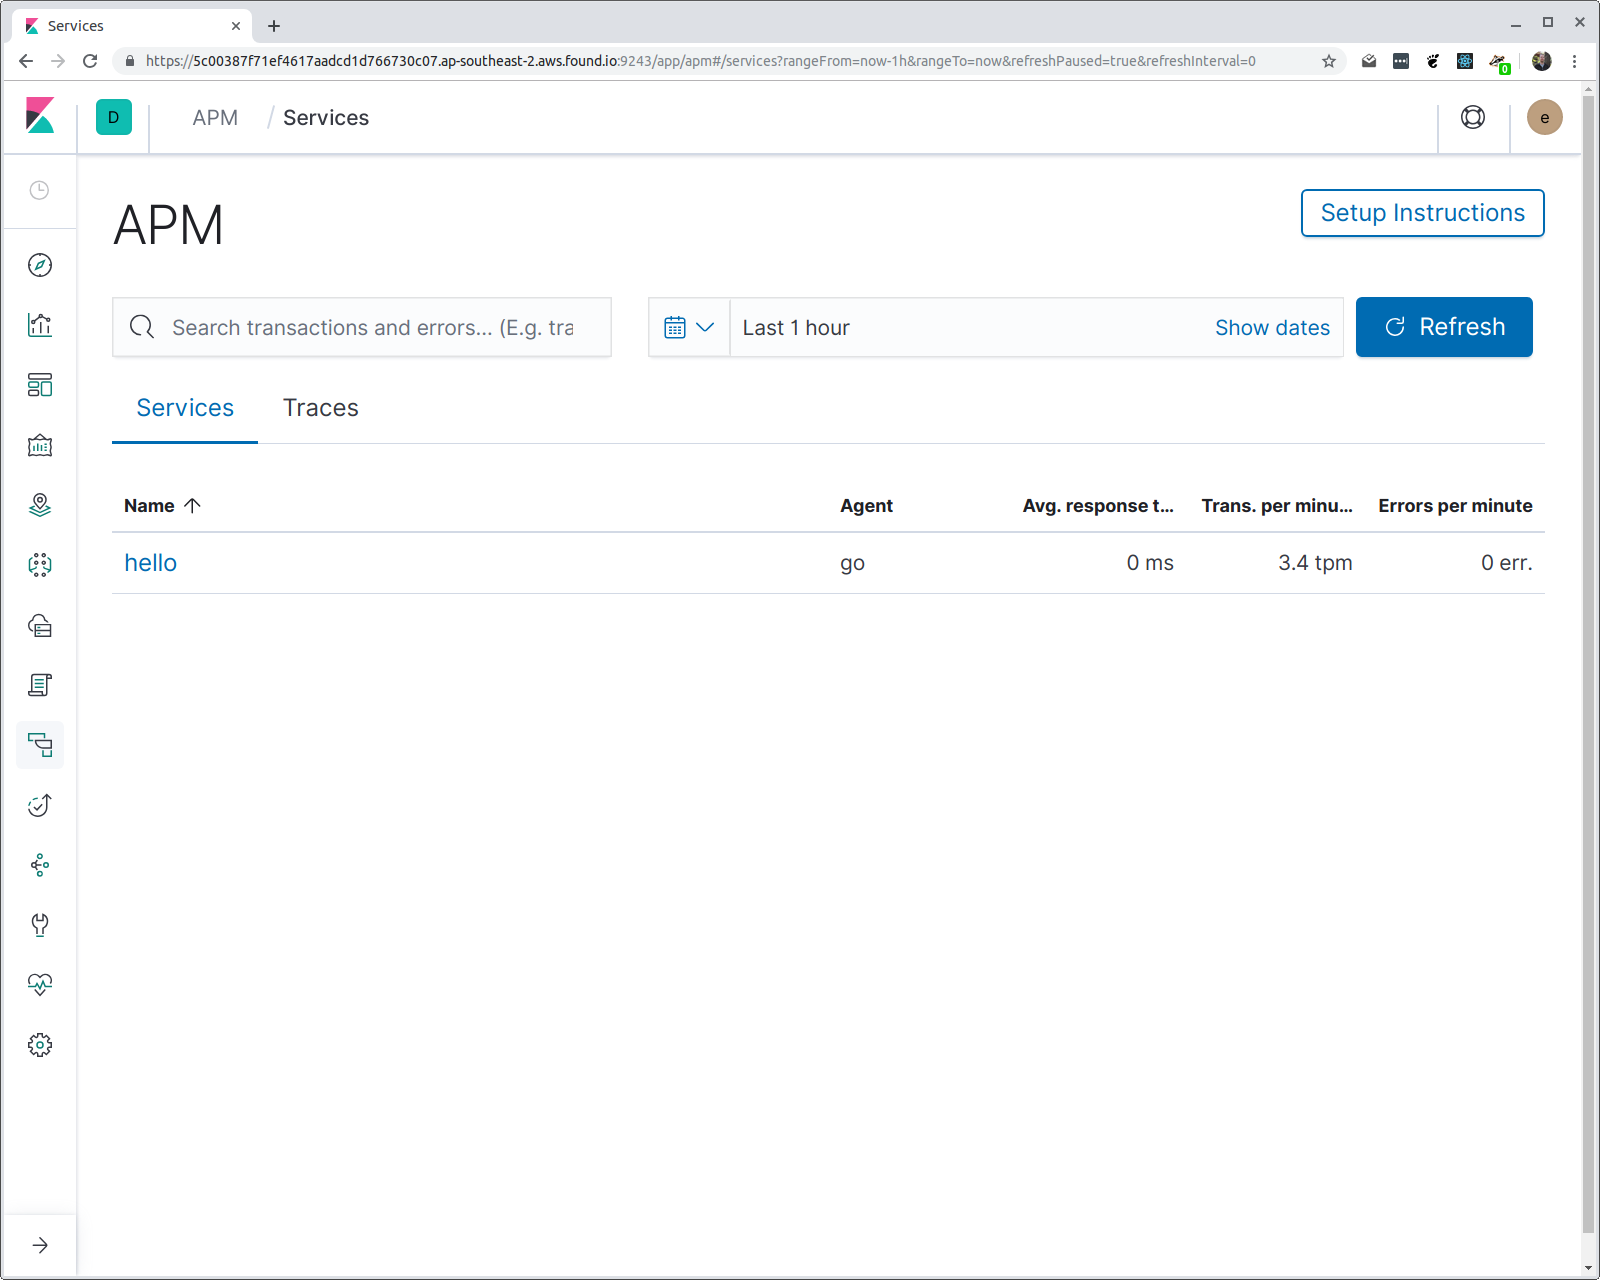
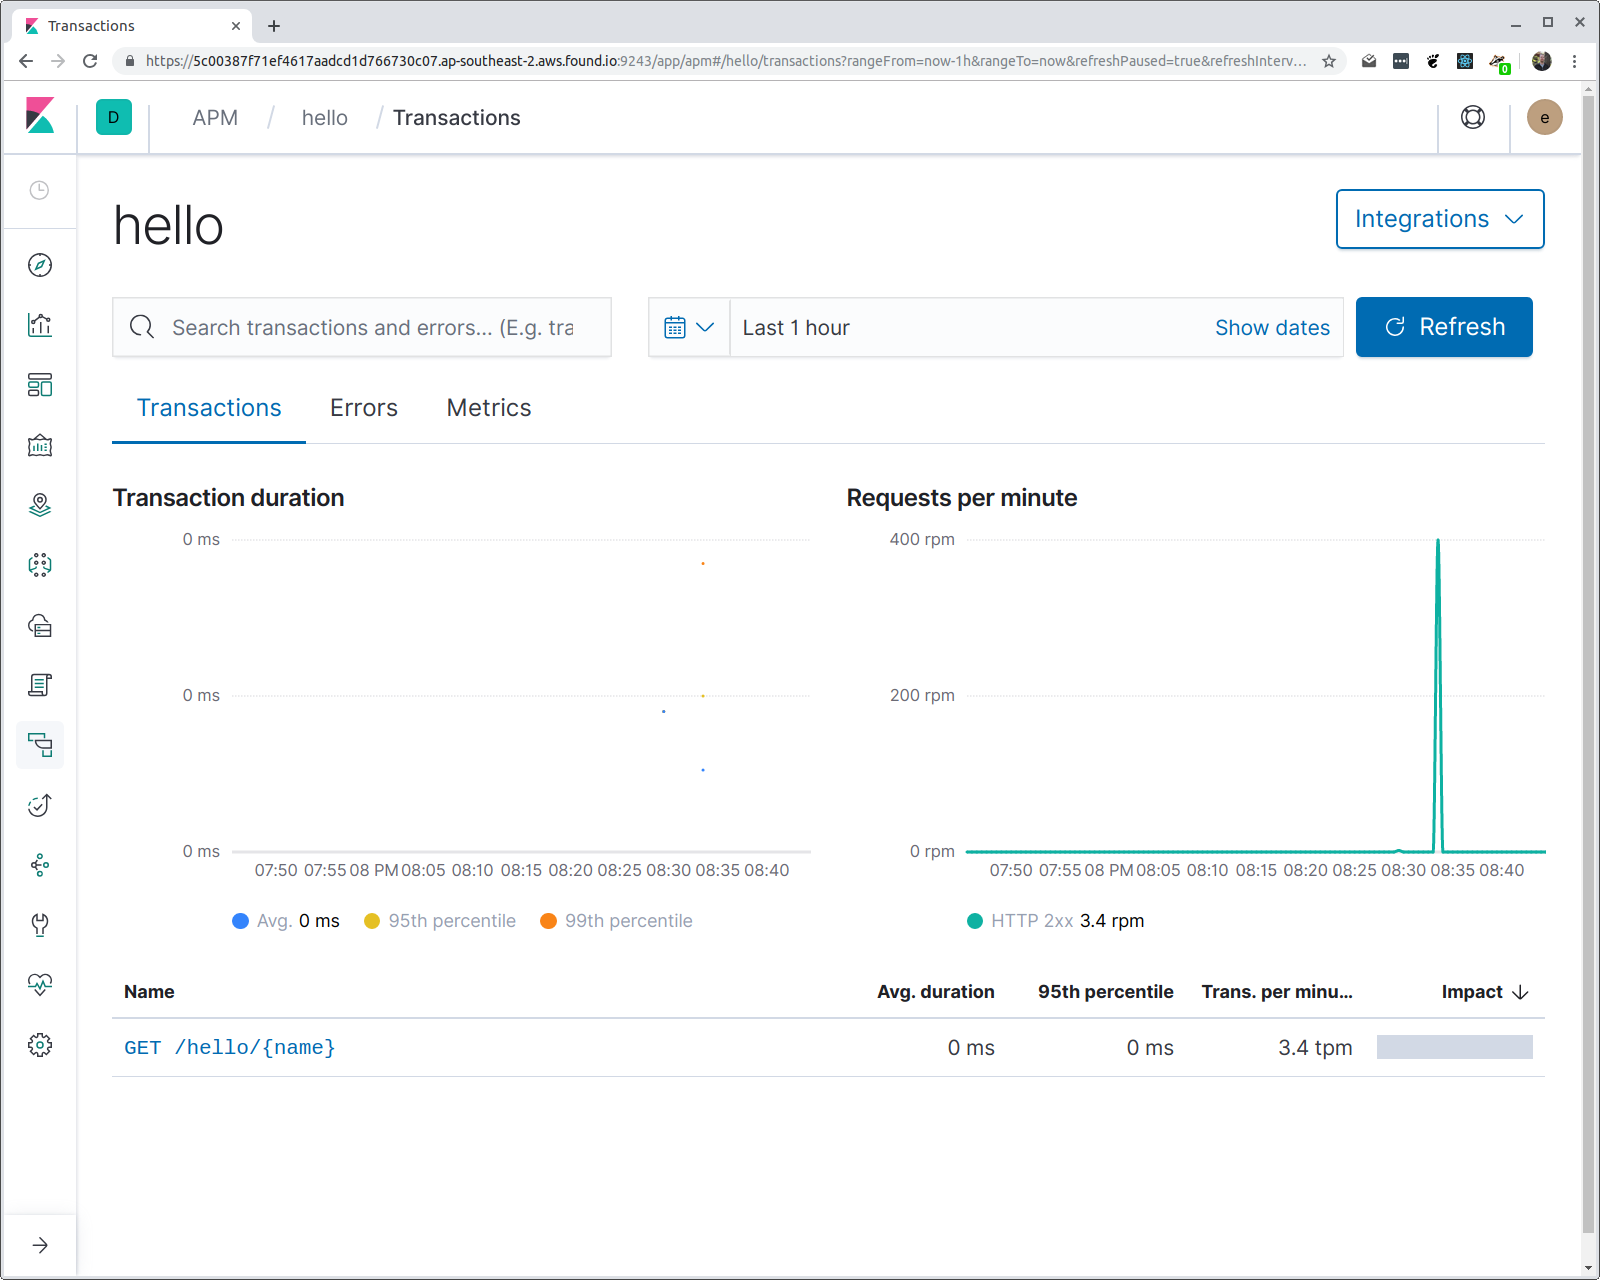
You might be wondering a couple of things: how does the agent know what name to give the service, and why is the route pattern used rather than the request URI? The first one is easy: if you don’t specify the service name (via an environment variable), then the program binary name is used. In this case, the program is compiled to a binary named “hello”.
The reason the route pattern is used is to enable aggregations. If we now click on the transaction, then we can see a histogram of the response time latencies.
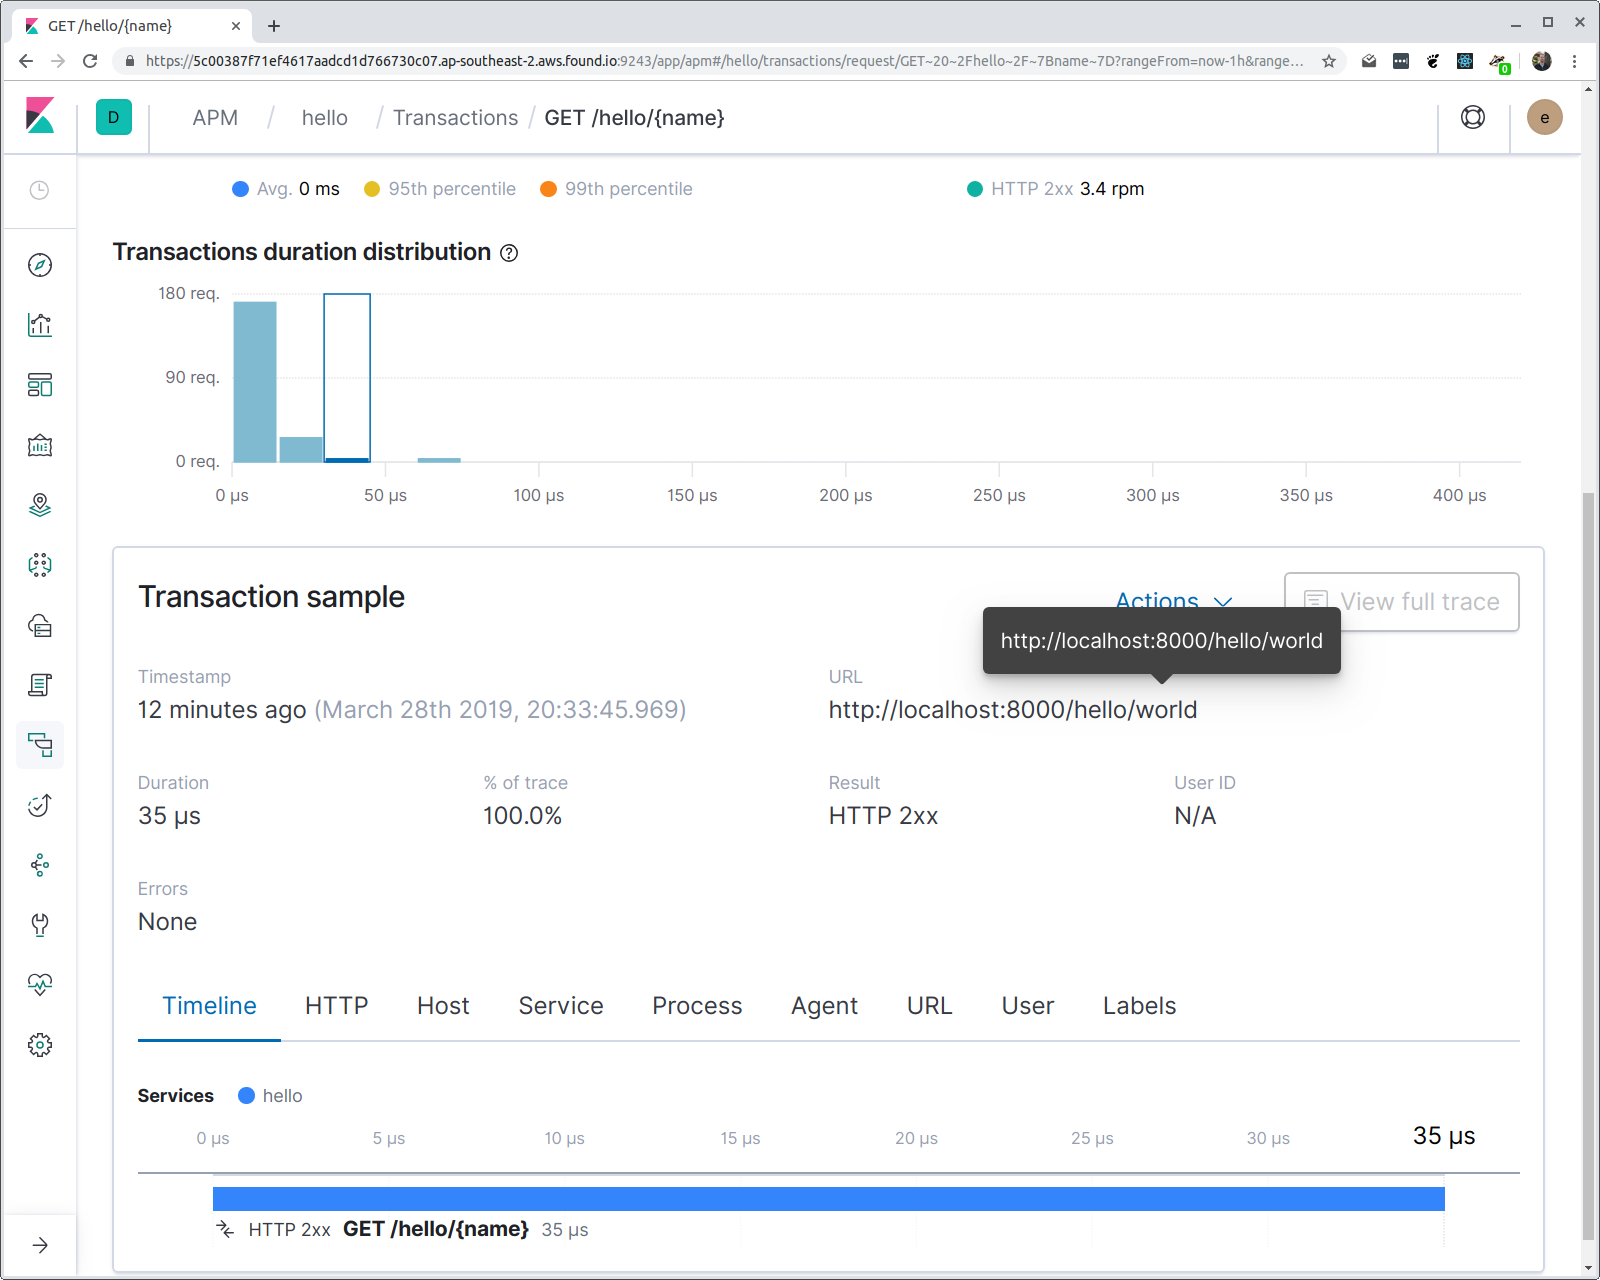
Note that even though we’re aggregating on the route pattern, the full requested URL is available in the transaction properties.
Tracing SQL queries
In a typical application, you will have more complex logic involving external services such as databases, caches, and so on. When you’re trying to diagnose performance issues in your application, being able to see the interactions with these services is crucial.
Let’s take a look at how we can observe the SQL queries made by our Go application.
For the purposes of demonstration we’ll use an embedded SQLite database, but so long as you’re using database/sql, it doesn’t matter which driver you use.
To trace database/sql operations, we provide the instrumentation module go.elastic.co/apm/module/apmsql. The apmsql module instruments database/sql drivers in order to report database operations as spans within a transaction. To use this module, you’ll need to make changes to how you register and open the database driver.
Typically in an application you’ll import a database/sql driver package to register the driver, e.g.
import _ “github.com/mattn/go-sqlite3” // registers the “sqlite3” driver
We provide several convenience packages to do the same, but which register instrumented versions of the same drivers. e.g. for SQLite3, you would instead import as follows:
import _ "go.elastic.co/apm/module/apmsql/sqlite3"
Underneath the covers, this uses the apmsql.Register method, which is equivalent to calling sql.Register, but instruments the registered driver. Whenever you use apmsql.Register you must use apmsql.Open to open a connection, instead of using sql.Open:
import (
        “go.elastic.co/apm/module/apmsql”
        _ "go.elastic.co/apm/module/apmsql/sqlite3"
)
var db *sql.DB
func main() {
        var err error
        db, err = apmsql.Open("sqlite3", ":memory:")
        if err != nil {
                log.Fatal(err)
        }
        if _, err := db.Exec("CREATE TABLE stats (name TEXT PRIMARY KEY, count INTEGER);"); err != nil {
                log.Fatal(err)
        }
        ...
}
Earlier we mentioned that, unlike in many other languages, in Go there’s no thread-local storage facility for tying related operations together. Instead, you must explicitly propagate context. When we start recording a transaction for a web request, we store a reference to the in-progress transaction in the request context, available through the net/http.Request.Context method. Let’s see how this looks by recording how many times each name has been seen, reporting the database queries to Elastic APM.
var db *sql.DB
func helloHandler(w http.ResponseWriter, req *http.Request) {
        vars := mux.Vars(req)
        name := vars[“name”]
        requestCount, err := updateRequestCount(req.Context(), name)
        if err != nil {
                panic(err)
        }
        fmt.Fprintf(w, "Hello, %s! (#%d)\n", name, requestCount)
}
// updateRequestCount increments a count for name in db, returning the new count.
func updateRequestCount(ctx context.Context, name string) (int, error) {
        tx, err := db.BeginTx(ctx, nil)
        if err != nil {
                return -1, err
        }
        row := tx.QueryRowContext(ctx, "SELECT count FROM stats WHERE name=?", name)
        var count int
        switch err := row.Scan(&count); err {
        case nil:
                count++
                if _, err := tx.ExecContext(ctx, "UPDATE stats SET count=? WHERE name=?", count, name); err != nil {
                        return -1, err
                }
        case sql.ErrNoRows:
                count = 1
                if _, err := tx.ExecContext(ctx, "INSERT INTO stats (name, count) VALUES (?, ?)", name, count); err != nil {
                        return -1, err
                }
        default:
                return -1, err
        }
        return count, tx.Commit()
}
There are two crucial bits to point out about this code:
- We’re using the database/sql *Context methods (ExecContext, QueryRowContext)
- We pass the context from the enclosing request into those method calls.
The apmsql-instrumented database driver expects to find a reference to the in-progress transaction in the provided context; this is how the reported database operation is associated with the request handler that is calling it. Let’s send some requests to this revamped service, and see how it looks:
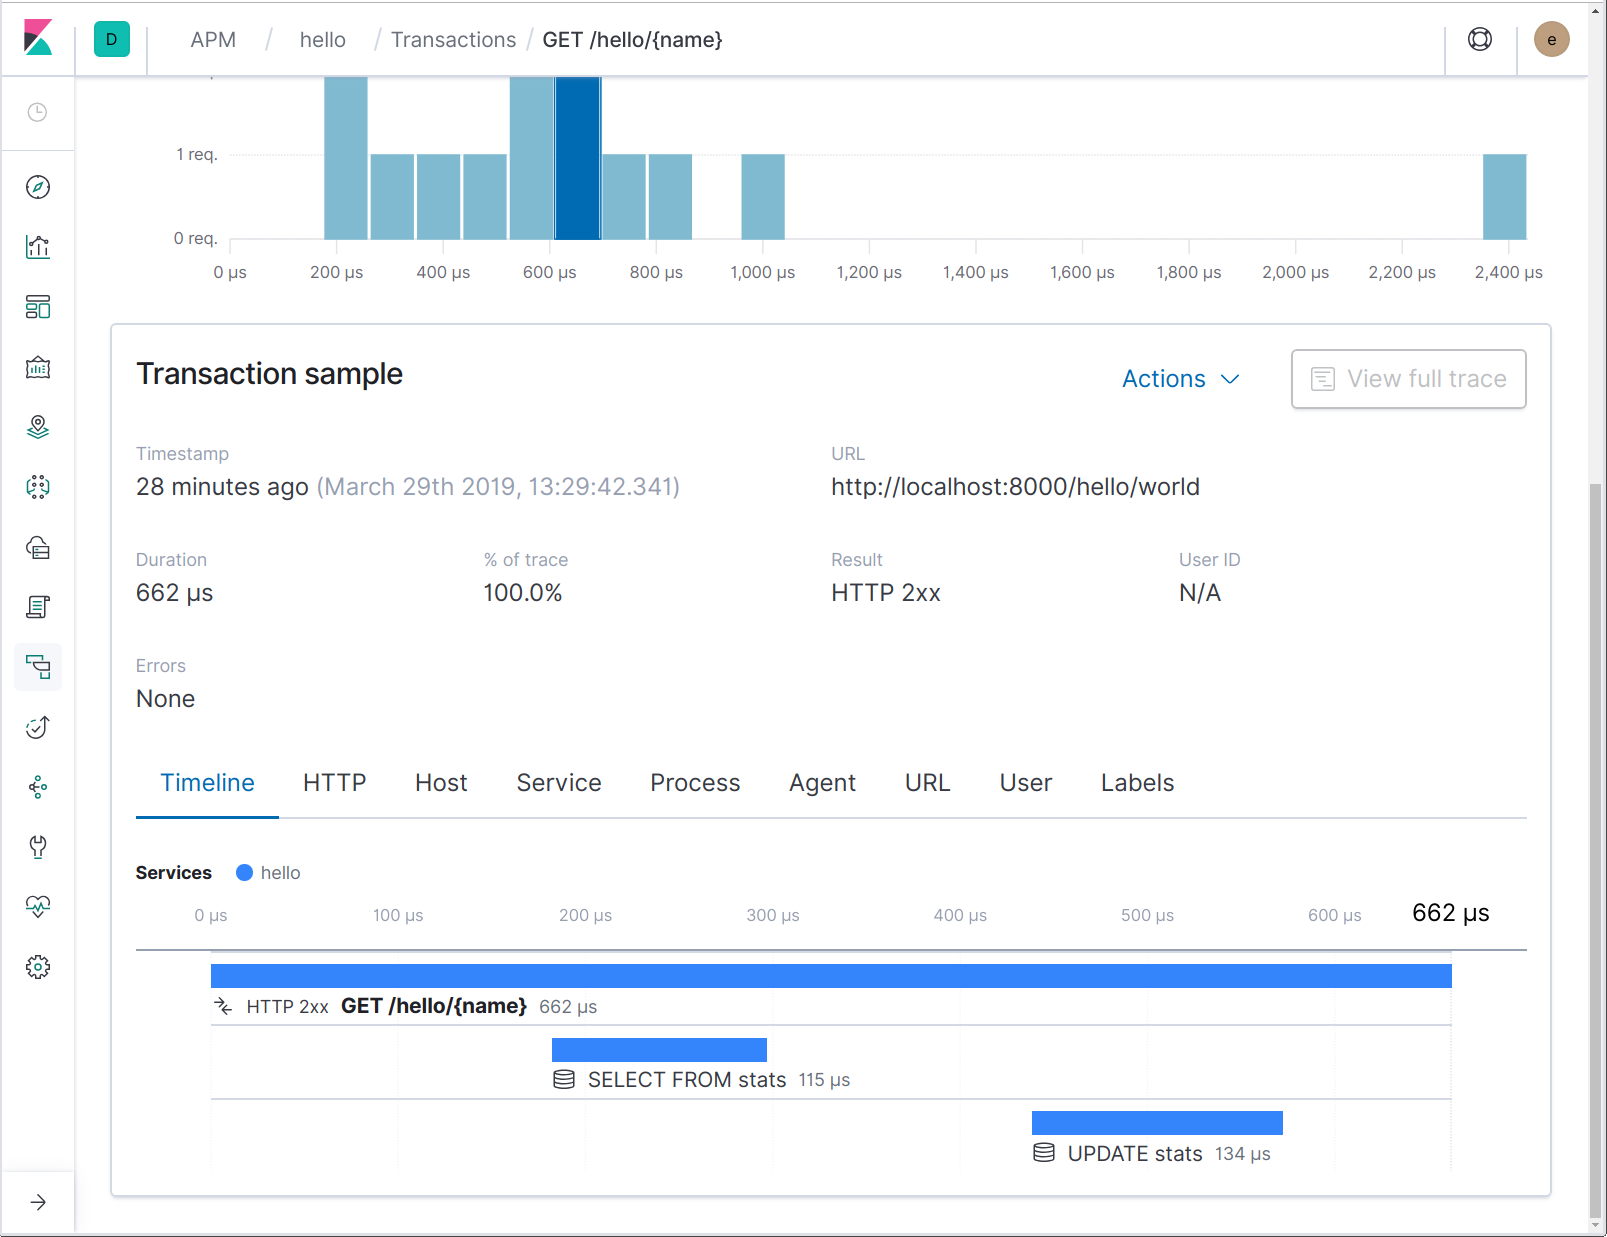
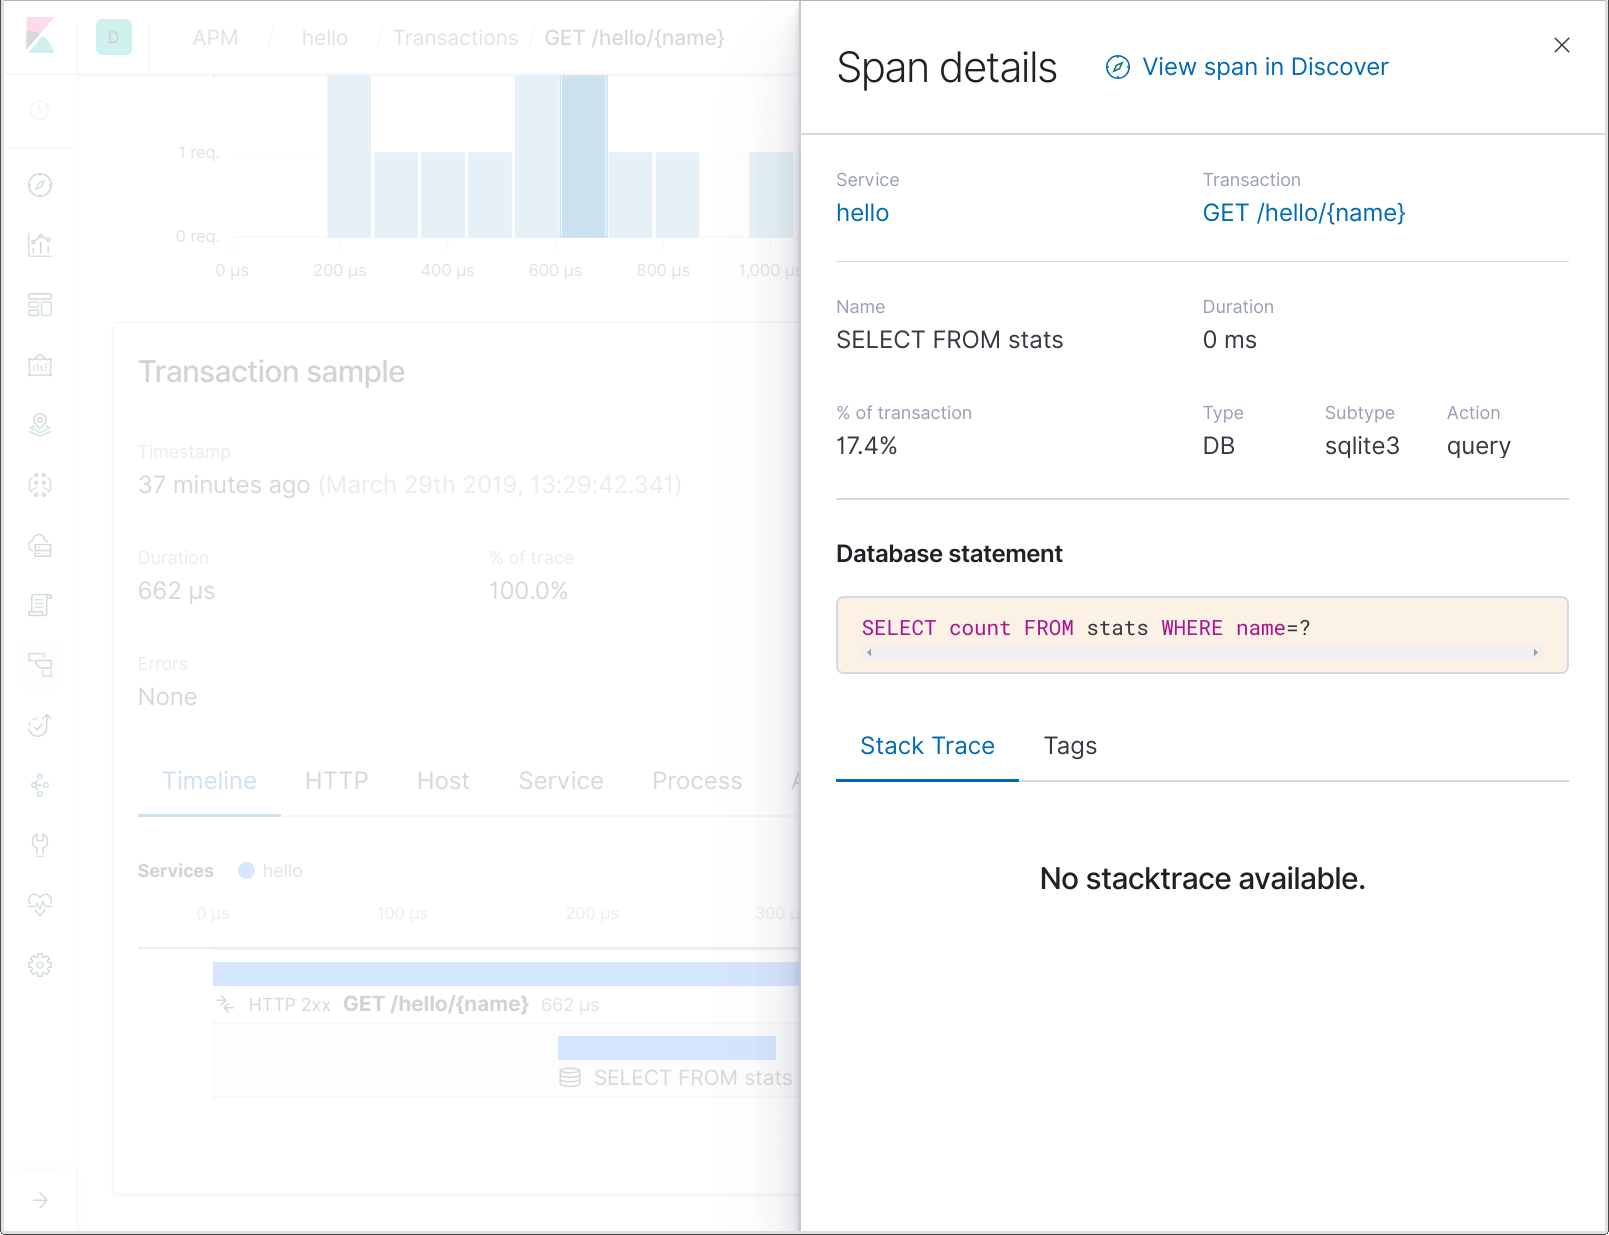
Notice that the database span names do not hold the complete SQL statement, but just a portion thereof. This enables one to more easily aggregate the spans representing operations on a certain table name, for instance. By clicking on the span, you can see the full SQL statement in the span details:
Tracing custom spans
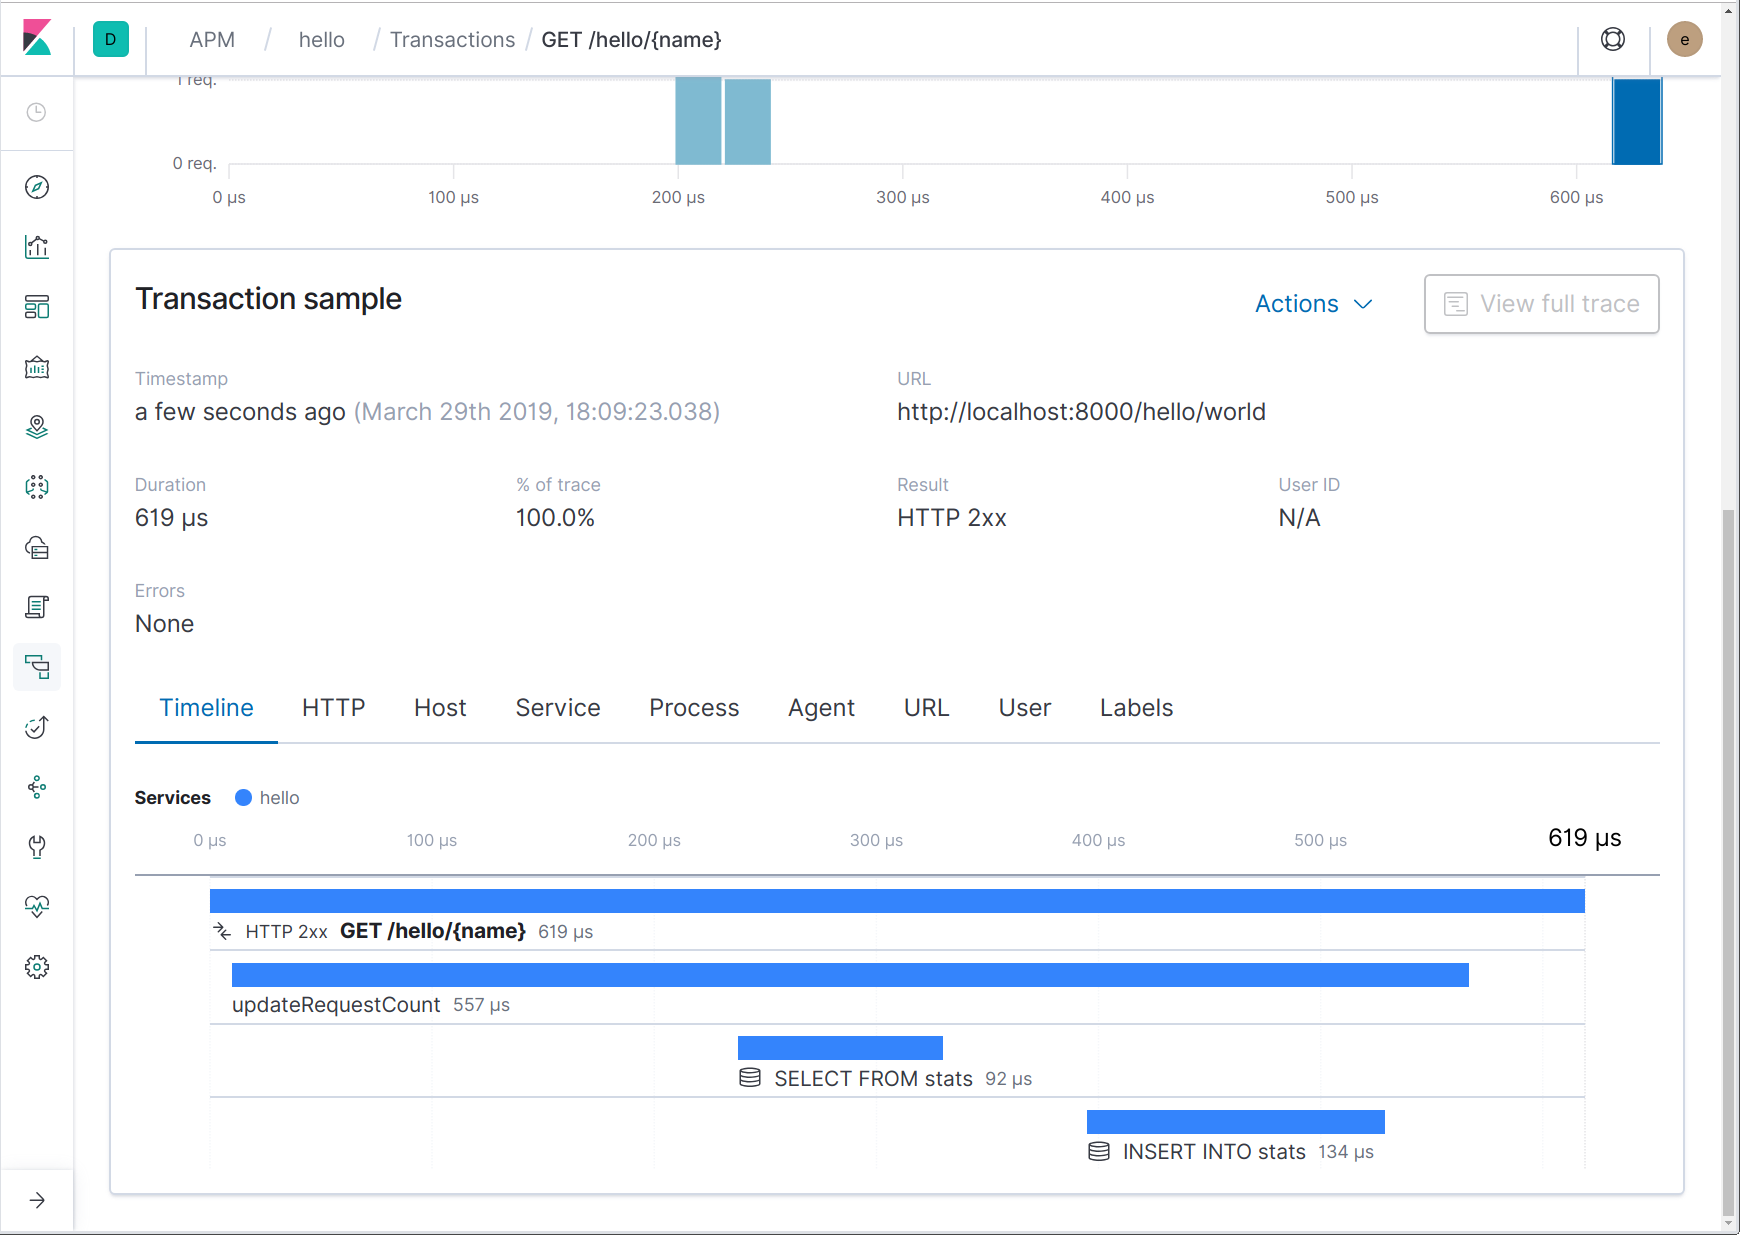
In the previous section we introduced database query spans to our traces. If you know the service well, you may immediately know that those two queries are part of the same operation (query and then update a counter); someone else may not. Moreover, if there is any significant processing going on between or around those queries, then it may be useful to attribute that to the “updateRequestCount” method. We can do this by reporting a custom span for that function.
You can report a custom span in various ways, the easiest of which is by using apm.StartSpan. You must pass this function a context that contains a transaction, and a span name and type. Let’s create a span called “updateRequestCount”:
func updateRequestCount(ctx context.Context, name string) (int, error) {
    span, ctx := apm.StartSpan(ctx, “updateRequestCount”, “custom”)
    defer span.End()
    ...
}
As we can see from the code above, apm.StartSpan returns a span and a new context. That new context should be used in place of the context passed in; it contains the new span. Here’s how it looks in the UI now:
Tracing outgoing HTTP requests
What we’ve described so far is really single-process tracing. Even through multiple services are involved, we’re only tracing within one process: incoming requests, and database queries from the client perspective.
Microservices have become increasingly commonplace in recent years. Before the advent of microservices, service-oriented architecture (SOA) was another popular approach to breaking apart monolithic applications into modular components. The effect, in either case, is an increase in complexity, which complicates observability. Now we not only have to associate operations within a process, but also between processes, and potentially (probably) on different machines, even different data centres or third-party services.
How we handle tracing within and between processes in the Elastic APM Go agent is much the same. For example, to trace an outgoing HTTP request, you must instrument the HTTP client, and ensure the enclosing request context is propagated to the outgoing request. The instrumented client will use this to create a span, and also to inject headers into the outgoing HTTP request. Let’s see how that looks in practice:
// apmhttp.WrapClient instruments the given http.Client
client := apmhttp.WrapClient(http.DefaultClient)
// If “ctx” contains a reference to an in-progress transaction, then the call below will start a new span.
resp, err := client.Do(req.WithContext(ctx))
…
resp.Body.Close() // the span is ended when the response body is consumed or closed
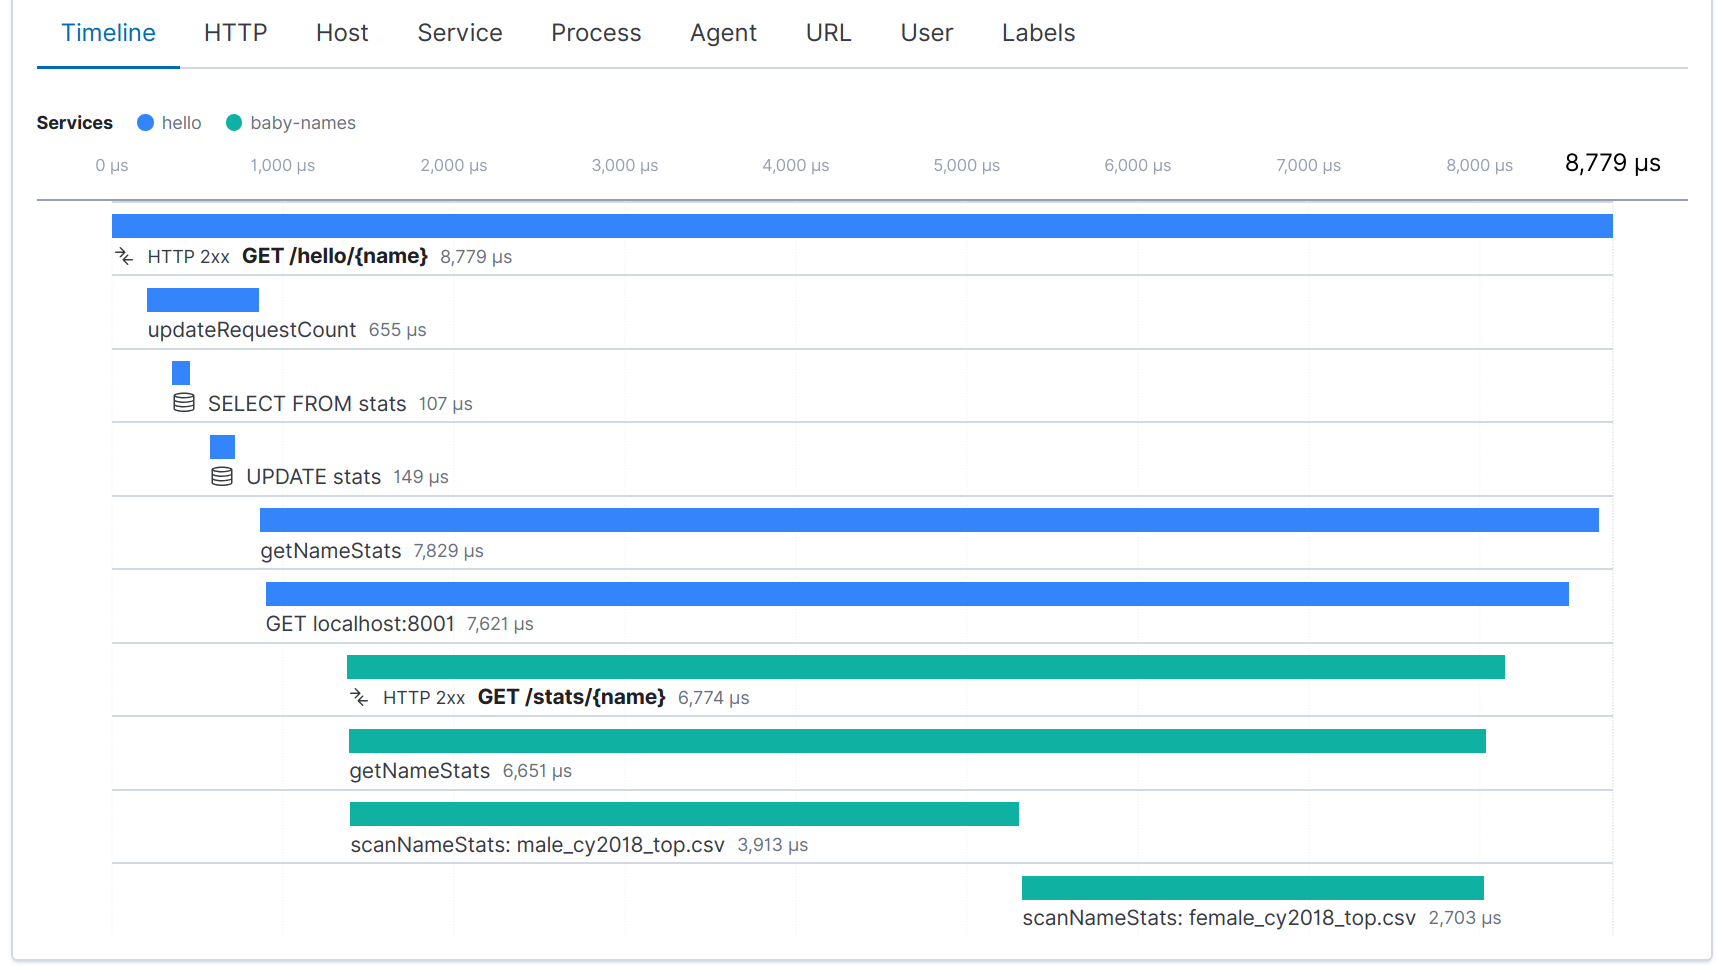
If this outgoing request is handled by another application instrumented with Elastic APM, you will end up with a “distributed trace” — a trace (collection of related transactions and spans) that crosses services. The instrumented client will inject a header identifying the span for the outgoing HTTP request, and the receiving service will extract that header and use it to correlate the client span with the transaction it records. This all handled by the various web framework instrumentation modules provided under go.elastic.co/apm/module.
To demonstrate this, let’s extend our service to add some trivia to the response: the number of babies born with the given name in 2018, in South Australia. The “hello” service will obtain this information from a second service via an HTTP-based API. The code for this second service is omitted for brevity, but you can imagine it is implemented and instrumented in much the same way as the “hello” service.
func helloHandler(w http.ResponseWriter, req *http.Request) {
        ...
        stats, err := getNameStats(req.Context(), name)
        if err != nil {
                panic(err)
        }
        fmt.Fprintf(w, "Hello, %s! (#%d)\n", name, requestCount)
        fmt.Fprintf(w, "In %s, %d: ", stats.Region, stats.Year)
        switch n := stats.Male.N + stats.Female.N; n {
        case 1:
                fmt.Fprintf(w, "there was 1 baby born with the name %s!\n", name)
        default:
                fmt.Fprintf(w, "there were %d babies born with the name %s!\n", n, name)
        }
}
type nameStatsResults struct {
        Region string
        Year   int
        Male   nameStats
        Female nameStats
}
type nameStats struct {
        N    int
        Rank int
}
func getNameStats(ctx context.Context, name string) (nameStatsResults, error) {
        span, ctx := apm.StartSpan(ctx, "getNameStats", "custom")
        defer span.End()
        req, _ := http.NewRequest("GET", "http://localhost:8001/stats/"+url.PathEscape(name),
 nil)
        // Instrument the HTTP client, and add the surrounding context to the request.
        // This will cause a span to be generated for the outgoing HTTP request, including
        // a distributed tracing header to continue the trace in the target service.
        client := apmhttp.WrapClient(http.DefaultClient)
        resp, err := client.Do(req.WithContext(ctx))
        if err != nil {
                return nameStatsResults{}, err
        }
        defer resp.Body.Close()
        var res nameStatsResults
        if err := json.NewDecoder(resp.Body).Decode(&res); err != nil {
                return nameStatsResults{}, err
        }
        return res, nil
}
With both services instrumented, we now see a distributed trace for each request to the “hello” service:
You can read more about the topic of distributed tracing in Adam Quan’s blog post, Distributed Tracing, OpenTracing and Elastic APM.
Exception Panic tracking
As we’ve seen, the web framework instrumentation modules provide middleware that record transactions. In addition to this, they will also capture panics and report them to Elastic APM, to assist in the investigation of failed requests. Let’s try this out by modifying updateRequestCount to panic when it sees non-ASCII characters:
func updateRequestCount(ctx context.Context, name string) (int, error) {
    span, ctx := apm.StartSpan(ctx, “updateRequestCount”, “custom”)
    defer span.End()
    if strings.IndexFunc(name, func(r rune) bool {return r >= unicode.MaxASCII}) >= 0 {
        panic(“non-ASCII name!”)
    }
    ...
}
Now send a request with some non-ASCII characters:
curl -f http://localhost:8000/hello/世界
curl: (22) The requested URL returned error: 500 Internal Server Error
Hmm! What could be the problem? Let’s go take a look in the APM UI, on the Errors page for the “hello” service:
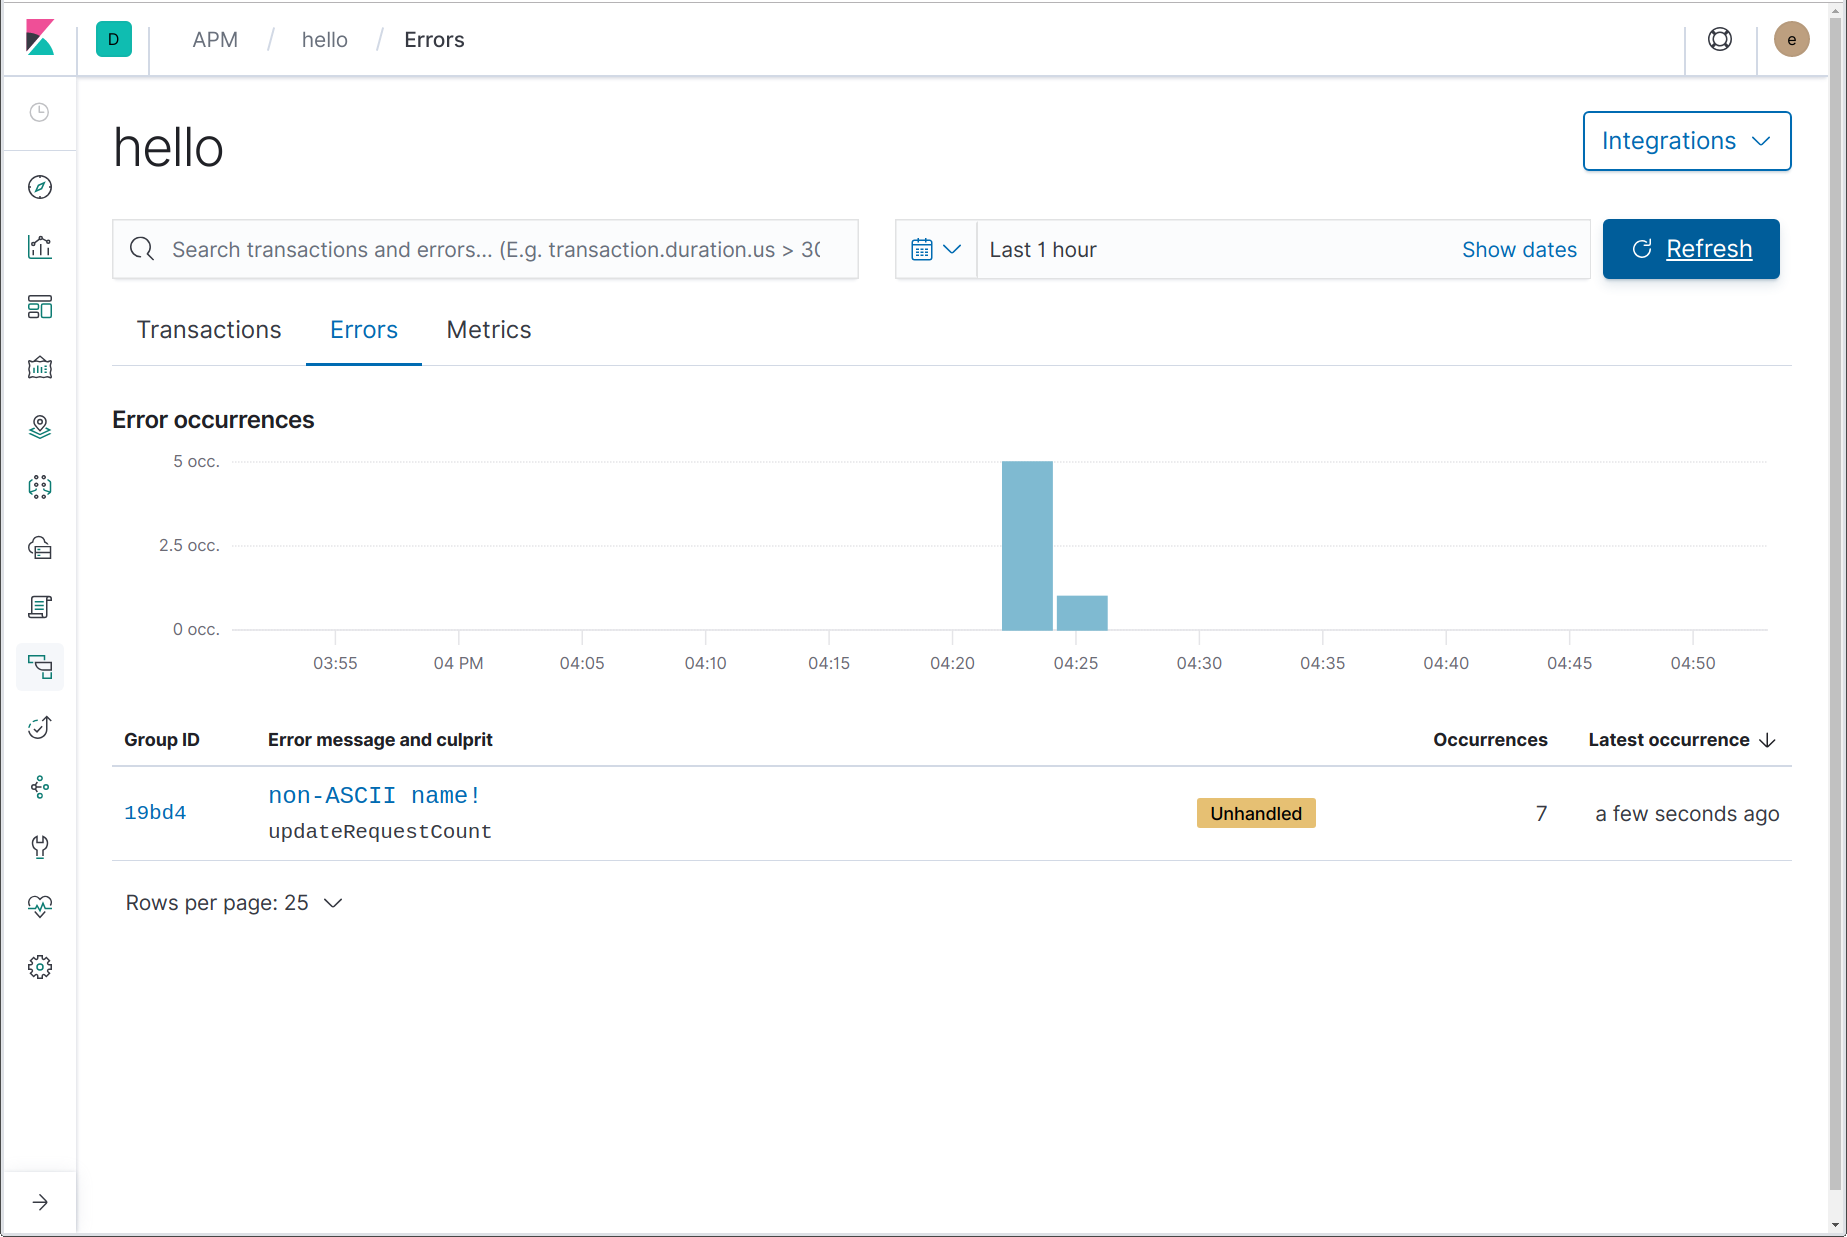
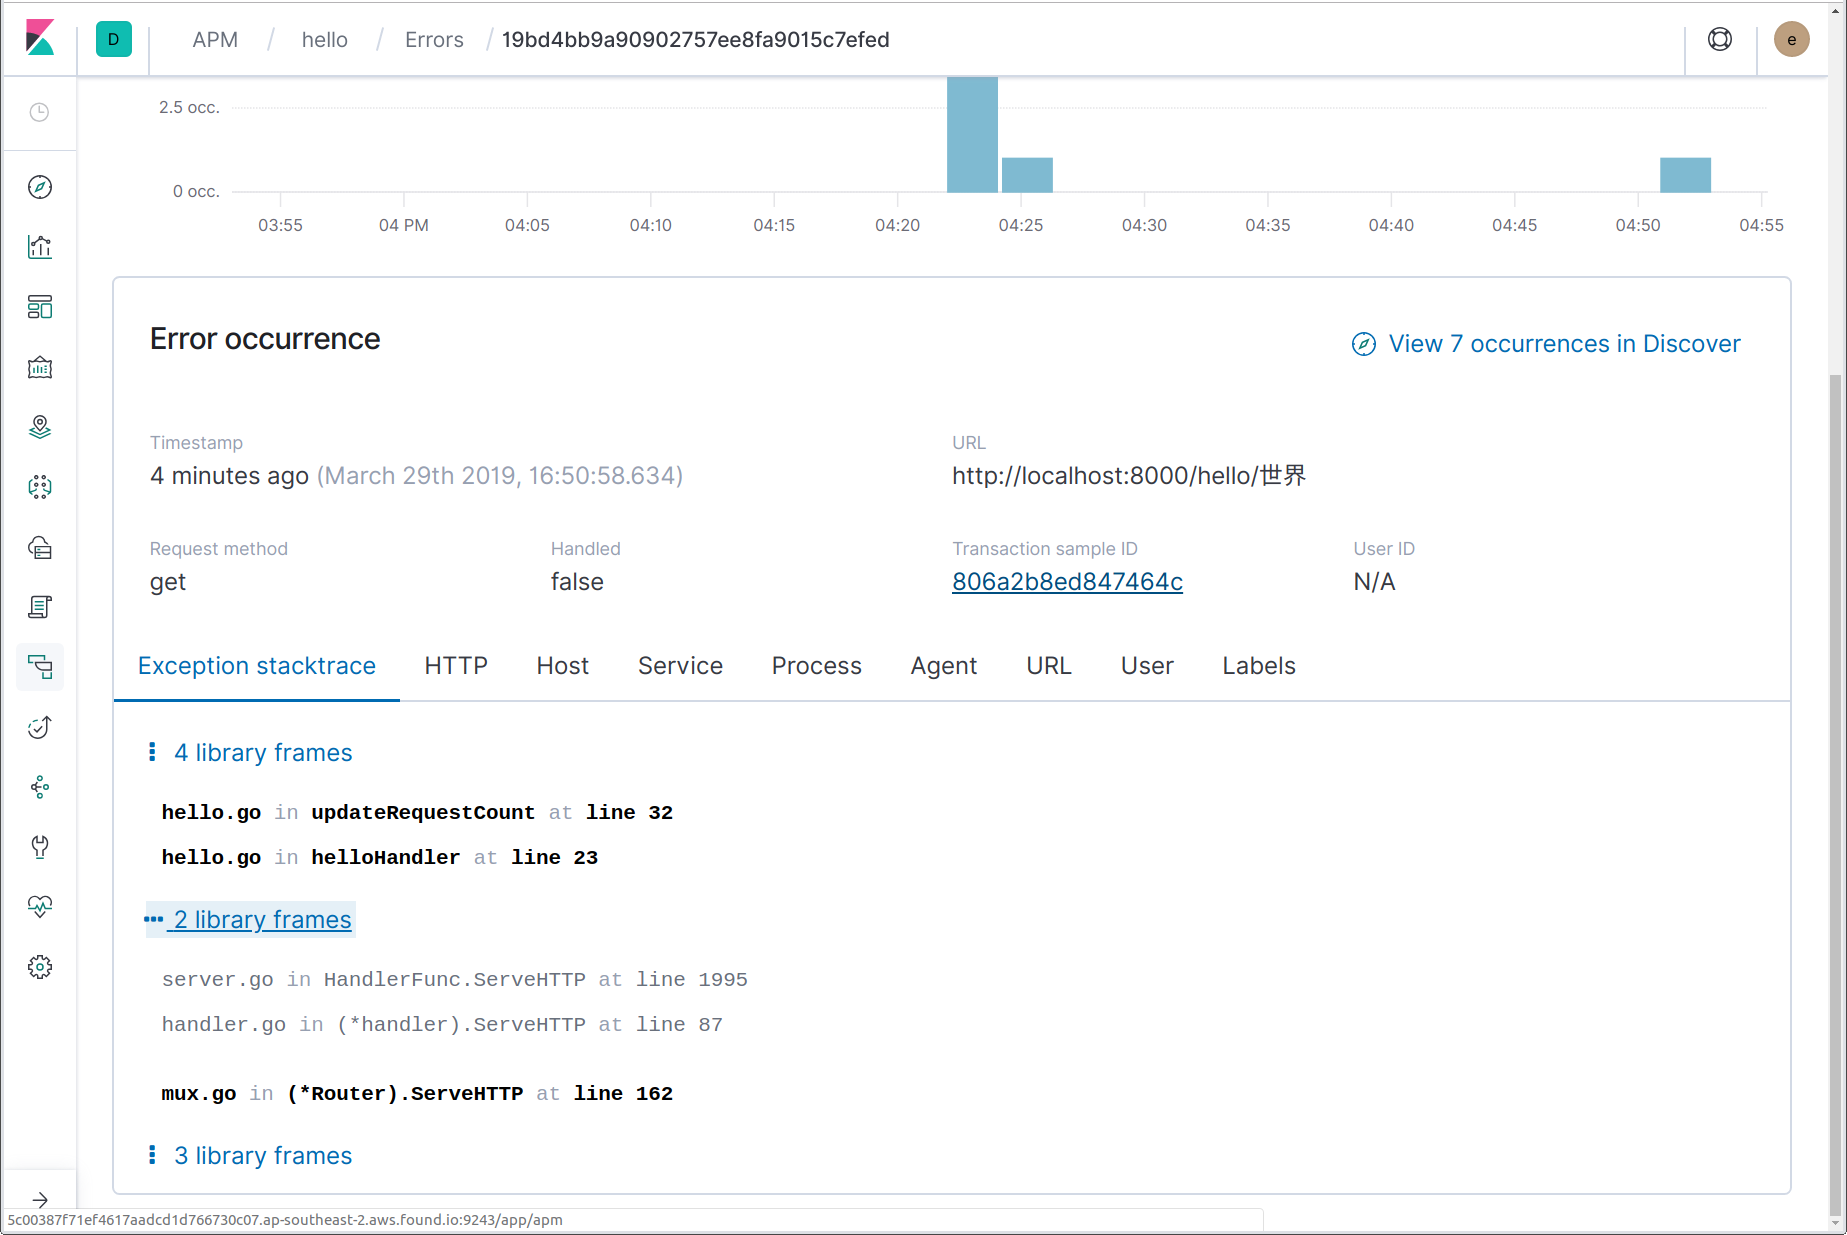
Here we can see that an error has occurred, including the error (panic) message, “non-ASCII name!”; and the name of the function where the panic originated, updateRequestCount. By clicking on the error name, we are linked through to the details of the most recent instance of that error. On the error details page, we can see the full stack trace, a snapshot of the details of the transaction in which the error occurred at the time of the error, along with a link to the completed transaction.
In addition to capturing these panics, you can also explicitly report errors to Elastic APM by using the apm.CaptureError function. You must pass this function a context that contains a transaction, and an error value. CaptureError will return an “apm.Error” object, which you may optionally customise, and then finalise using its Send method:
if err != nil {
    apm.CaptureError(req.Context(), err).Send()
    return err
}
Finally, it is possible to integrate with logging frameworks to send error logs to Elastic APM. We’ll talk about this more in the following section.
Logging integration
In recent years, there has been a lot of talk about the “Three Pillars of Observability”: traces, logs, and metrics. What we’ve been looking at so far is tracing, but the Elastic Stack covers all three of these pillars, and more. We’ll talk about metrics a little bit later; let’s see how Elastic APM integrates with your application logging.
If you’ve done any kind of centralised logging, then you’re probably already very familiar with the Elastic Stack, formerly known as the ELK (Elasticsearch, Logstash, Kibana) Stack. When you have both your logs and your traces in Elasticsearch, then cross referencing them becomes straightforward.
The Go agent has integration modules for several popular logging frameworks: Logrus (apmlogrus), Zap (apmzap), and Zerolog (apmzerolog). Let’s add some logging to our web service using Logrus, and see how we can integrate it with our tracing data.
import "github.com/sirupsen/logrus"
var log = &logrus.Logger{
        Out:   os.Stderr,
        Hooks: make(logrus.LevelHooks),
        Level: logrus.DebugLevel,
        Formatter: &logrus.JSONFormatter{
                FieldMap: logrus.FieldMap{
                        logrus.FieldKeyTime:  "@timestamp",
                        logrus.FieldKeyLevel: "log.level",
                        logrus.FieldKeyMsg:   "message",
                        logrus.FieldKeyFunc:  "function.name", // non-ECS
                },
        },
}
func init() {
        apm.DefaultTracer.SetLogger(log)
}
We’ve constructed a logrus.Logger that writes to stderr, formatting logs as JSON. To better fit into the Elastic Stack, we’re mapping some of the standard log fields to their equivalents in the Elastic Common Schema (ECS). We could alternatively leave them as their defaults, and then use Filebeat processors to translate, but this is a little simpler. We’ve also told the APM agent to use this Logrus logger for logging agent-level debug messages.
Now let’s look at how we can integrate application logs with APM trace data. We’ll add some logging to our helloHandler route handler, and see how we can add the trace IDs to the log messages. We’ll then look at how we can send error log records to Elastic APM, to show up in the “Errors” page.
func helloHandler(w http.ResponseWriter, req *http.Request) {
        vars := mux.Vars(req)
        log := log.WithFields(apmlogrus.TraceContext(req.Context()))
        log.WithField("vars", vars).Info("handling hello request")
        name := vars["name"]
        requestCount, err := updateRequestCount(req.Context(), name, log)
        if err != nil {
                log.WithError(err).Error(“failed to update request count”)
                http.Error(w, "failed to update request count", 500)
                return
        }
        stats, err := getNameStats(req.Context(), name)
        if err != nil {
                log.WithError(err).Error(“failed to update request count”)
                http.Error(w, "failed to get name stats", 500)
                return
        }
        fmt.Fprintf(w, "Hello, %s! (#%d)\n", name, requestCount)
        fmt.Fprintf(w, "In %s, %d: ", stats.Region, stats.Year)
        switch n := stats.Male.N + stats.Female.N; n {
        case 1:
                fmt.Fprintf(w, "there was 1 baby born with the name %s!\n", name)
        default:
                fmt.Fprintf(w, "there were %d babies born with the name %s!\n", n, name)
        }
}
func updateRequestCount(ctx context.Context, name string, log *logrus.Entry) (int, error) {
        span, ctx := apm.StartSpan(ctx, "updateRequestCount", "custom")
        defer span.End()
        if strings.IndexFunc(name, func(r rune) bool { return r >= unicode.MaxASCII }) >= 0 {
                panic("non-ASCII name!")
        }
        tx, err := db.BeginTx(ctx, nil)
        if err != nil {
                return -1, err
        }
        row := tx.QueryRowContext(ctx, "SELECT count FROM stats WHERE name=?", name)
        var count int
        switch err := row.Scan(&count); err {
        case nil:
                if count == 4 {
                        return -1, errors.Errorf("no more")
                }
                count++
                if _, err := tx.ExecContext(ctx, "UPDATE stats SET count=? WHERE name=?", count, name); err != nil {
                        return -1, err
                }
                log.WithField("name", name).Infof("updated count to %d", count)
        case sql.ErrNoRows:
                count = 1
                if _, err := tx.ExecContext(ctx, "INSERT INTO stats (name, count) VALUES (?, 1)", name); err != nil {
                        return -1, err
                }
                log.WithField("name", name).Info("initialised count to 1")
        default:
                return -1, err
        }
        return count, tx.Commit()
}
If we now run the program with output redirected to a file (/tmp/hello.log, assuming you’re running on Linux or macOS), we can install and run Filebeat to send the logs the same Elastic Stack that is receiving the APM data. After installing Filebeat, we’ll modify its configuration in filebeat.yml as follows:
- Set “enabled: true” for the log input under “filebeat.inputs”, and change the path to “/tmp/hello.log”.
- If you’re using Elastic Cloud, set “cloud.id” and “cloud.auth”, otherwise set “output.elasticsearch.hosts”.
- Add a “decode_json_fields” processor, so “processors” looks as follows:
processors:
- add_host_metadata: ~
- decode_json_fields:
    fields: ["message"]
    target: ""
    overwrite_keys: true
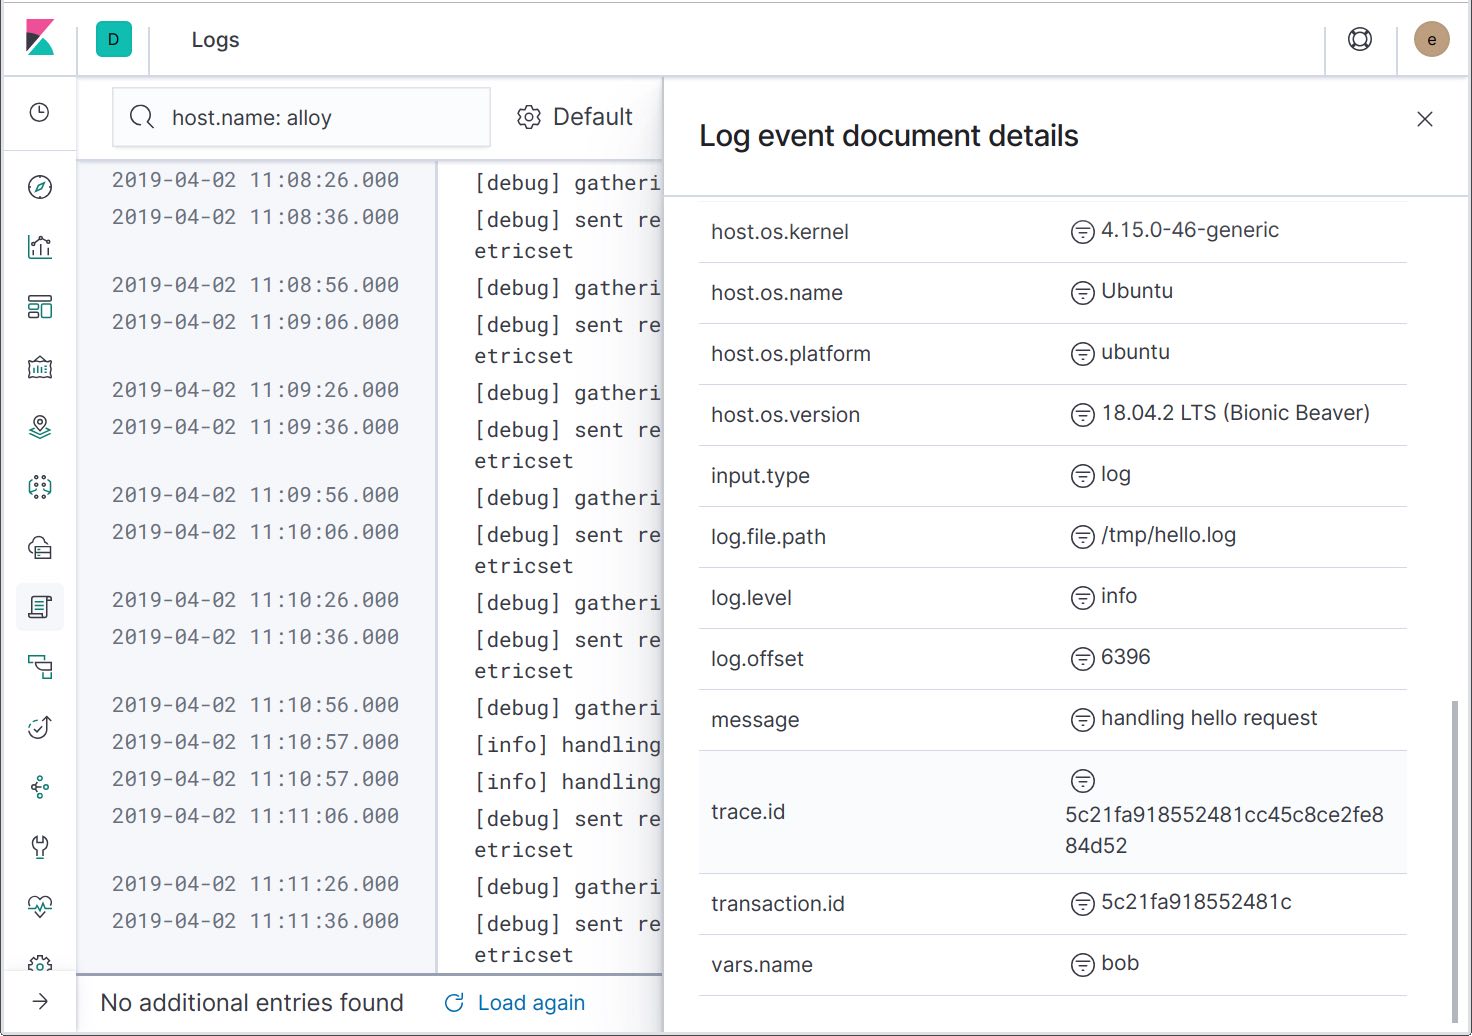
Now run Filebeat, and the logs will start flowing. Now if we send some requests to the service, we’ll be able to jump from traces to logs at the same point in time using the “Show host logs” action.
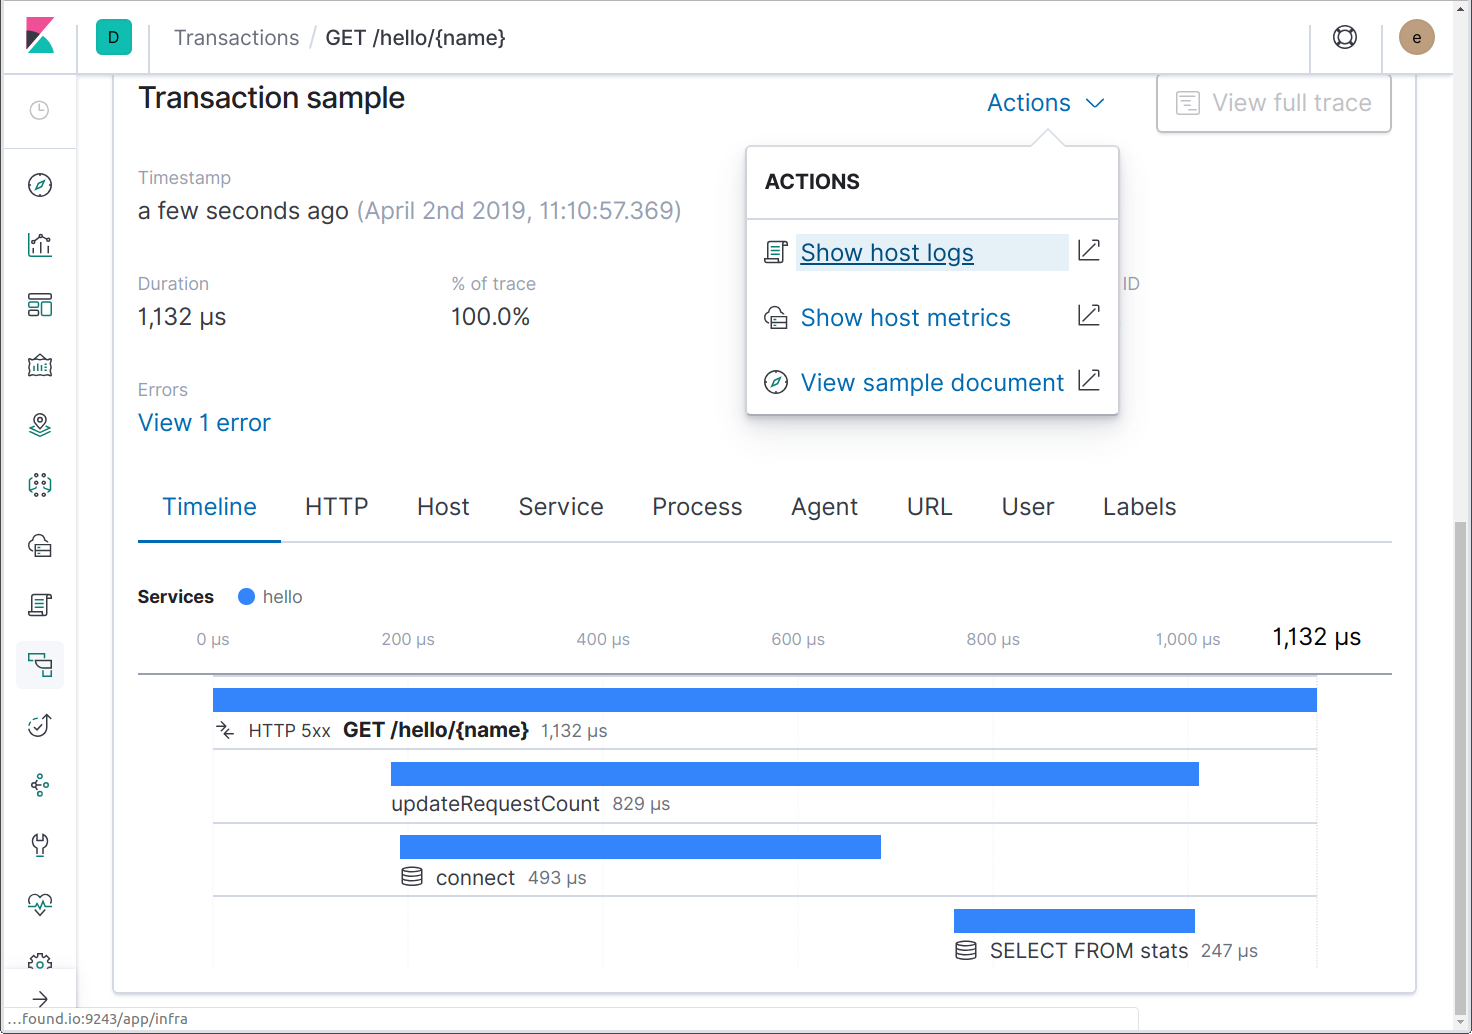
This action will take us to the Logs UI, filtered to the host. If the application were running inside a Docker container or within Kubernetes, actions would be available for linking to logs for the Docker container or Kubernetes pod.
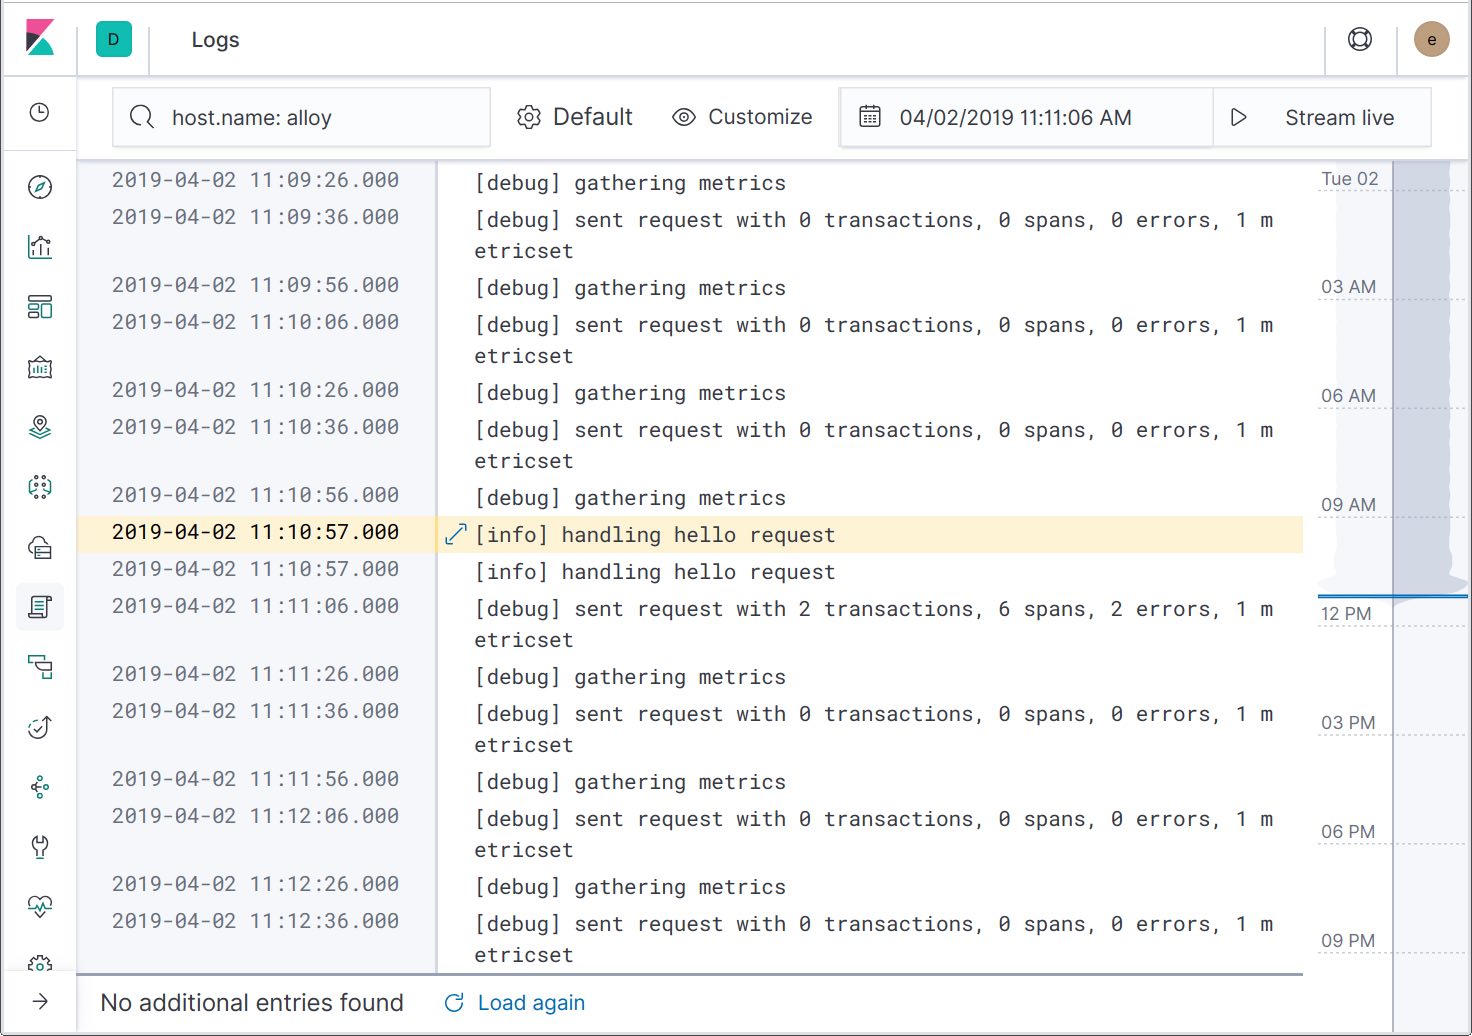
Expanding the log record details, we can see that the trace IDs have been included in the log messages. In the future, another action will be added to filter the logs to the specific trace, enabling you to see only the related log messages.
Now that we’ve got the ability to jump from traces to logs, let’s look at the other integration point: sending error logs to Elastic APM, to show up in the “Errors” page. To achieve this, we need to add an apmlogrus.Hook to the logger:
func init() {
        // apmlogrus.Hook will send "error", "panic", and "fatal" log messages to Elastic APM.
        log.AddHook(&apmlogrus.Hook{})
}
Earlier we changed updateRequestCount to return an error after the 4th call, and we changed helloHandler to log that as an error. Let’s send 5 requests for the same name, and see what shows up in the “Errors” page.
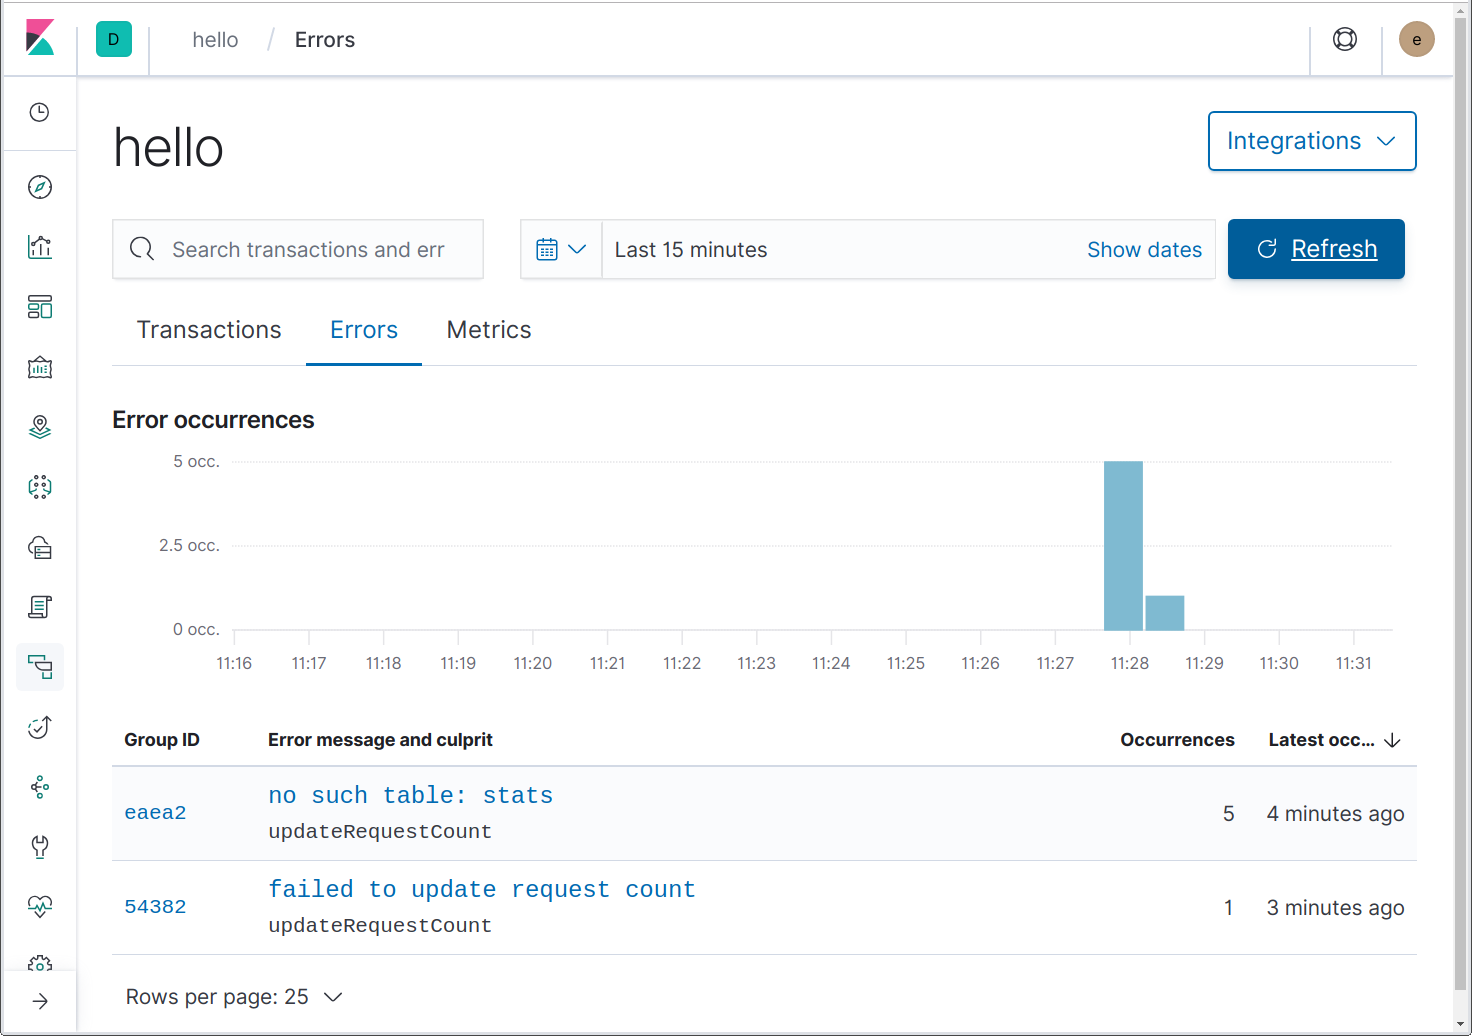
Here we can see two errors. One of them is an unexpected error due to the use of an in-memory database, best explained by https://github.com/mattn/go-sqlite3/issues/204. Nice catch! The “failed to update request count” error is the one we came to see.
Notice that both of these errors’ culprits are updateRequestCount. How does Elastic APM know this? Because we’re using github.com/pkg/errors, which adds a stack trace to each error it creates or wraps, and the Go agent knows to make use of those stack traces.
Infrastructure and application metrics
Finally, we come to metrics. Similar to how you can jump to host and container logs by using Filebeat, you can jump to host and container infrastructure metrics by using Metricbeat. In addition, the Elastic APM agents periodically report system and process CPU and memory usage.
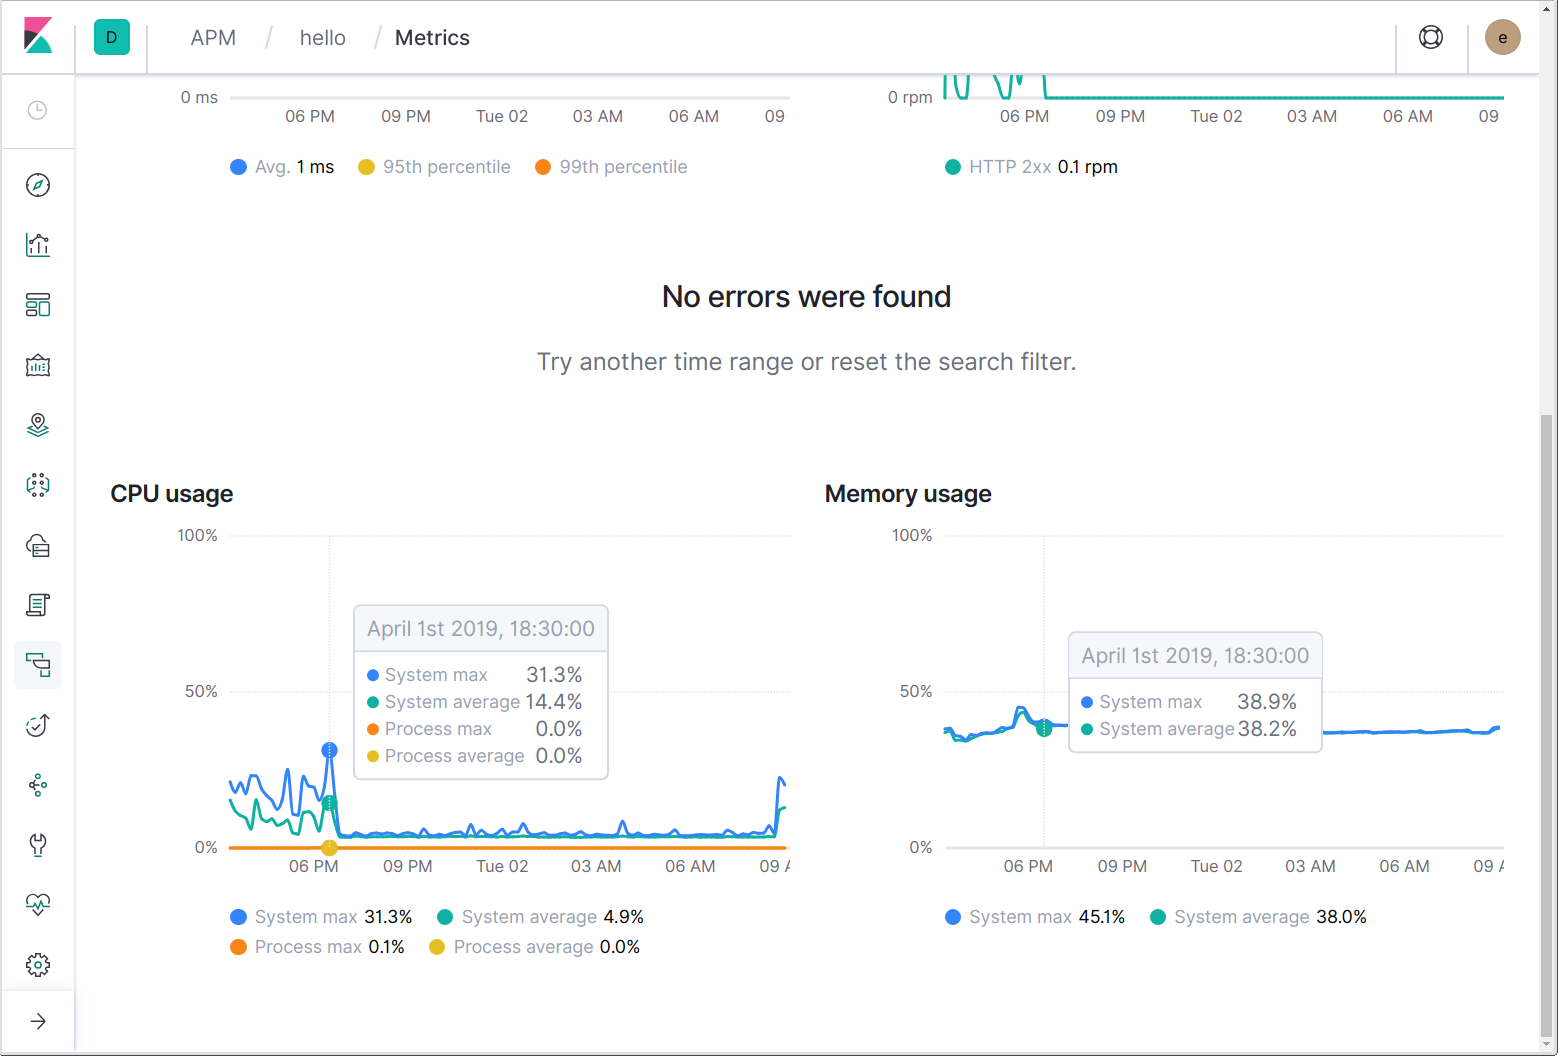
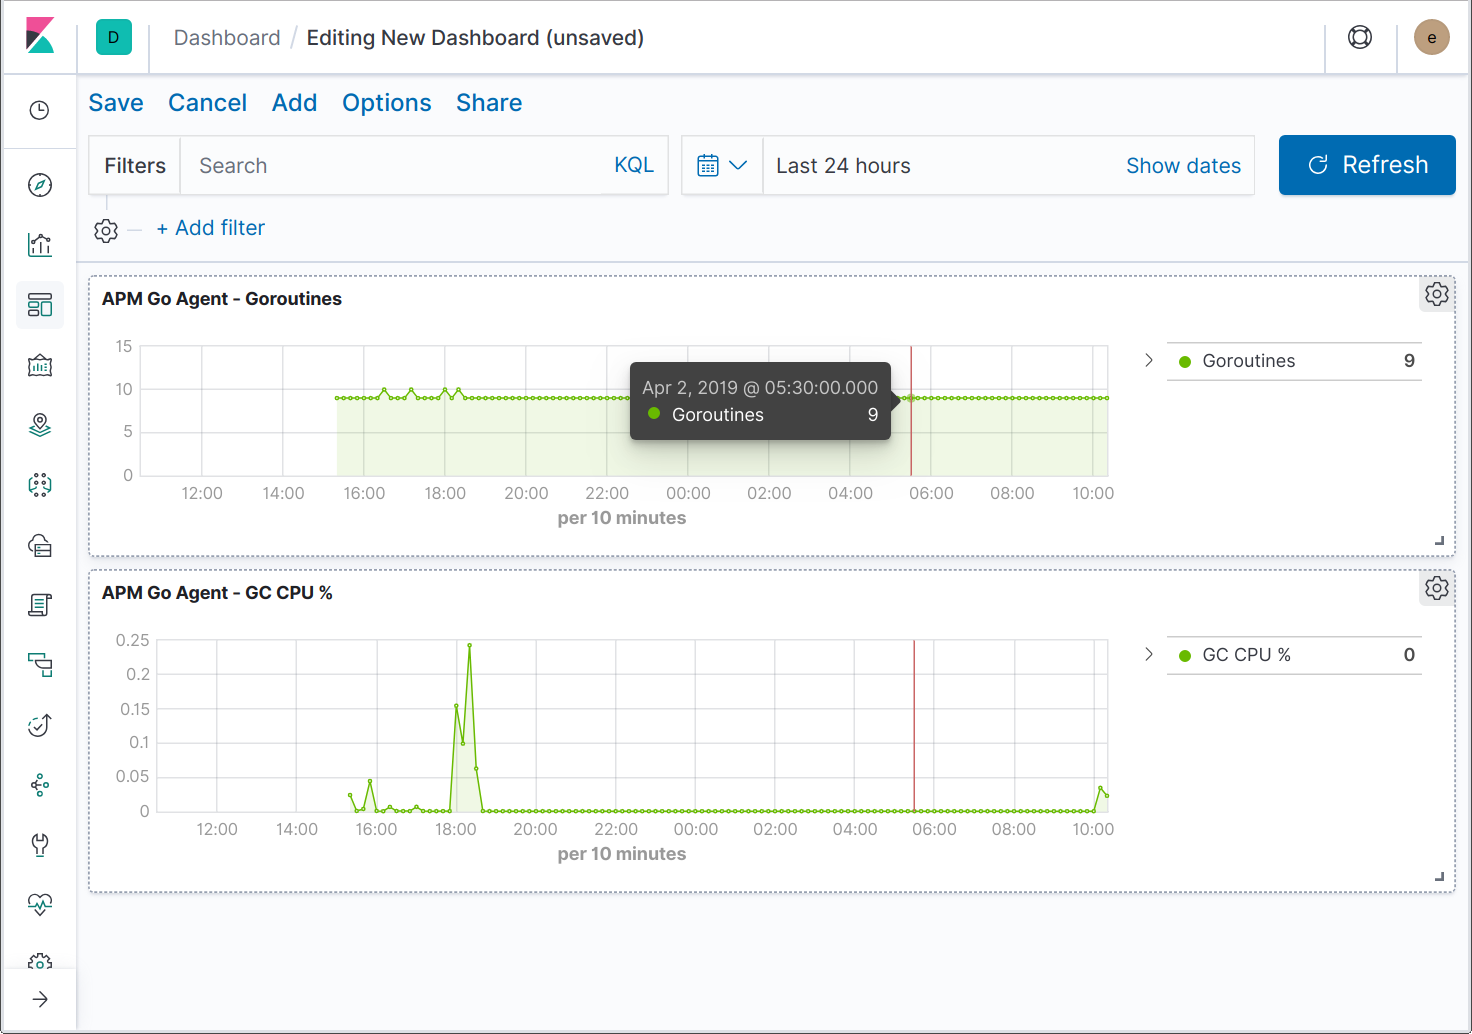
Agents can also send language and application-specific metrics. For example, the Java agent sends JVM-specific metrics, while the Go agent sends metrics for the Go runtime, e.g. the current number of goroutines, the cumulative number of heap allocations, and percentage of time spent in garbage collection.
Work is underway to extend the UI to support additional application metrics. Meanwhile, you can create dashboards to visualise the Go-specific metrics.
But Wait, There’s More!
One thing we haven’t looked at is integrating with the Real User Monitoring (RUM) agent, which would enable you to see a distributed trace starting at the browser, and following all the way through your backend services. We will look into this topic in a future blog post. In the meantime, you can whet your appetite with A Sip of Elastic RUM.
We have covered a lot of ground in this article. If you’re left with more questions, then please join us in the Discuss forum and we’ll do our best to answer them.