Elastic Stack 7.2.0 released
We are thrilled to announce that version 7.2 of the Elastic Stack has landed, and it’s another big one!
In this blog, we’ll touch on some of the release highlights. Be sure to check out the dedicated blogs for each product to dive into all the details of what’s new. If you just can’t wait, version 7.2 is available now on our Elasticsearch Service — the only hosted Elasticsearch offering to include these new features. Or you can download the Elastic Stack.
Without further ado, let’s dive into what’s new:
Introducing Elastic SIEM
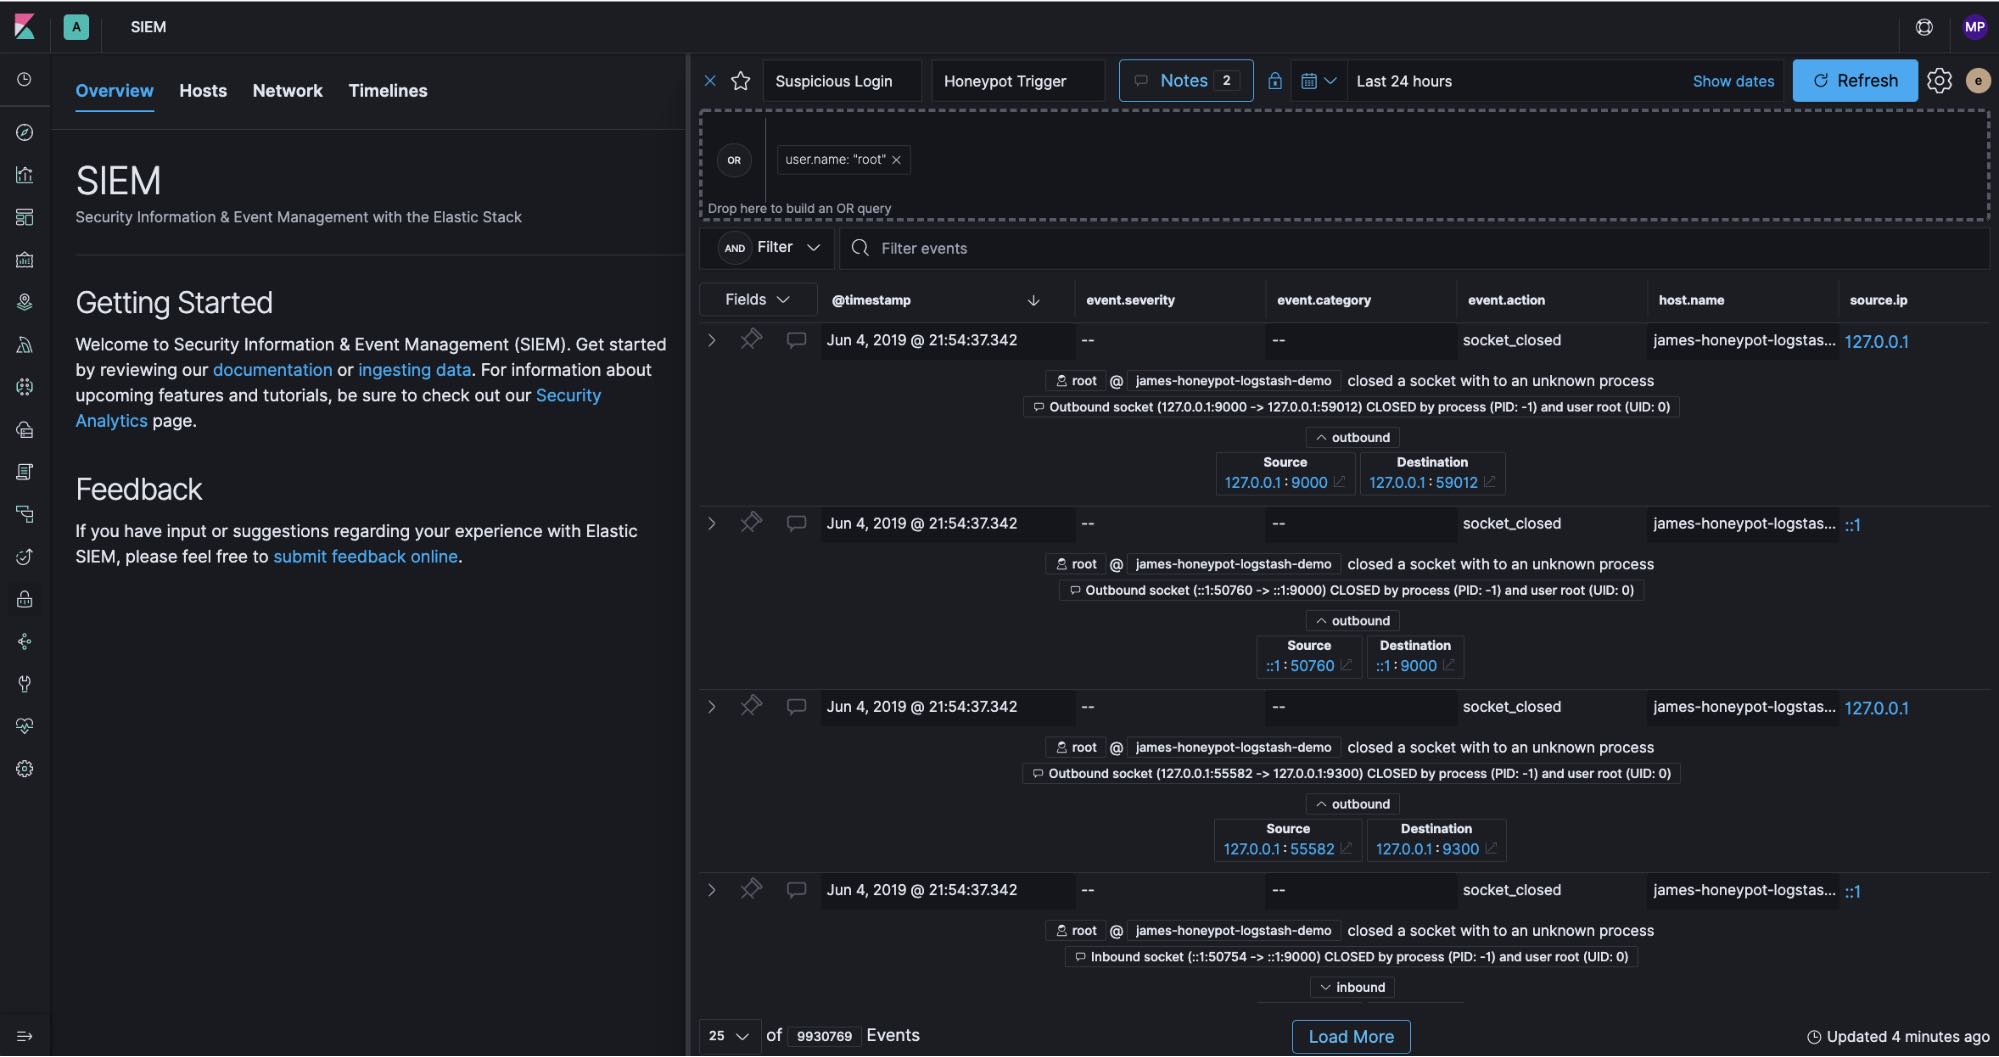
Over the last few years, we’ve seen many security practitioners turn to the Elastic Stack to protect their companies because it provided the speed and scalability that they needed for security analytics, threat hunting, and SIEM. And we’ve been investing heavily in making their lives easier, starting with data collection and normalization. We’ve dramatically expanded the set of host-based security data we collect with Auditbeat and Winlogbeat, capturing system events, process starts, installed packages, and more. We also expanded the range of network-based data we collect, with integrations with Bro/Zeek and Suricata. We’re adding even more integrations with 7.2: Cisco ASA and Palo Alto firewalls are now supported data sources. To let users make the most of all this data, we spent the last 18 months working on the Elastic Common Schema (ECS) — an extensible mapping that makes it easy to analyze common data across sources. As of 7.0, our supported integrations use ECS, and we’ve had great engagement with the community around it.
With that as the backdrop, today we’re thrilled to introduce Elastic SIEM.

In the spirit of moving fast, releasing often, and providing a constant stream of value to our users, we believe this is a great first step toward our vision of what a SIEM should be. We’re providing a dedicated UI for exploring and visualizing host and network-based data, and simple workflow capabilities for investigating potential issues. We expect this will be a big help to our existing users who use the Stack for security analytics, threat hunting, or as a SIEM today, and will make it easier for new users to start protecting their organizations. But this is just the first step of many. To see all the details of this release, and a bit more about where we’re heading, check out the Elastic SIEM release post.
Elastic App Search on-prem GA: Releases with the Elastic Stack from now on
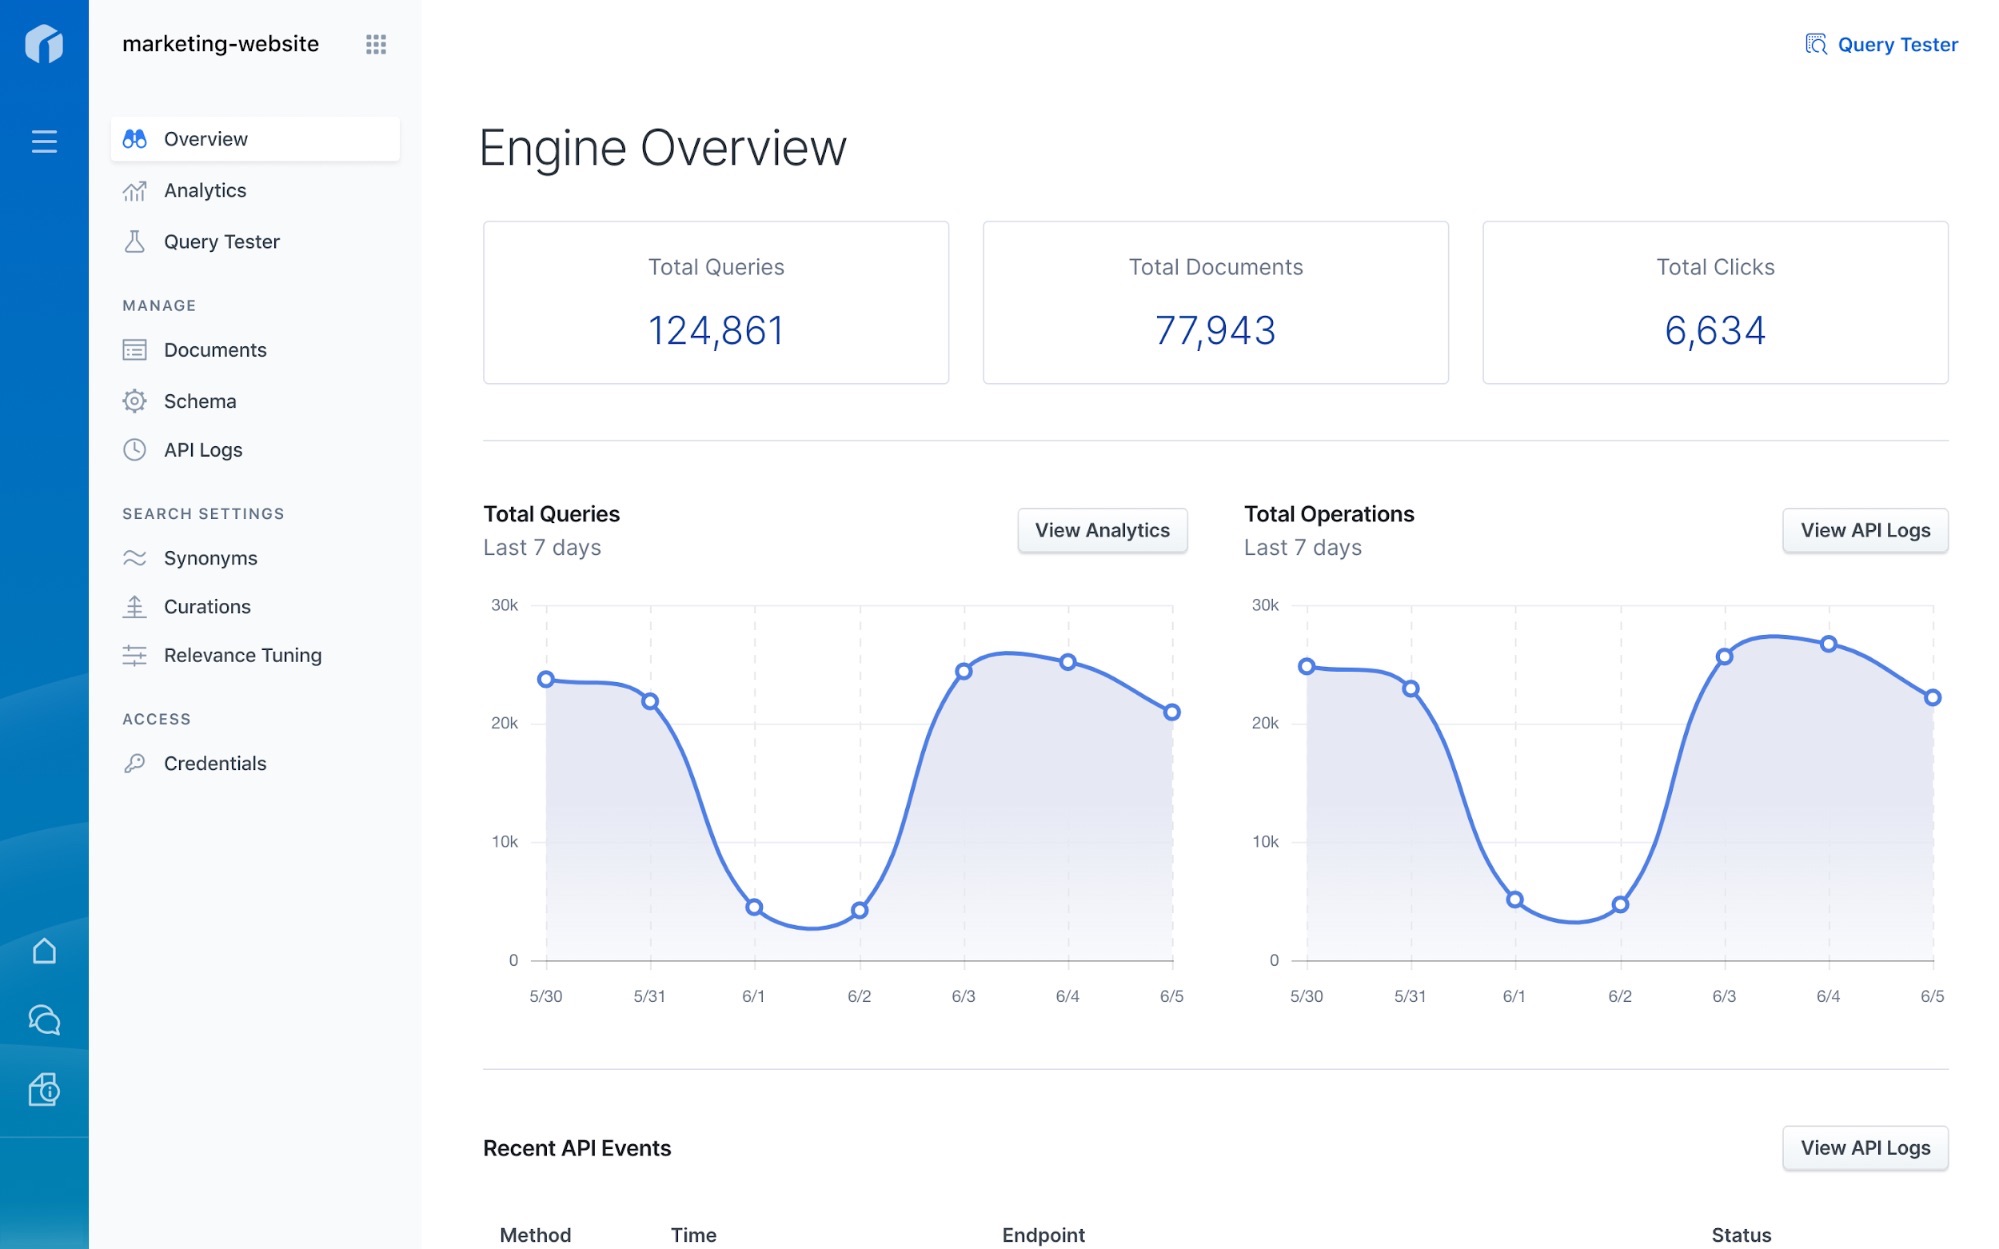
Elastic App Search allows developers to create consumer-grade, user-facing search experiences in a matter of minutes. Until now this product was available only as a hosted service from Elastic. Today, we’re making this available for our community to download, run, and enjoy — for free! We’re excited to provide the ultimate flexibility in how App Search is deployed. If you want a managed service, we have you covered. If you prefer to run it in your datacenter, on your laptop, or on a spaceship on the way to Mars, now you can.

App Search will now be versioned and released with the Elastic Stack! Read all the details in our Elastic App Search announcement blog.
Elastic <3s observability: Bringing together logs, metrics, traces, and more
With the 7.2 release, we’re excited to continue our fast pace of innovation in the observability space, making it easier than ever to have full visibility into all data pertaining to system, service, and application health — be that logs, metrics, uptime measurements, or traces.
Elastic APM has a slew of big improvements. From the much-anticipated Elastic .NET Agent moving into beta, to support for single-page applications in our browser-based Real User Monitoring (RUM) Agent, we’re now collecting a richer set of agent-based metrics to give you even more context when investigating an issue.
On the infrastructure metrics side of things, we’re introducing the Metrics Explorer — a new, intuitive way to quickly visualize the most important infrastructure metrics and interact with them using common tags and chart groupings right inside the Infrastructure app. Create a chart you’d like to see on a dashboard? No problem, we’ve got you covered.
We’re big fans of Kubernetes, and we’re committed to making it easy to monitor the fast evolving cloud-native ecosystem. Today, we’re advancing our Kubernetes and container monitoring initiative to include monitoring of the NATS open source messaging system, CoreDNS, and support for CRI-O format container logs.
In related news, we launched Elastic Cloud on Kubernetes just a few weeks ago, making it easier than ever for users to deploy and operate the Elastic Stack on Kubernetes.
To read more about our vision for observability and go deeper into the improvements in 7.2, head over to our observability post!
And there’s more!
Hungry for more detail? Dig into the product posts to see all the great things we’ve added in 7.2.
- Elasticsearch simplifies search-as-you-type, adds a UI around snapshot/restore, gives you even more control over relevance without sacrificing performance, and much more. Read more.
- Kibana makes it even easier to build a secure, multi-tenant Kibana instance with advanced RBAC for Spaces. We’ve also introduced kiosk mode for Canvas, and the maps created in the new Maps app can now be embedded in any Kibana dashboard. There are also new easy-on-your-eyes dark-mode map tiles and much more. Read more.
- Beats improves edge-based processing with a new JavaScript processor, and more. Read more.
- Logstash gets faster with the Java execution pipeline going GA, now fully supports JMS as an input and output, and more. Read more.
For even more info, check out our "New Feature Tour" video:
Try it now
Why wait? Deploy a cluster on our Elasticsearch Service in under a minute or download the Elastic Stack to take these latest features for a spin.
