Elastic APM Java Agent Beta Released
We are proud to announce the beta release of the Elastic APM Java agent! Before you get too excited, a quick reminder that you should not run the beta in production. But the agent is now ready for more serious testing, so you should definitely consider giving it a try in your test and dev environments. If you do so, we'd be thrilled to get some feedback in the discussion forum.
Elastic APM is an Application Performance Monitoring solution from Elastic and alongside the Java agent, there are official agents available for Node.js, Python, Ruby, JavaScript/RUM (beta), and Go (beta). Elastic APM helps you to gain insight into the performance of your application and tracks errors.
Instrumenting a Spring Boot application
This section showcases how to instrument a Spring Boot application with the Elastic APM Java agent. Currently, we support Spring Boot 1.5.x-2.x as well as various application servers and servlet containers like WildFly and Tomcat. Note that it does not yet support Spring Boot Web Reactive. See the documentation for a list of all supported technologies.
The first step is to set up the backend for Elastic APM. You can find a detailed description about that in our getting started documentation.
The next step is to download the latest agent jar from Maven Central. Then, build your Spring Boot application just like you always to do get an executable jar file. When starting the application, add the -javaagent flag and define some system properties to configure the agent:
java -javaagent:/path/to/elastic-apm-agent-<version>.jar \
     -Delastic.apm.server_url=http://localhost:8200 \
     -Delastic.apm.service_name=my-application \
     -Delastic.apm.application_packages=org.example \
     -jar my-spring-boot-application.jar
For the curious, you can take a look at the agent documentation to learn about other configuration options and configuration sources, such as property files and environment variables.
Note that you can't declare a dependency to the agent in your pom.xml. The jar is only meant to be used in combination with the -javaagent flag. The beauty of this approach is that it's completely separate from the development and can be done during the deployment.
Nevertheless, we also provide an API for developers to customize transactions created by the agent's auto instrumentation or to create integrations for frameworks the agent does not (yet) know about. This combines the best of the two worlds of auto instrumentation where you don't have to do any code changes, with programmatic tracing and the ability to attach your application-specific metadata to the transactions. If you have already invested in OpenTracing or don't want to tie yourself to the Elastic APM API, we also offer an OpenTracing bridge.
What it Does
The agent instruments your application to record all incoming Servlet API-based HTTP traffic and JDBC queries (that includes O/R mappers like Hibernate btw.). This information is sent to the APM server, which then indexes the data as documents inside Elasticsearch.
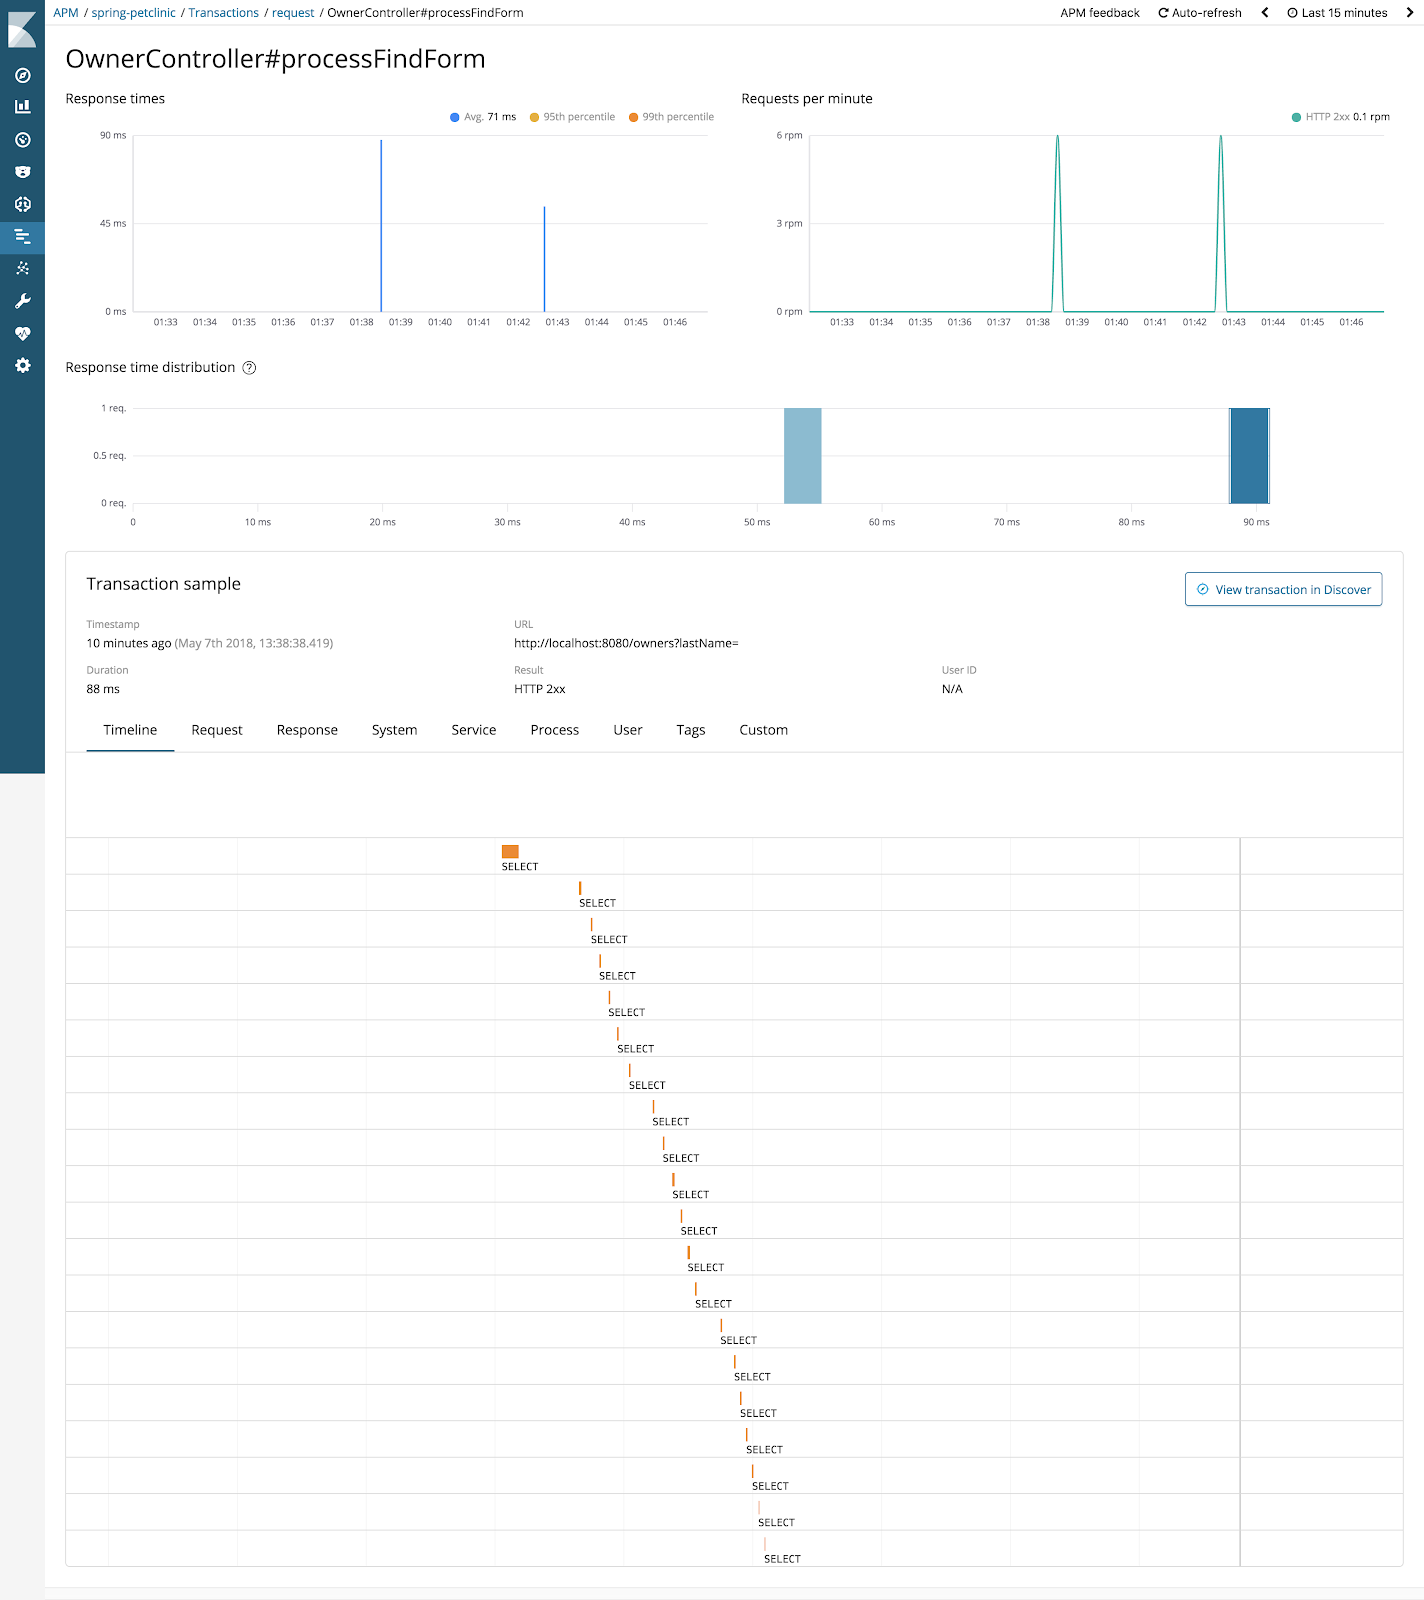
To view the data, you can use the APM UI inside Kibana, which is already included in the default distribution of Kibana (as of version 6.3). The APM UI offers a curated experience for the tracing data and allows you to drill down to specific HTTP requests and JDBC queries. You can also leverage the APM dashboards and visualizations, and mix and match with your existing dashboards.

Minimal Overhead
We don't want to slow down your application with our agent, so we designed it to have very little overhead. When recording an HTTP request which issues one JDBC query, the overhead is less than 1 µs on average and around 3.5 µs for the 99.9th percentile (only the worst 0.1% add more overhead than 3.5 µs). Note that's microseconds, not milliseconds. We also took care to allocate as little memory as possible so that your GC does not have more work to do than normal. In the above example, only around 75 bytes are allocated per request by the agent. This already includes the overhead of reporting the data to the APM server, which is done in the background. The benchmarks are open source, so feel free to check them out and to execute them on your machines.
Future
We have a lot of exciting things we are currently working on. One of those things is adding support for distributed tracing. In microservice-oriented architectures, requests are often processed by multiple services. This can make it hard to troubleshoot latency problems and to find out the root cause of an error. Distributed tracing helps to correlate the interactions of the different services by passing correlation IDs along.
The Java ecosystem is huge so there is an ever-ongoing task to add support for more frameworks, application servers, and RPC libraries. If you want support for a particular framework, please fill out the Java agent survey to help us prioritize adding support for it.
Please give the agent a try and give some feedback in the discussion forum. We are also always open for contributions, so feel free to check out the source code over at GitHub and to open a pull request.