Graph
Analyze the relationships in your data
There are potential relationships living among the documents in your Elastic Stack; linkages between people, places, preferences, products, you name it. Graph offers a relationship-oriented approach that lets you explore the connections in your data using the relevance capabilities of Elasticsearch.
Getting started with Elasticsearch: Store, search, and analyze with the open source Elastic Stack.
Watch videoIntro to ELK: Get started with logs, metrics, data ingestion and custom visualizations in Kibana.
Watch videoGetting started with Elastic Cloud: Launch your first deployment.
Learn morePopular is not always the same as relevant
Common in most datasets are "super connectors" — things like Amazon for purchase history data, the Beatles for music, and Shawshank Redemption for movies. They're like actor Kevin Bacon; you're never separated by more than a few hops.
It's the ability to identify the difference between popularity and relevance that is key. We've taken our deep knowledge of information retrieval and combined it with the rich statistics that Elasticsearch generates while indexing to calculate the relevance of the relationships — bringing back the most meaningful links first.
Explore your existing Elasticsearch indices
It's easy to get started with exploring the connections living in your existing Elasticsearch indices. There are no new data formats to fiddle with. No new indices to create. No third-party systems to maintain. No higher taxes. Just go and be curious.
Integrate the Graph API into your application
The Graph API leverages Elasticsearch's aggregations and query language, providing a simple API for graph exploration. There is no need to define complex ontologies and learn a new query language. It's flexible, it's natural, and lets you guide your exploration using powerful search features like geospatial filters.
Visualize the relationships in Kibana
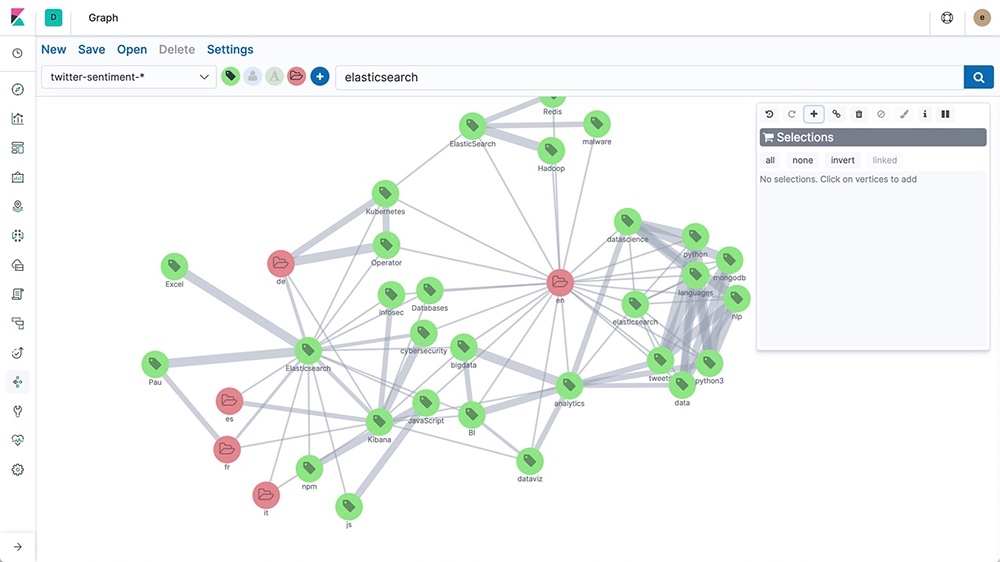
A single link in a graph may represent thousands of documents, like banking transactions between two accounts. The Graph UI in Kibana lets you visualize these connections.
Drill down into the details using any of the maps, timelines, pie charts, or raw document visualizations in Kibana. Click through and interact with your graph of networked entities, view the strength of connections, and even customize colors and icons.
