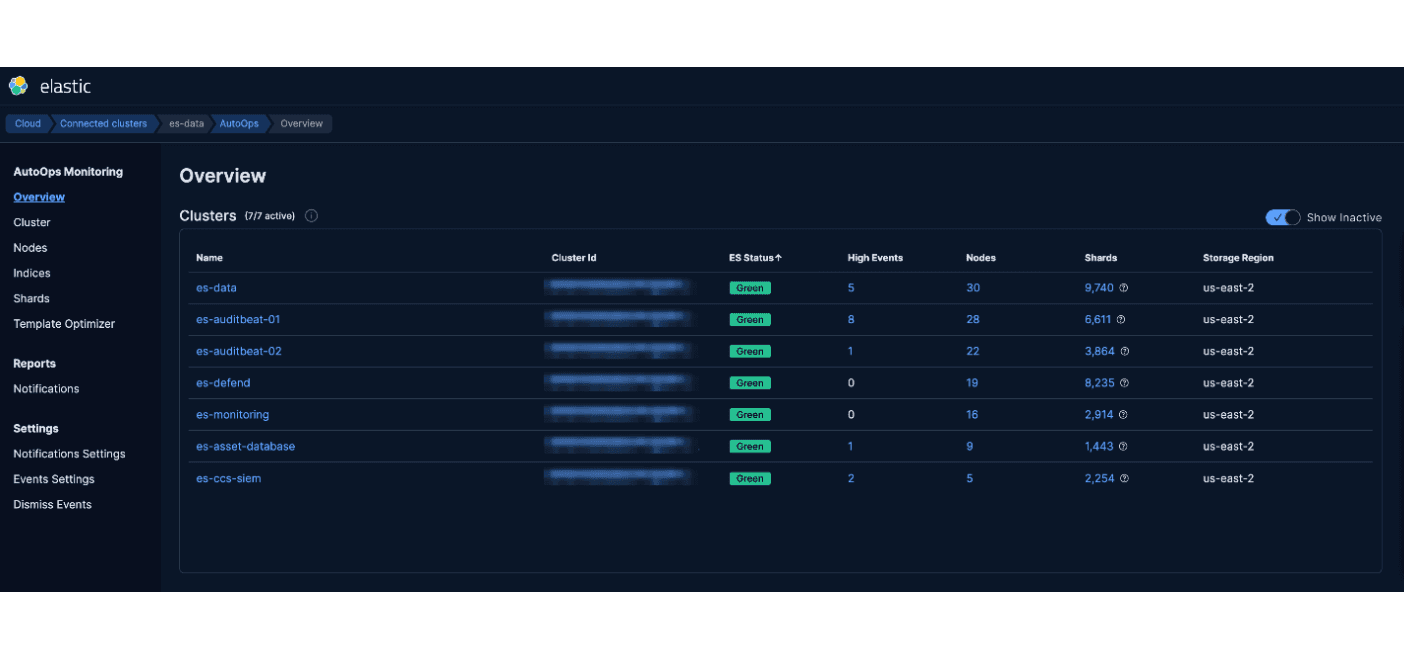
Simplify your Elasticsearch operations with real-time issue detection and actionable recommendations to optimize performance and reduce costs. AutoOps is available for cloud and self-managed deployments. Learn more about AutoOps.
In this article, we’ll dive into a real-world scenario where AutoOps was instrumental in diagnosing and addressing high CPU usage in a production Elasticsearch cluster. The incident began with a customer support ticket and ended with actionable insights to ensure smoother operations in the future.
Introduction: Diagnosing High CPU usage in Elasticsearch
Efficiently managing Elasticsearch clusters is crucial for maintaining application performance and reliability. When a customer experiences sudden performance bottlenecks, the ability to quickly diagnose the issue and provide actionable recommendations becomes a key differentiator.
This review explores how AutoOps, a powerful monitoring and management tool, helped us identify and analyze a high CPU utilization issue affecting an Elasticsearch cluster. The article provides a step-by-step account of how AutoOps identified the root cause, along with the benefits this tool offers in streamlining the investigation process.
The high CPU situation
On July 14, 2024, a production cluster named “Palomino” experienced an outage. The customer reported the issue the next day, citing high CPU usage as a potential root cause. Despite the issue being non-urgent (as the outage was resolved), understanding the underlying cause remained critical for preventing recurrence.
The initial request was as follows:
The investigation began with one keyword in mind: high CPU usage.
Using AutoOps for diagnosing high CPU usage

Step 1: Analyzing AutoOps events
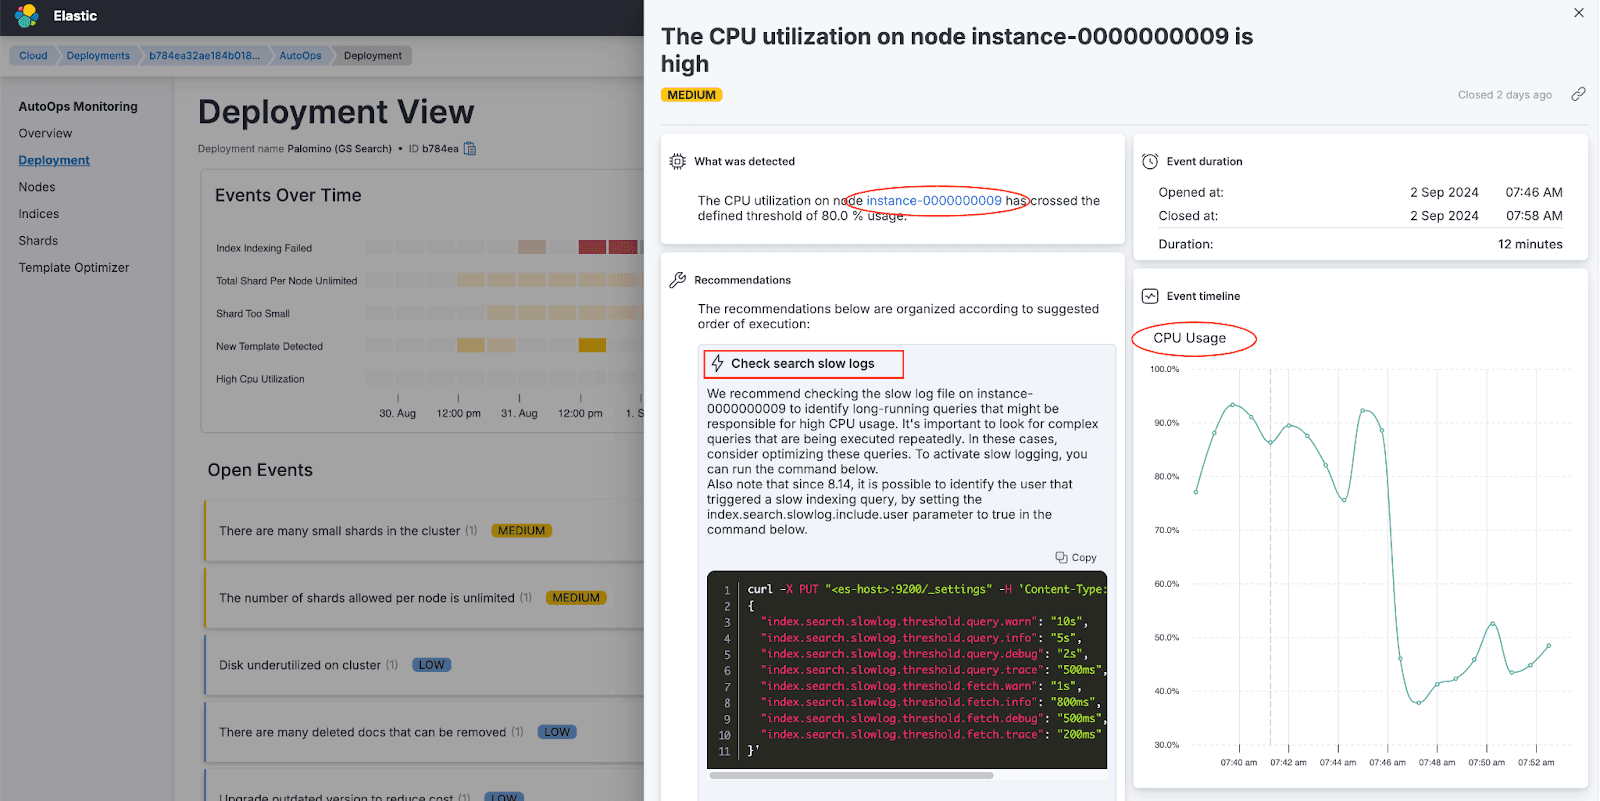
AutoOps immediately flagged multiple “High CPU Utilization” events. Clicking on an event provided comprehensive details, including:
- When the event started and ended.
- The node experiencing the most pressure.
- Initial recommendations, such as enabling search slow logs.
While the suggestion to enable slow logs was noted, we continued exploring for a deeper root cause. If you want to activate search slowlogs, you can use this link.
Step 2: Node view analysis
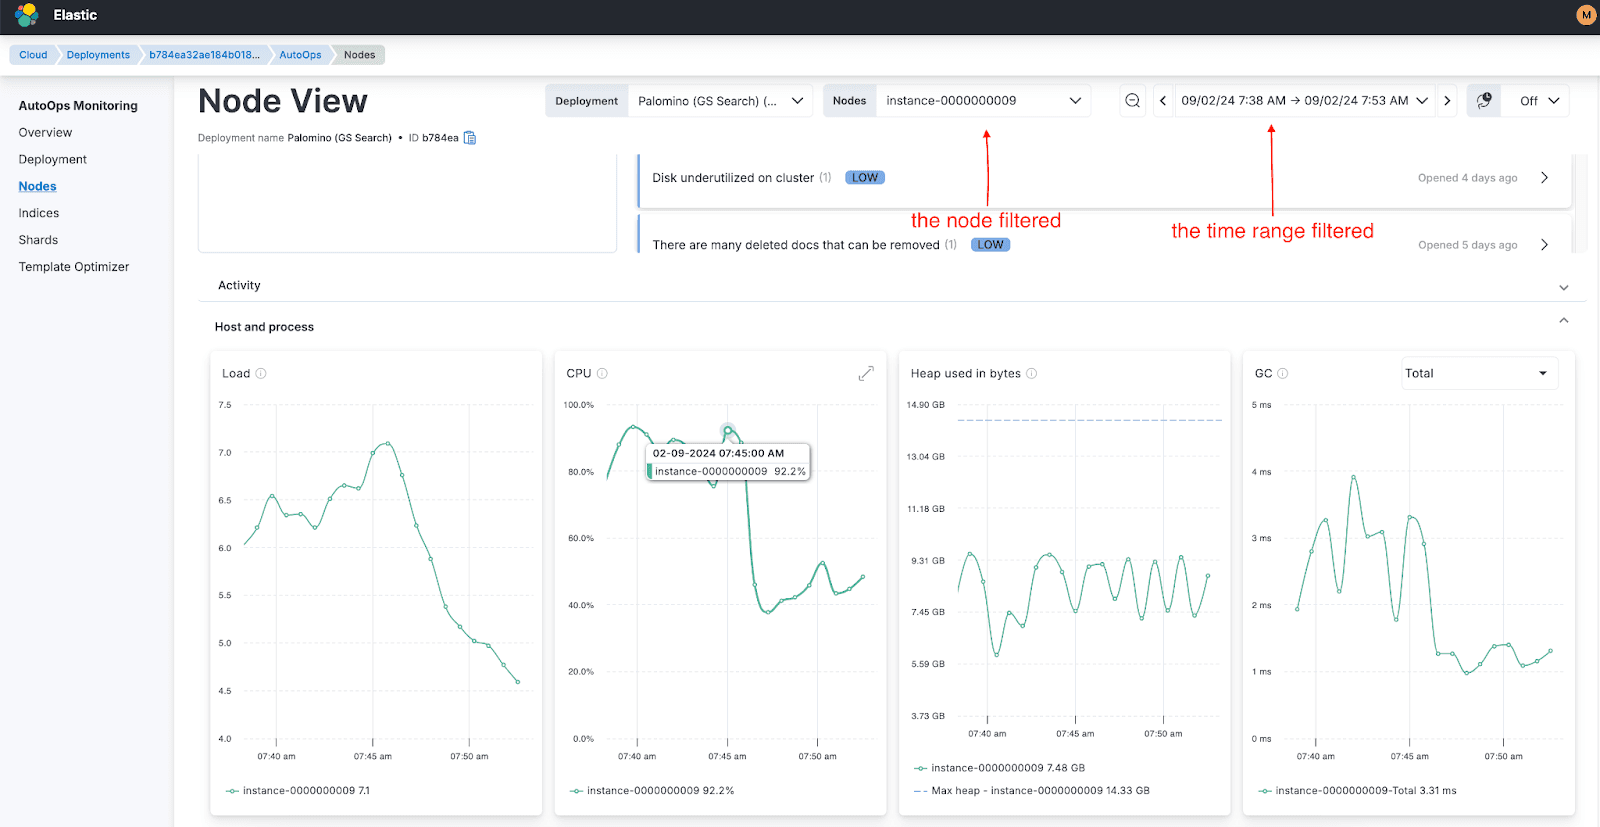
Focusing on the node with the highest CPU pressure (instance-0000000008), AutoOps filtered the graphs to highlight metrics specific to that node during the event window. This view confirmed significant CPU usage spikes.
Step 3: Broader investigation
By zooming out to analyze a larger time range, we observed that the CPU increase coincided with a rise in both search and indexing requests. Expanding the view further revealed that the issue was not limited to one node but affected all nodes in the cluster.
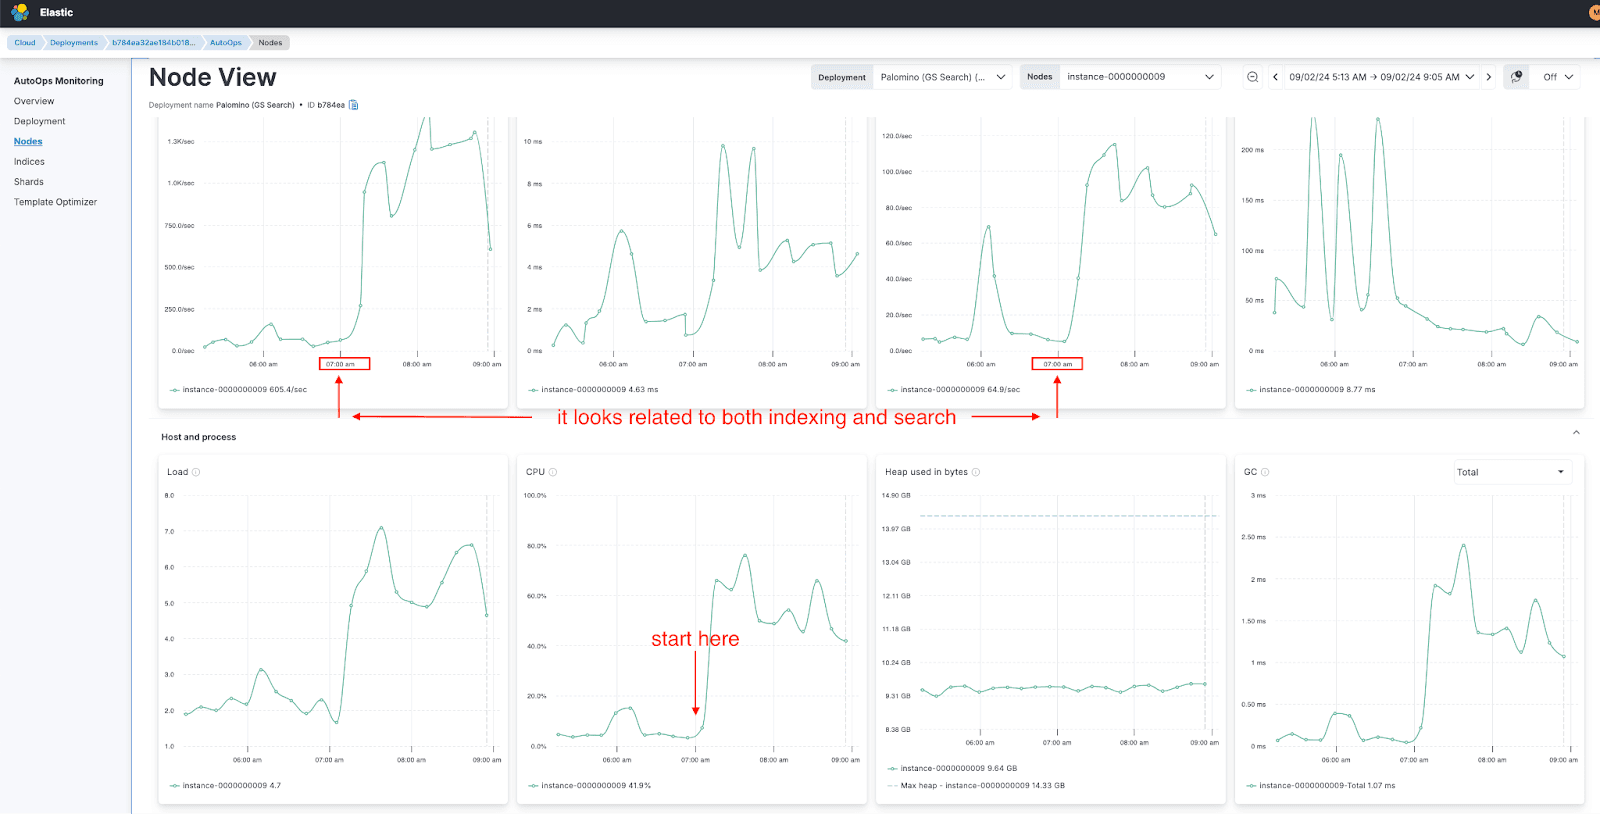
Step 4: Identifying patterns
The investigation revealed a critical pattern: a regular spike around 7:00 AM each day, triggered by simultaneous search and indexing requests. This repetitive behavior was the root cause of the high CPU utilization.
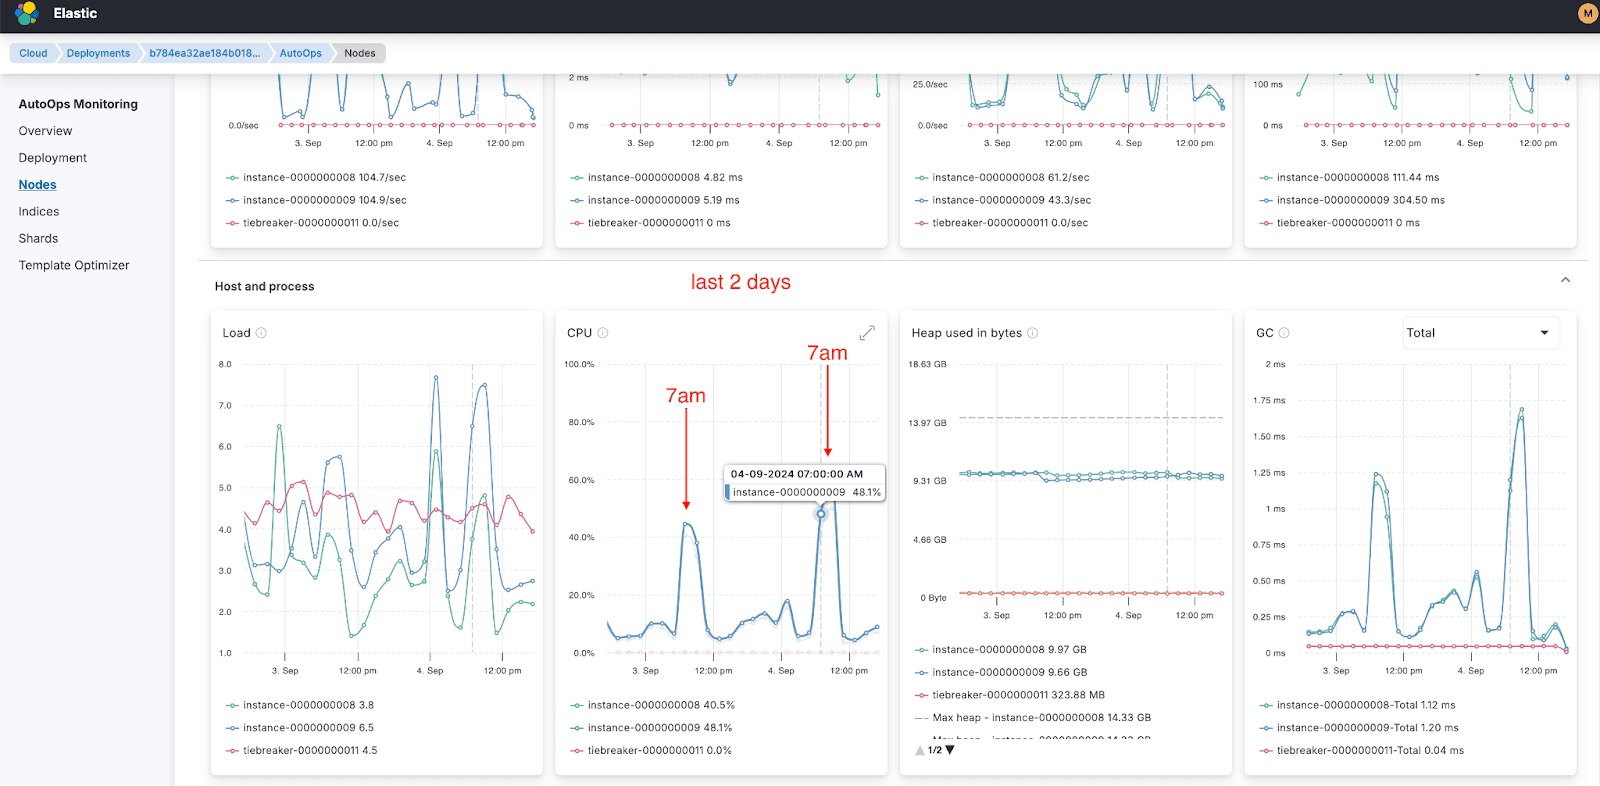
Step 5: Actionable insights
AutoOps provided three critical questions to ask the customer:
- What is happening every day at 7:40 AM (GMT+3)?
- Can these requests be distributed more evenly over time to decrease pressure?
- Have you monitored the CPU graph (AutoOps > Node View > Host and Process > CPU) at 7:00 AM after implementing changes?
Finding the root cause of problems generally takes 90% of the time, while fixing the problem takes 10%. Thanks to AutoOps, we were able to handle this 90% more easily and much faster.
Hint: To find the problematic query AutoOps plays a crucial role. It will help you find where the problematic query/indexing runs, eg, on which node, shard, and index. Also, thanks to the long_running_search_task event, without any manual effort, AutoOps can identify the problematic query and create an event with a recommended approach to fine-tune the query.
Benefits of using AutoOps
- Rapid Identification: AutoOps’ event-based monitoring pinpointed the affected node and time range within minutes.
- Clear Recommendations: Suggestions like enabling slow logs will help focus on troubleshooting efforts.
- Pattern Recognition: By correlating metrics across all nodes and timeframes, AutoOps uncovered the recurring nature of the issue.
- User-Friendly Views: Filtering and zooming capabilities made it easy to visualize trends and anomalies.
Conclusion
Thanks to AutoOps, we transformed a vague report of high CPU usage into a clear, actionable plan. By identifying a recurring pattern of activity, we provided the customer with the tools and insights to prevent similar issues in the future.
If your team manages production systems, incorporating tools like AutoOps into your workflow can significantly enhance visibility and reduce the time to resolve critical issues.
