Alerting
Customized triggers that spring automated workflows into action
Applications not responding. CPU and RAM utilization jumping. Signs of attack. See these warnings as they happen — not as part of the post-mortem.
Getting started with Elasticsearch: Store, search, and analyze with the free and open Elastic Stack.
Watch videoIntro to ELK: Get started with logs, metrics, data ingestion and custom vizualizations in Kibana.
Watch videoGetting started with Elastic Cloud: Launch your first deployment.
Learn moreCreate alerts in-app with context
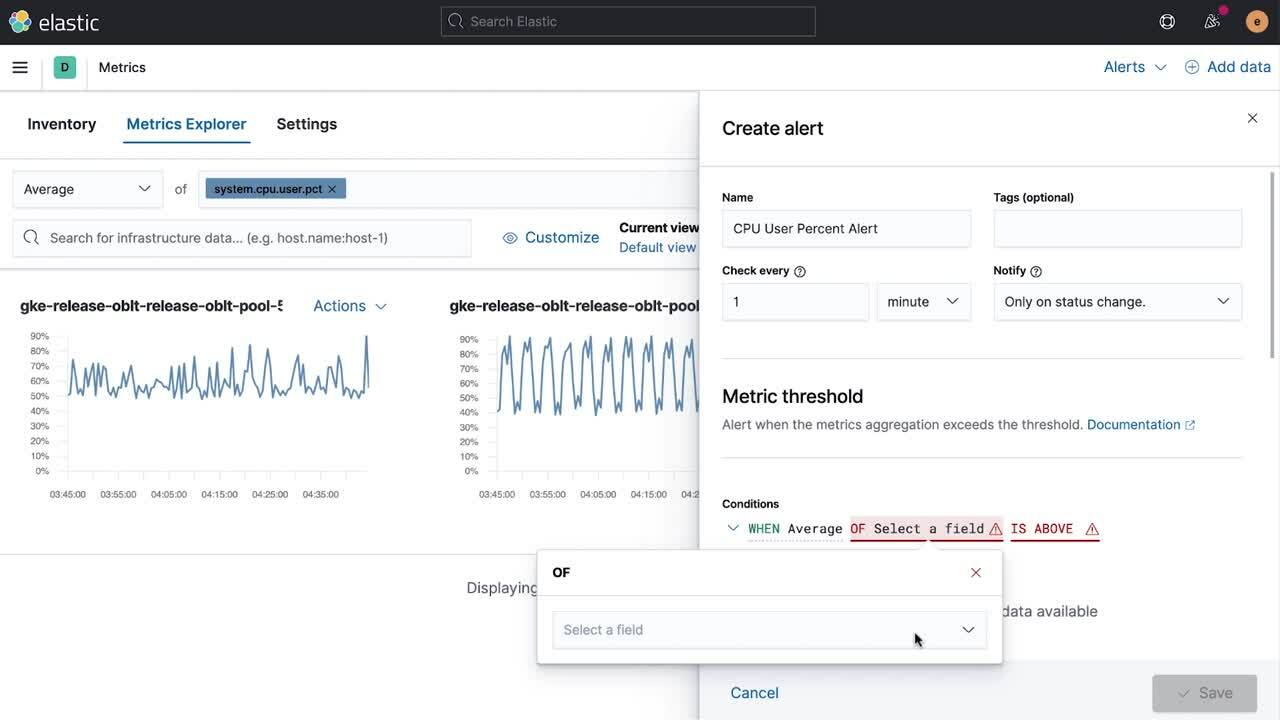
Often the idea to create an alert occurs when you're working with relevant data. Create alerts in the moment with a rich flyout menu — no matter if you’re fully immersed in the APM, Metrics, Uptime, or Security application.

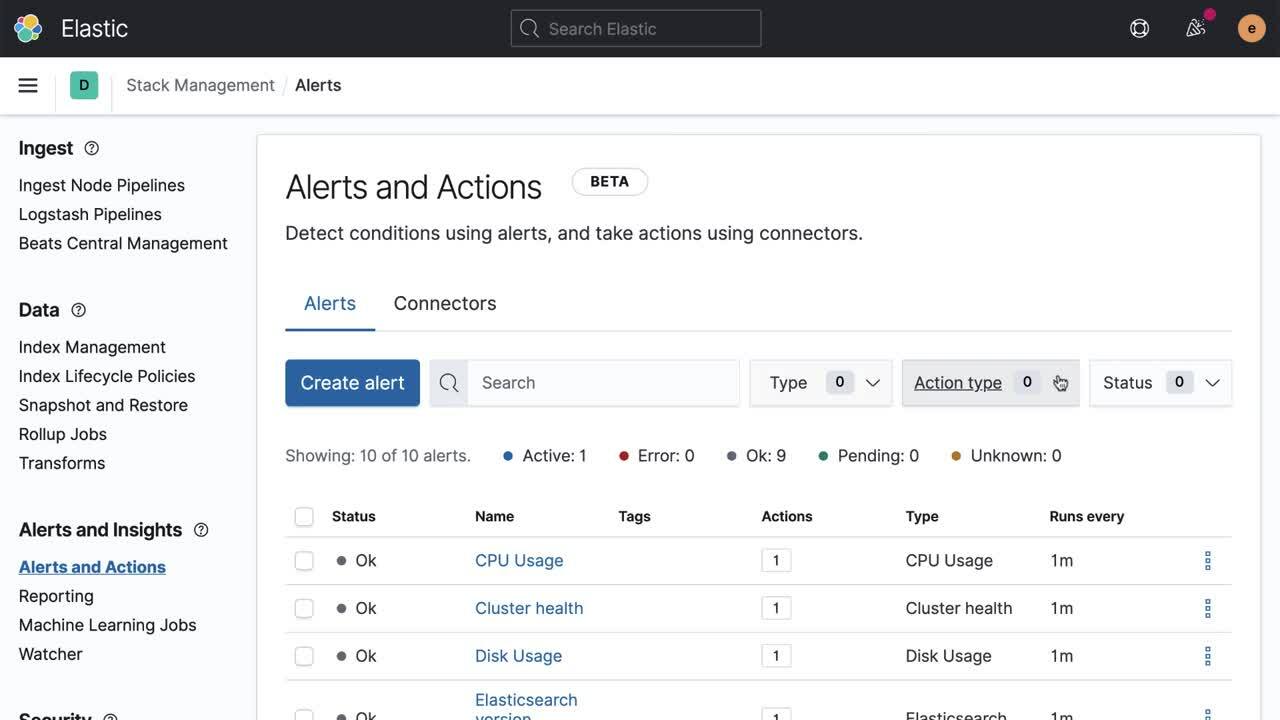
Monitor all of your alerts in one place in Kibana
Want a holistic view? Head to the Alerts and Actions section inside the Kibana Management tab to see, search, and filter all of your alerts from a central location.

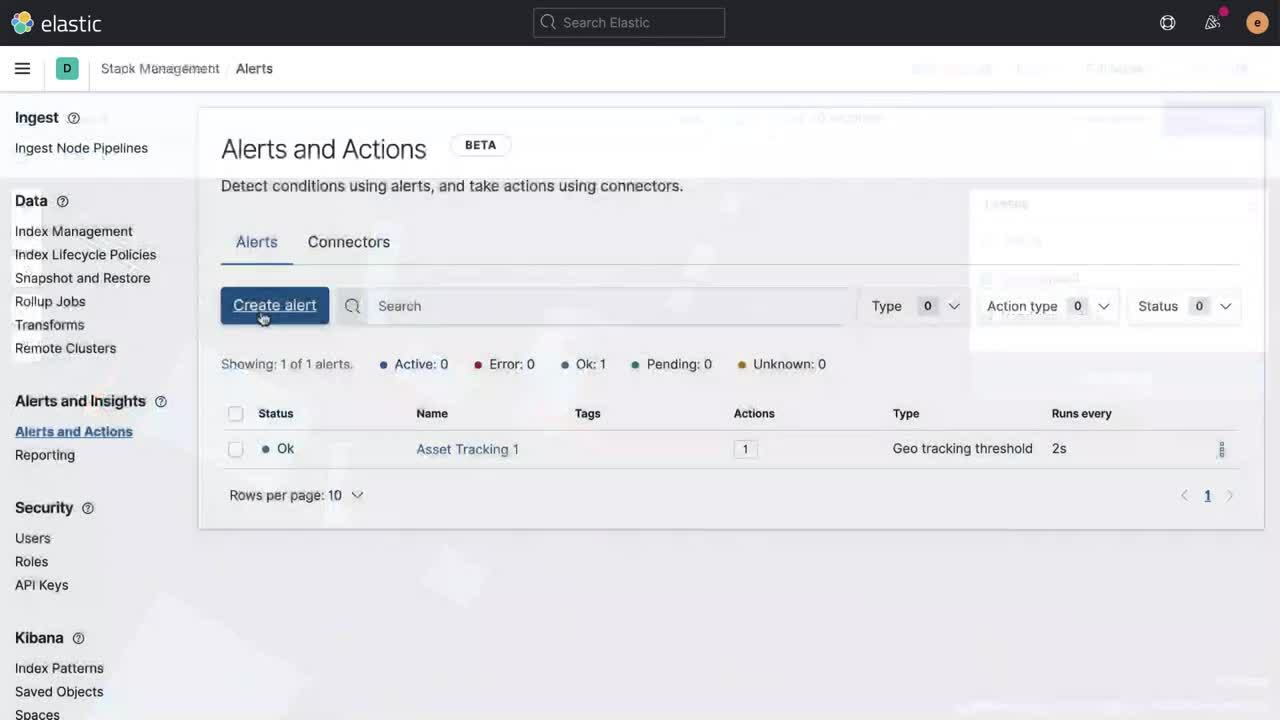
Use alerts with Elastic Maps to track entities that matter
Get notified when a moving object crosses a predefined geo boundary. Combine powerful mapping features with flexible alerting options to build a 24/7 real time geographic monitoring system.

Get notified, your way
Include relevant information in your alerts with easy to configure templates that give context and details for taking action.
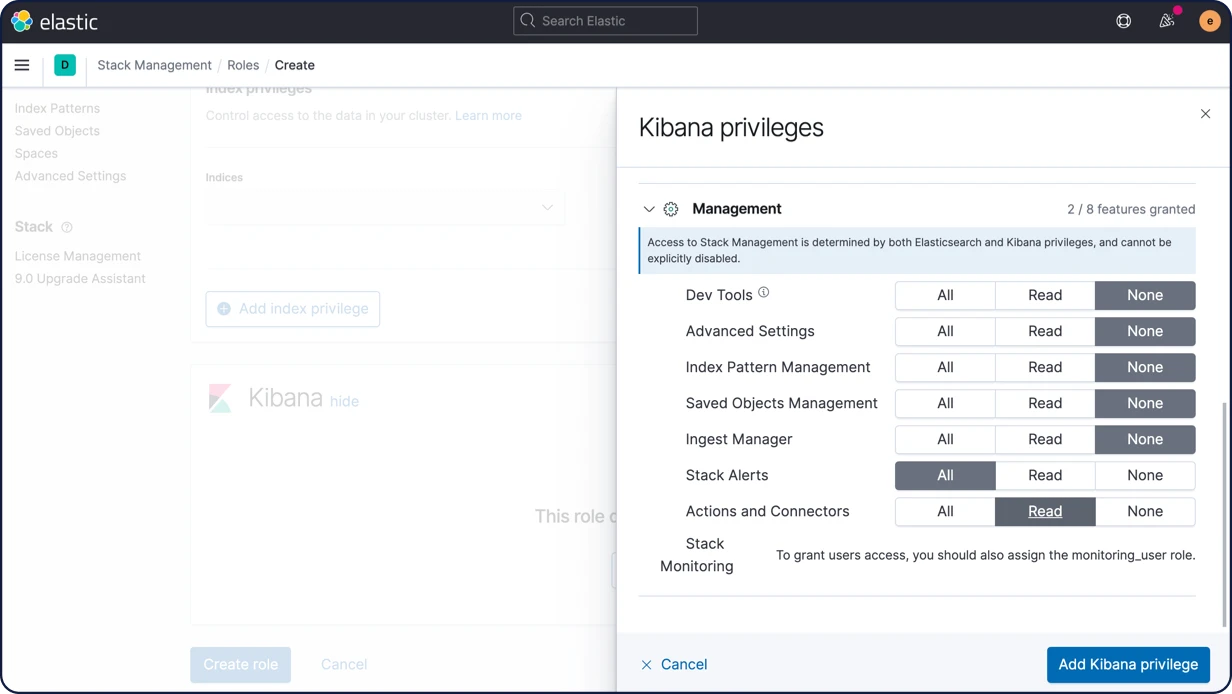
Control access to alerts with flexible permissions
Kibana’s simple, yet powerful security interface gives you the power to use role-based-access-control (RBAC) to decide who can both view and create alerts. What's more, you can even separately govern who has the ability to connect those alerts to third-party actions.

Learn from your Elasticsearch alert history
A complete history of all alert executions is indexed into Elasticsearch for easy tracking and visualization in Kibana. Are my alerts executing? How often are my conditions being met? What actions were taken?