Creating detection rules
editCreating detection rules
editThis functionality is in beta and is subject to change. The design and code is less mature than official GA features and is being provided as-is with no warranties. Beta features are not subject to the support SLA of official GA features.
Rules run periodically and search for source events or machine learning job anomaly scores that meet their criteria. When a rule’s criteria are met, a detections alert is created.
You can create these types of rules:
- Custom query: Query-based rule, which searches the defined indices and creates an alert when a document matches the rule’s query.
-
Machine learning: Machine learning rule, which creates an alert when a machine learning job discovers an anomaly above the defined threshold (see Anomaly Detection with Machine Learning).
For machine learning rules, the associated machine learning job must be running. If the machine learning job is not running, the rule will:
- Run and create alerts if existing anomaly scores above the defined threshold are discovered.
- Issue an error stating the machine learning job was not running when the rule executed.
-
Threshold rules: Searches the defined indices and creates a detections alert when the number of times the specified field’s value meets the threshold during a single execution. When multiple values meet the threshold, an alert is generated for each value.
For example, if the threshold
fieldissource.ipand itsvalueis10, an alert is generated for every source IP address that appears in at least 10 of the rule’s search results.
When creating or modifying rules, you can add exceptions that prevent a rule from generating an alert even when its criteria are met. This is useful for reducing noise, such as preventing alerts from trusted processes and internal IP addresses. Rule exceptions and value lists describes how to add exceptions to a rule.
For both prebuilt and custom rules, you can use the Kibana Alerting and Actions feature to send notifications when alerts are created. Notifications can be sent via Email, PagerDuty, Slack, and Webhook, and can be configured when you create or edit a rule.
Creating a new rule is made up of a number of steps:
After you activate a rule, periodically check the rule is running as expected
in the Monitoring tab on the All rules page. If you see
values in the Gap column, you can Troubleshoot missing alerts.
When a rule fails to run, the Elastic Security app tries to rerun it at its next scheduled run time.
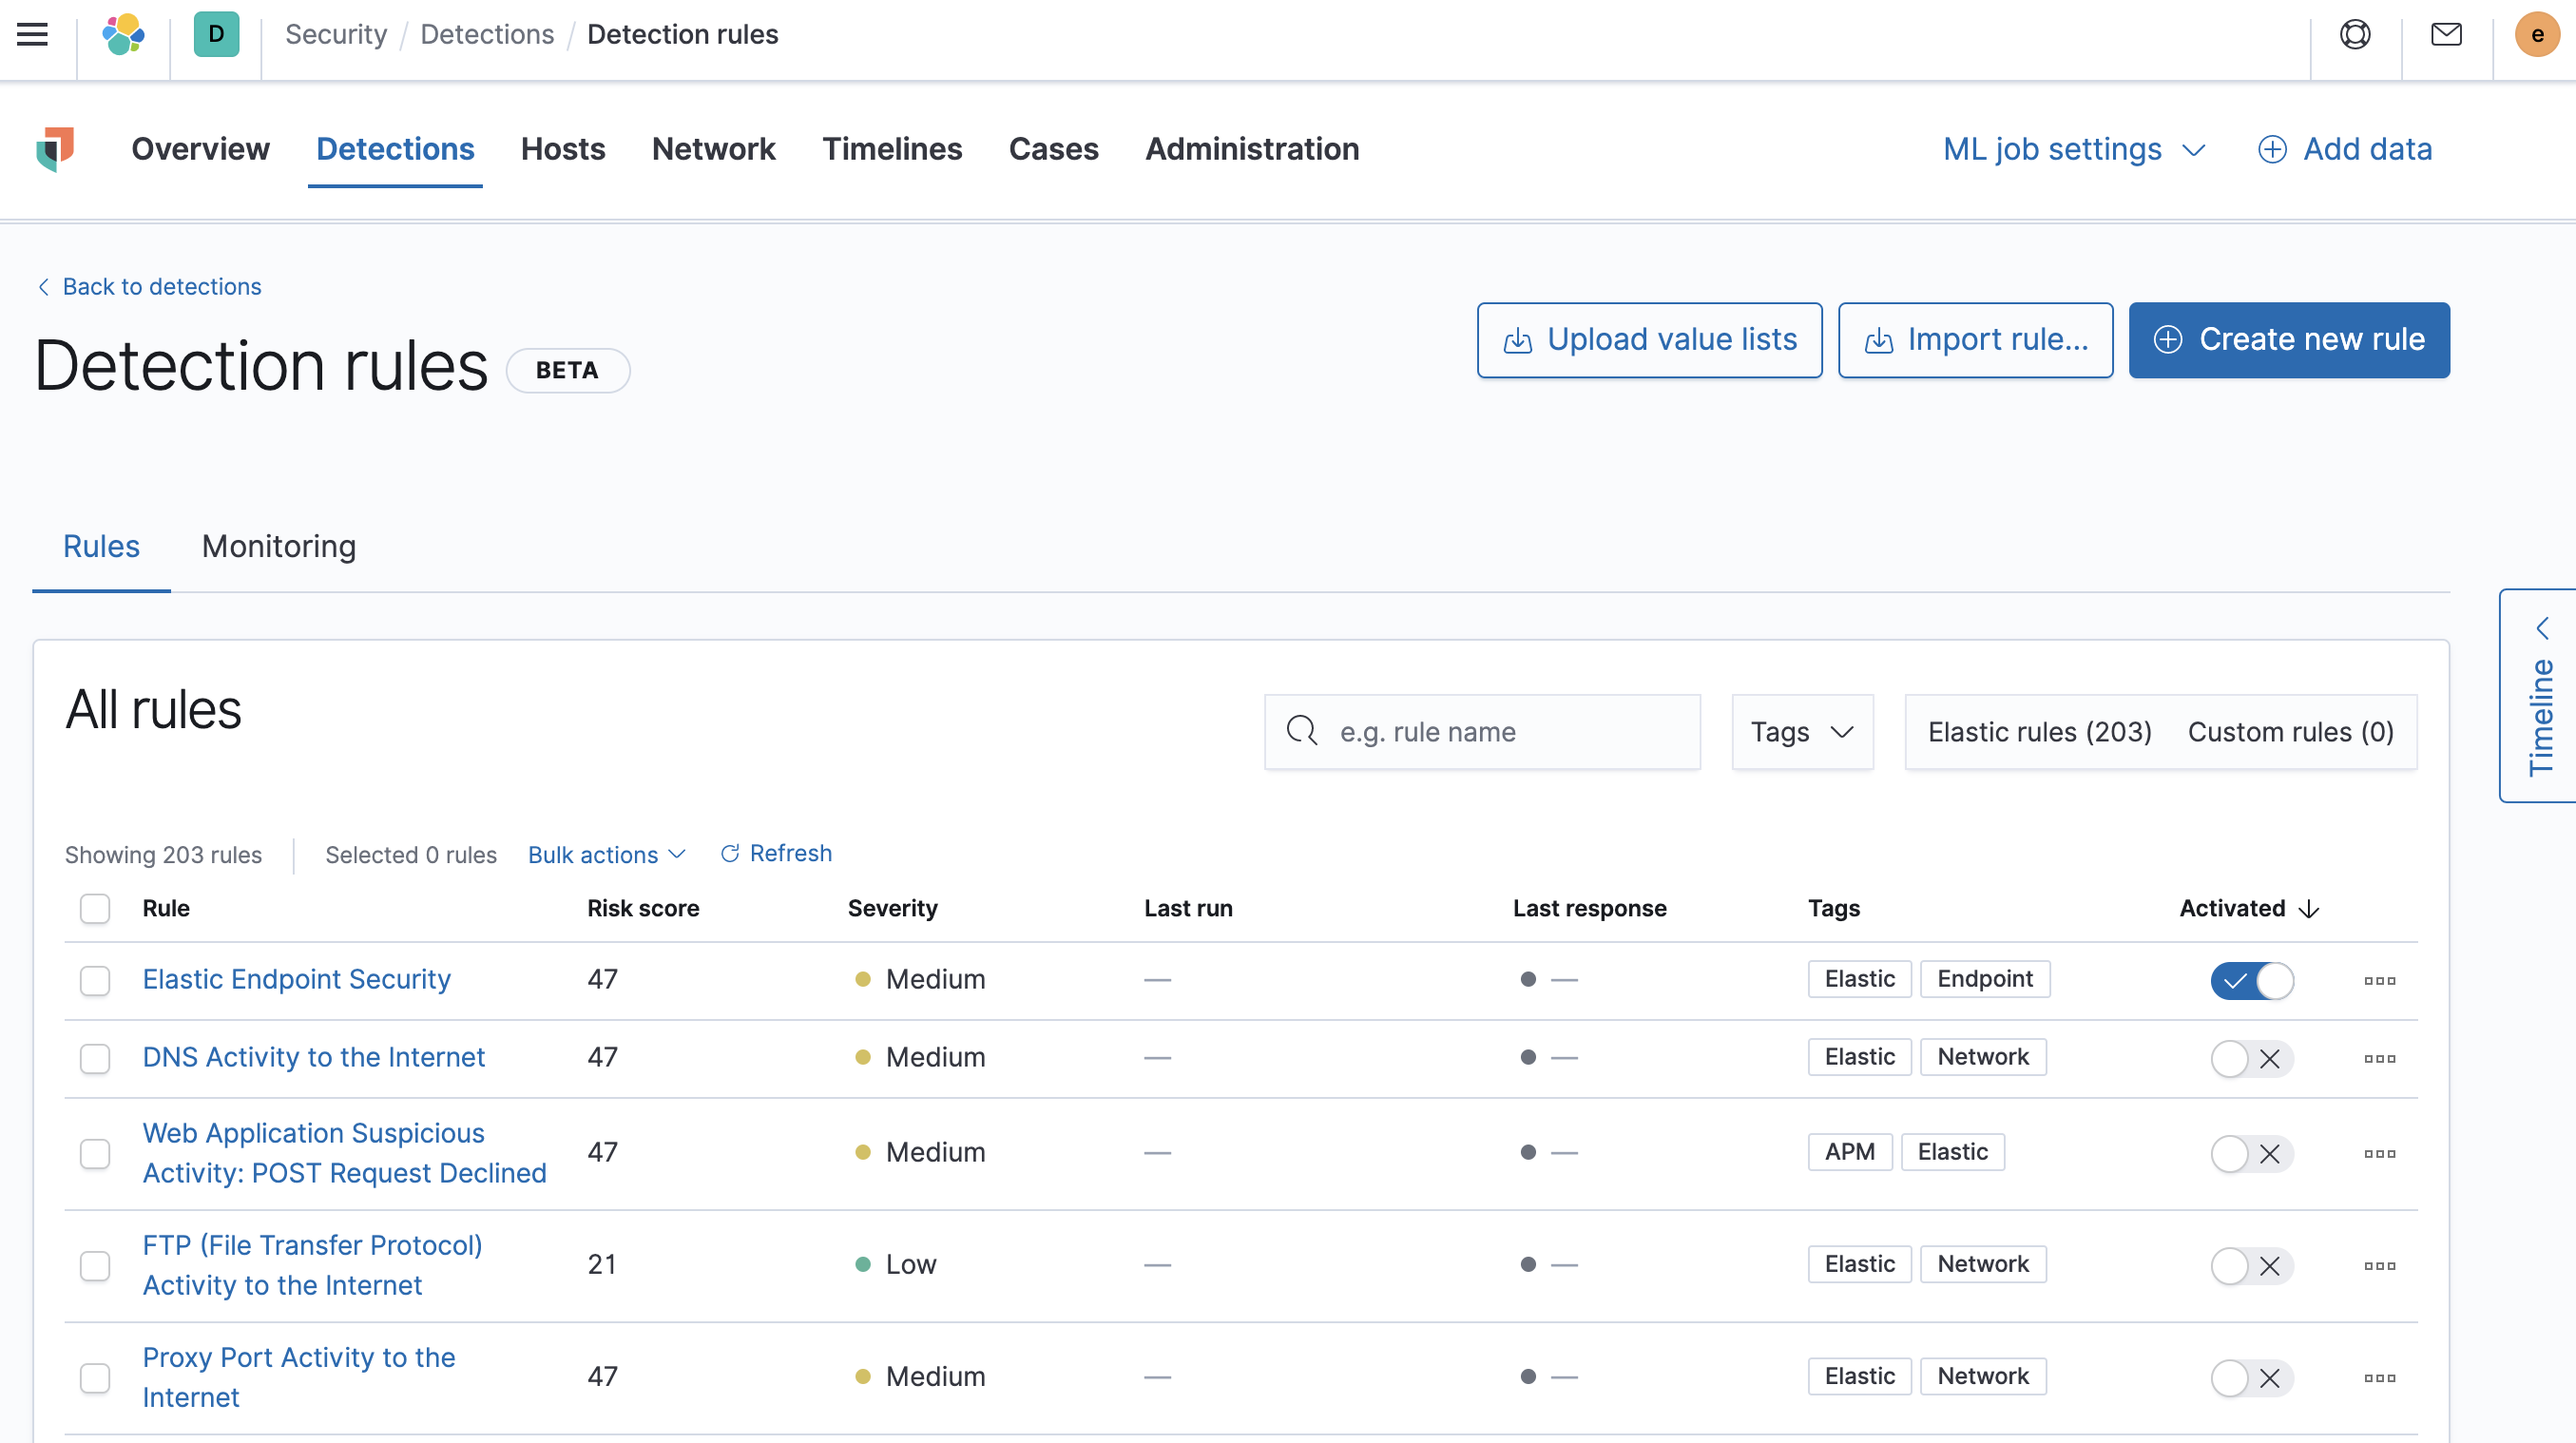
Select rule type and scope
edit- Go to Security → Detections → Manage detection rules.
-
Click Create new rule.
The Create new rule page is displayed.
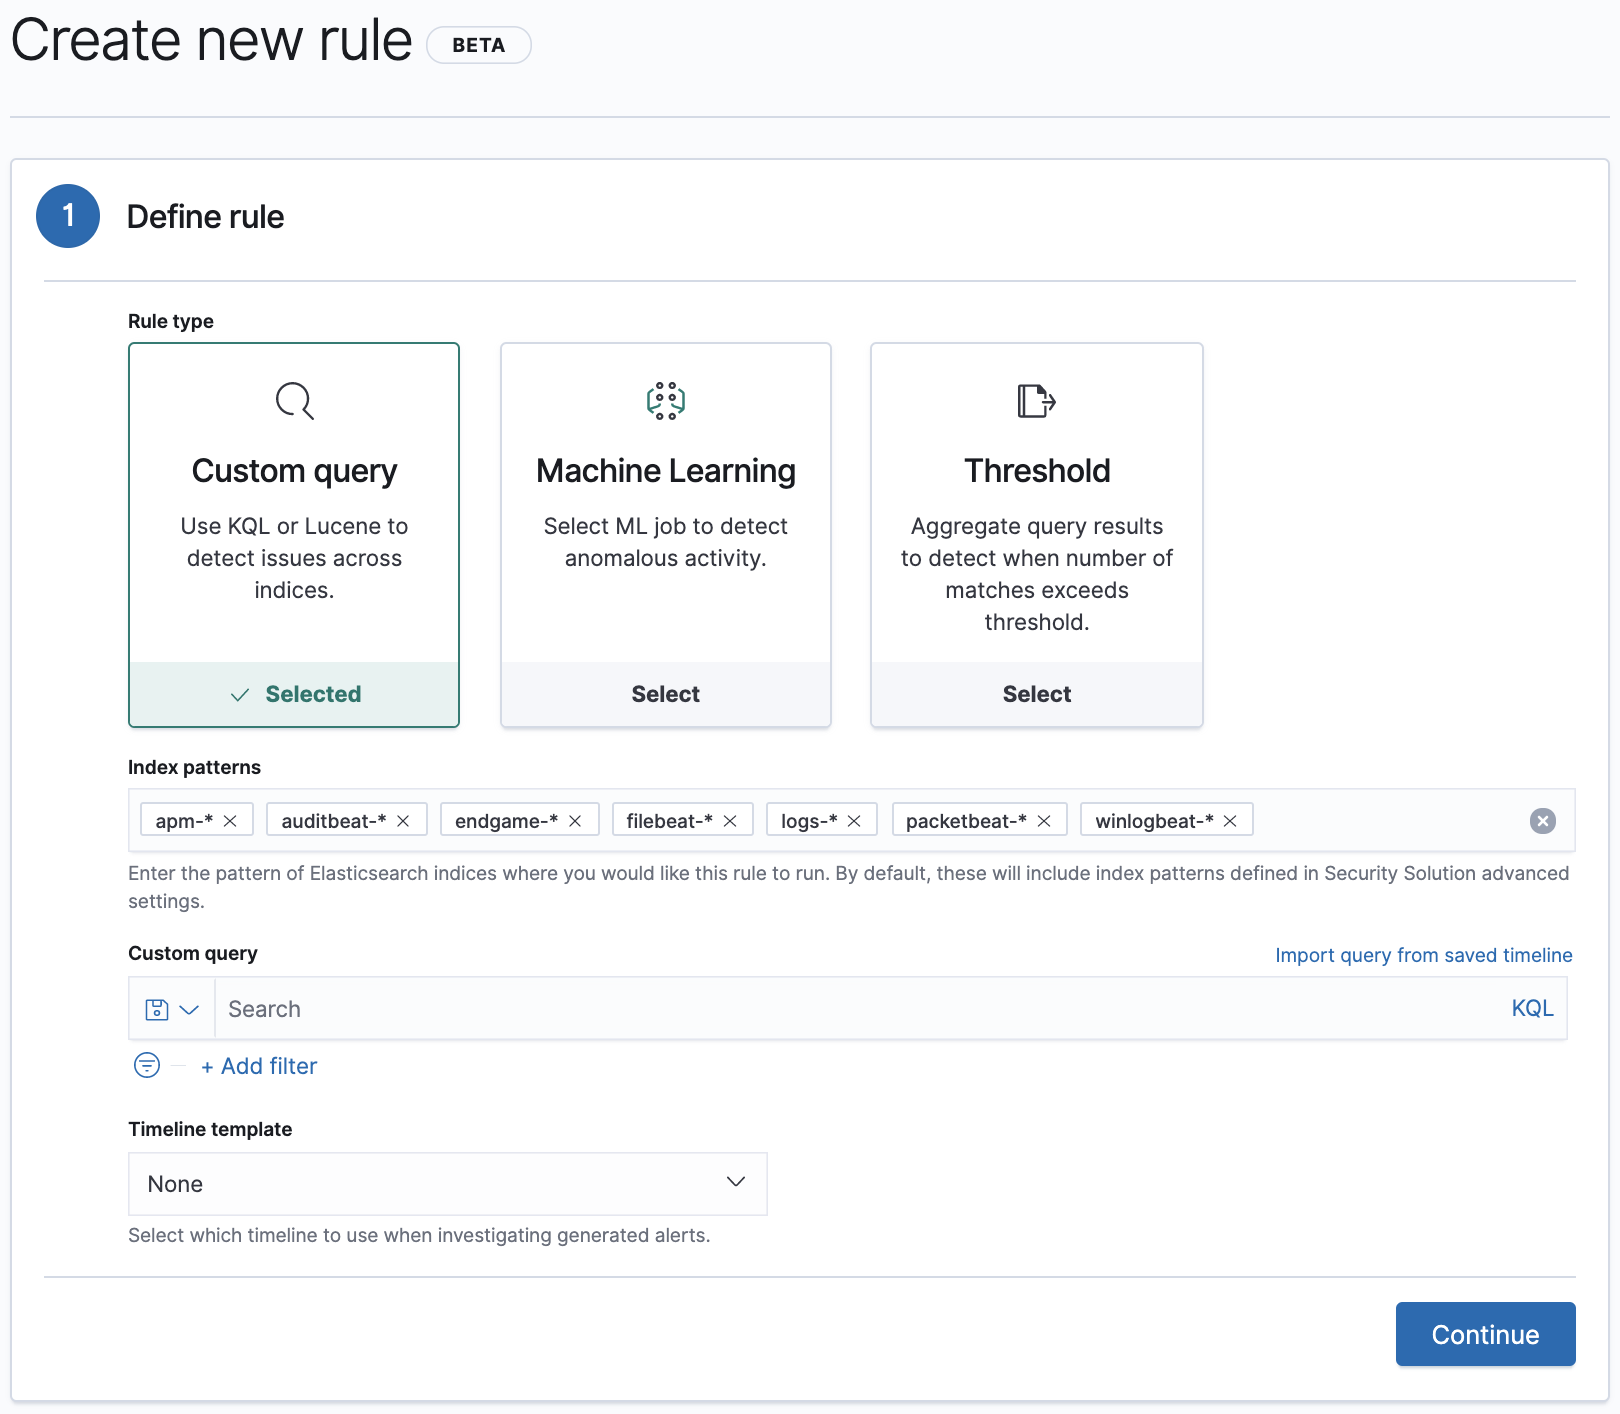
-
Do one of the following:
-
To create a rule based on a machine learning anomaly threshold, select Machine Learning and then:
- The required machine learning job.
-
The anomaly score threshold above which alerts are created.
To create or edit machine learning rules, you must have the appropriate license or use a cloud deployment. Additionally, you must have the
machine_learning_adminuser role, and the selected machine learning job must be running for the rule to function correctly.
-
To create a rule based on a KQL or Lucene query, select Custom query and then:
- Define which Elasticsearch indices the rule searches for alerts.
-
Use the filter and query fields to create the criteria used for detecting alerts.
You can use Kibana saved queries (save icon) and queries from saved timelines (
Import query from saved timeline) as rule conditions.For example, the following rule detects when the
vssadmin delete shadowsWindows command is executed:-
Index patterns:
winlogbeat-*Winlogbeat ships Windows event logs to Elastic Security.
-
Custom query:
event.action:"Process Create (rule: ProcessCreate)" and process.name:"vssadmin.exe" and process.args:("delete" and "shadows")Searches the
winlogbeat-*indices forvssadmin.exeexecutions with thedeleteandshadowarguments, which are used to delete a volume’s shadow copies.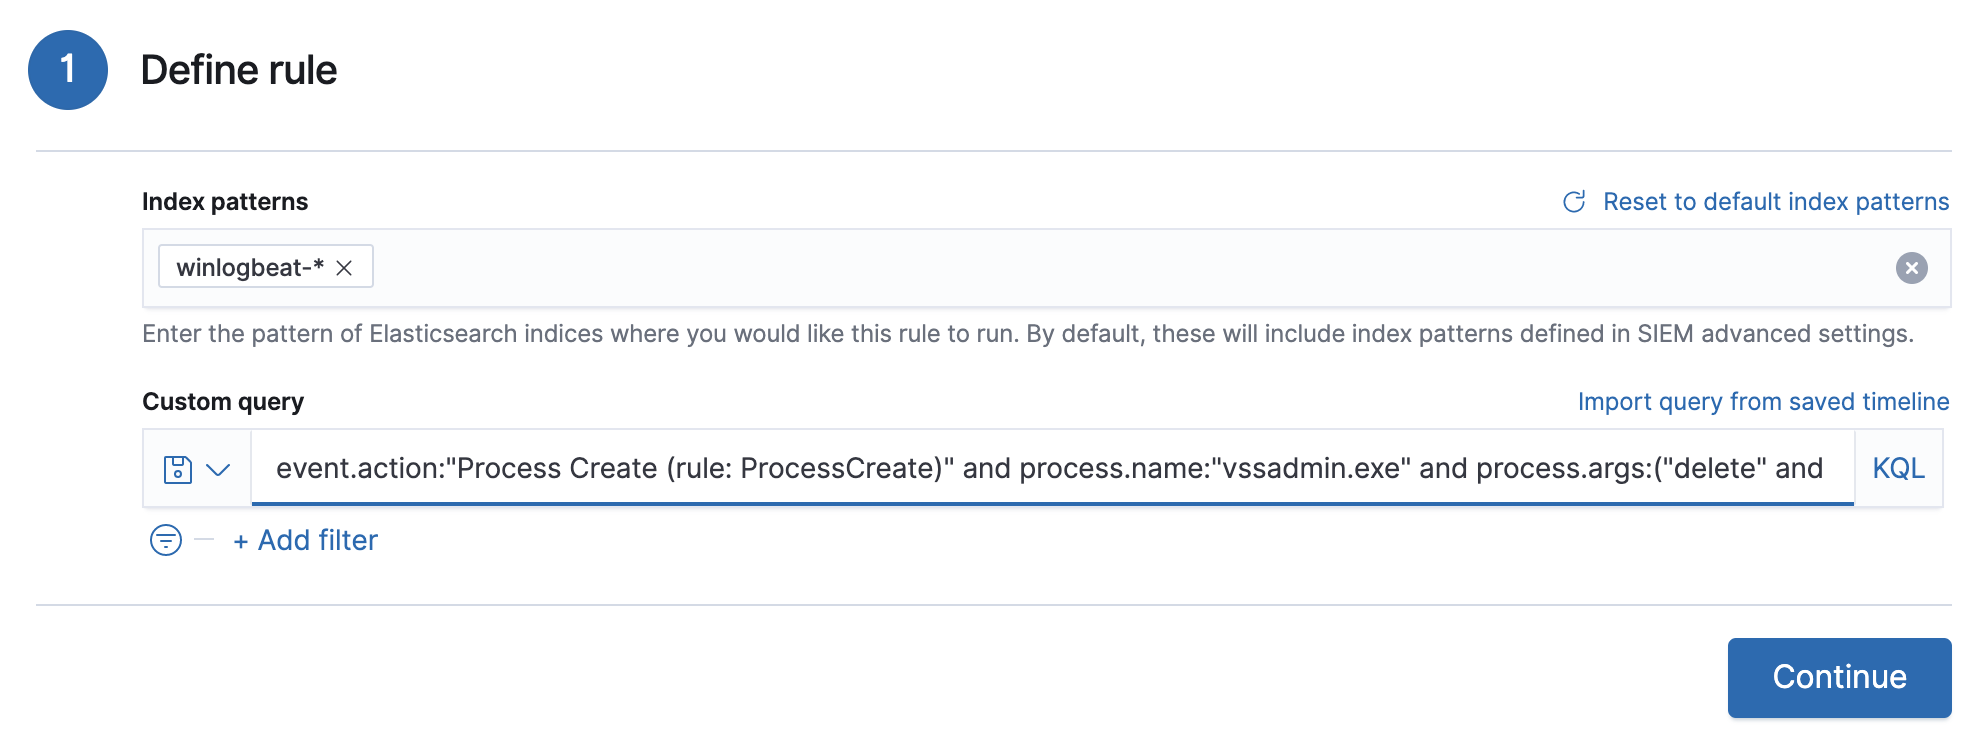
This example is based on the Volume Shadow Copy Deletion via VssAdmin prebuilt rule.
-
-
To create a rule based on a source event field threshold, select Threshold and then:
- Define which Elasticsearch indices the rule analyzes for alerts.
- Use the filter and query fields to create the criteria used for detecting alerts.
-
Use the Field and Threshold fields to determine which source event field is used as a threshold and the threshold’s value.
For example, if the Field is
source.ipand its Threshold is10, an alert is generated for every source IP address that appears in at least 10 of the rule’s search results.You can also leave the Field undefined. The rule then creates an alert when the number of search results is equal to or greater than the Threshold value.
If you want an alert for 10 or more failed login attempts to a specific host per rule execution:
-
Custom query:
host.name : liv-win-19 and event.category : "authentication" and event.outcome : "failure" - Field: Leave blank
-
Threshold:
10
-
Custom query:
-
-
Select the Timeline template used when you investigate an alert created by the rule in Timeline (optional).
Before you create rules, create Timeline templates so they can be selected here. When alerts generated by the rule are investigated in Timeline, Timeline query values are replaced with their corresponding alert field values.
-
Click Continue.
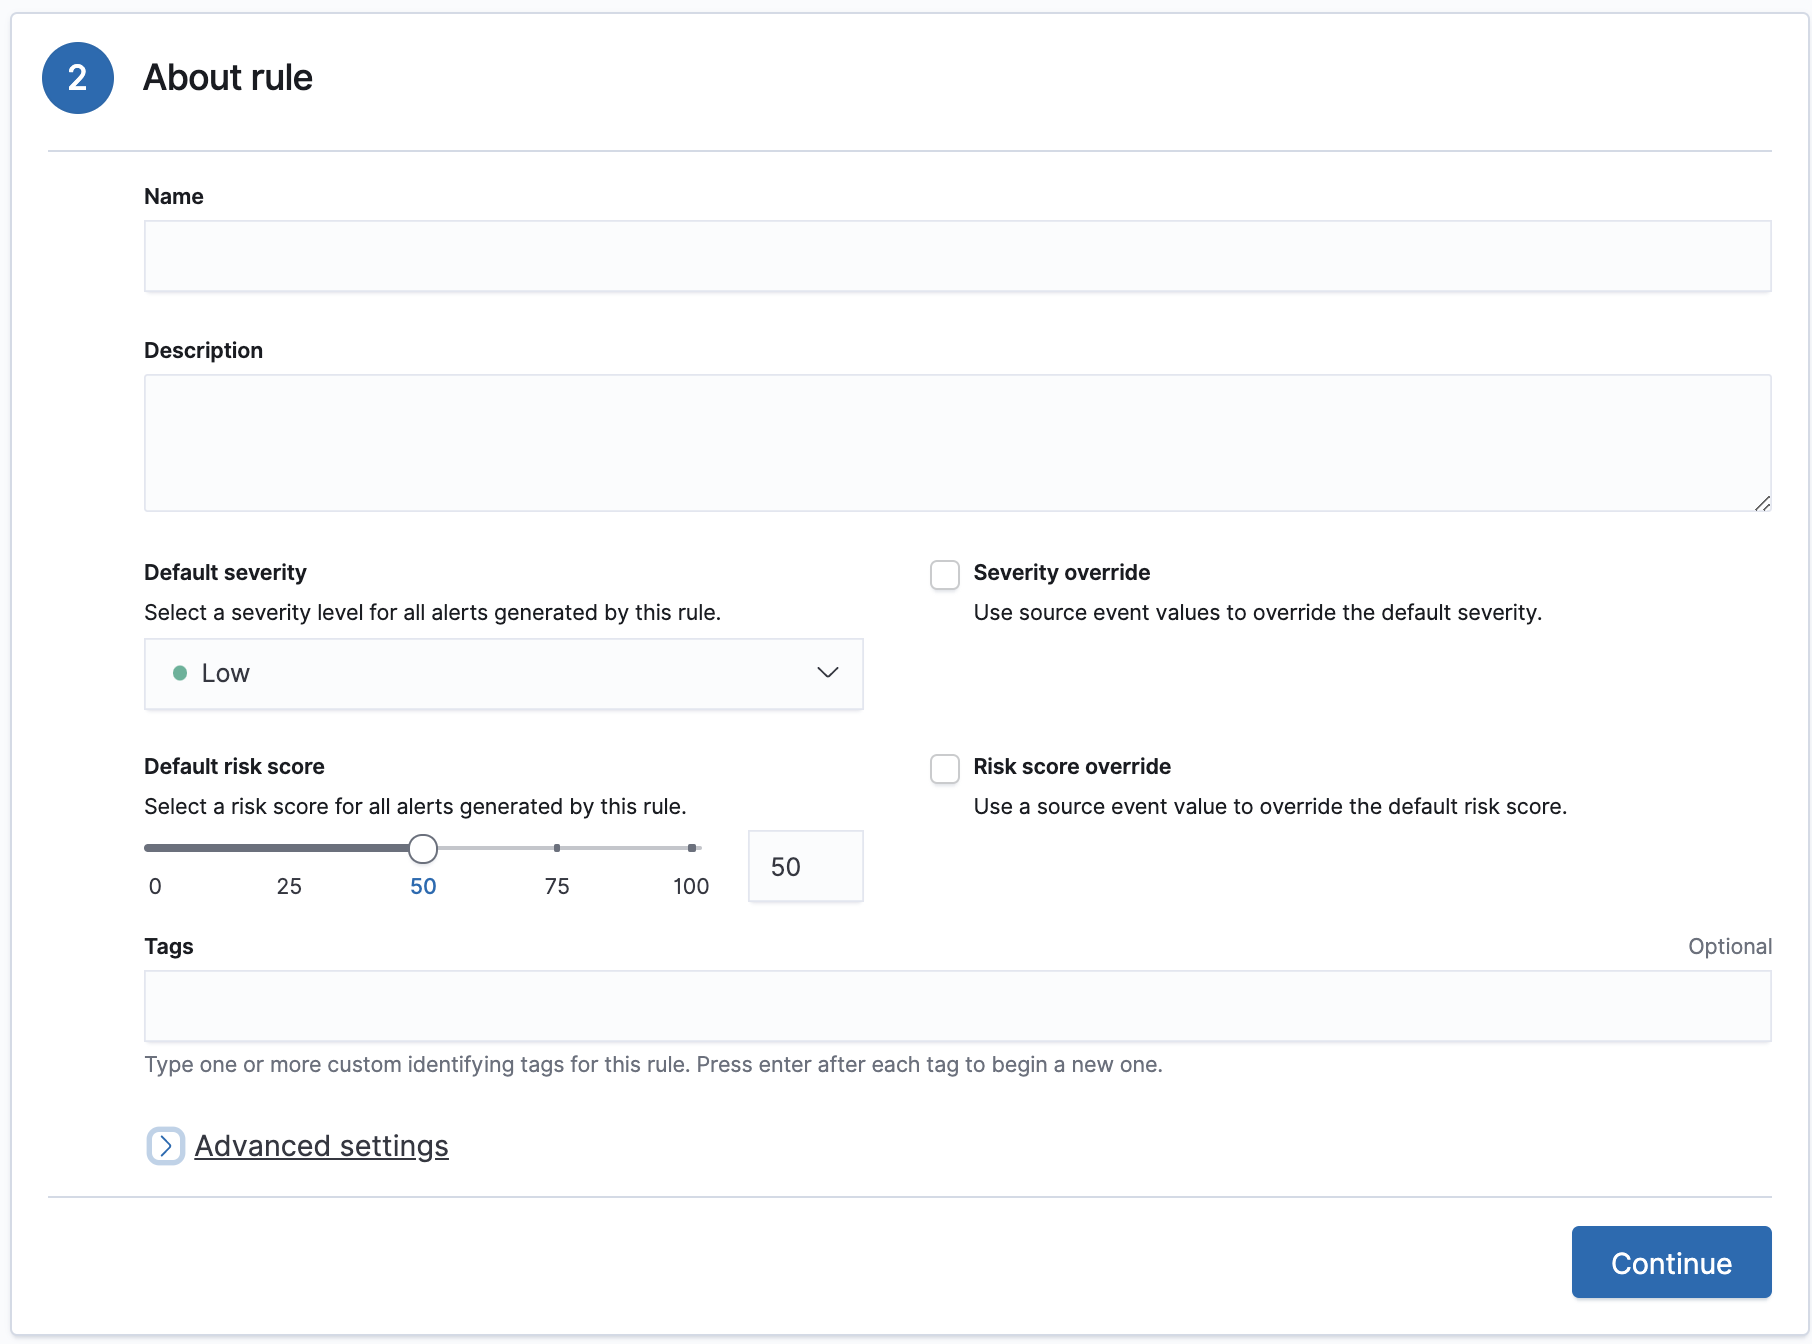
The About rule pane is displayed.
- Continue with Configure basic rule settings.
Configure basic rule settings
edit-
Fill in the following fields:
- Name: The rule’s name.
- Description: A description of what the rule does.
-
Default severity: Select the severity level of alerts created by the rule:
-
Low: Alerts that are of interest but generally not considered to be security incidents. Sometimes, a combination of low severity events can indicate suspicious activity. -
Medium: Alerts that require investigation. -
High: Alerts that require an immediate investigation. -
Critical: Alerts that indicate it is highly likely a security incident has occurred.
-
-
Severity override (optional): Select to use source event values to override the Default severity in generated alerts. When selected, a UI component is displayed where you can map the source event field values to severity levels. For example, if you want to map severity levels to
host.namevalues: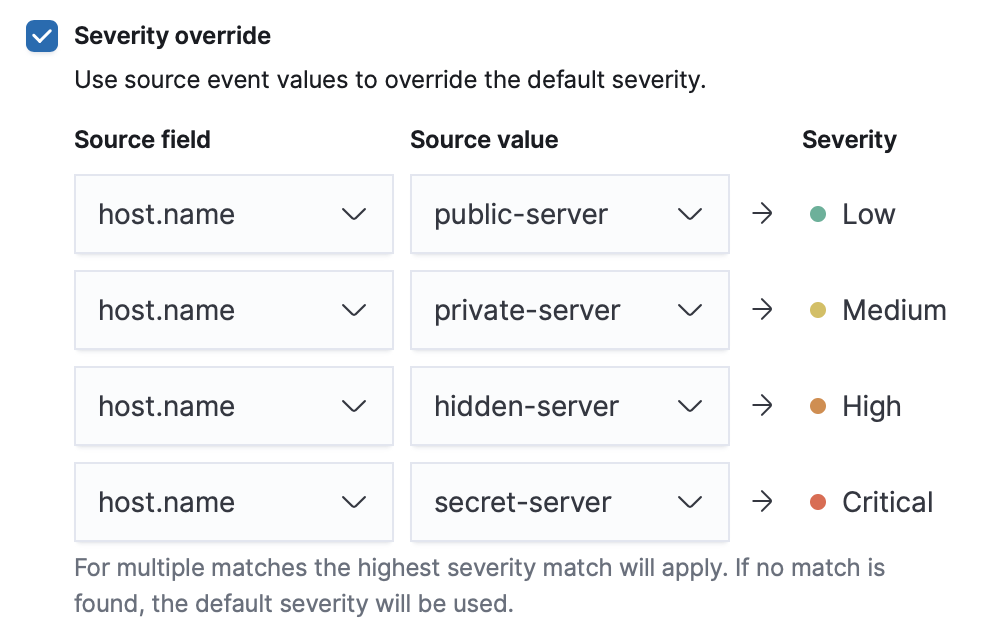
-
Default risk score: A numerical value between 0 and 100 that correlates with the Severity level. General guidelines are:
-
0-21represents low severity. -
22-47represents medium severity. -
48-73represents high severity. -
74-100represents critical severity.
-
-
Risk score override (optional): Select to use a source event value to override the Default risk score in generated alerts. When selected, a UI component is displayed where you can select the source field used for the risk score. For example, if you want to use the source event’s risk score in alerts:
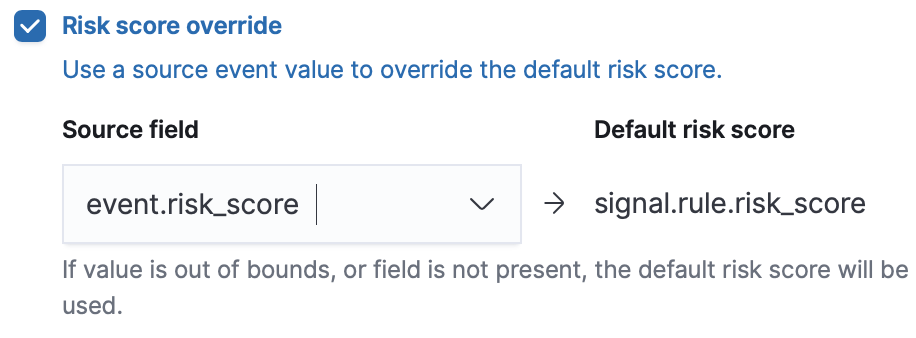
-
Continue with one of the following:
Configure advanced rule settings (optional)
edit-
Click Advanced settings and fill in these fields:
- Reference URLs (optional): References to information that is relevant to the rule. For example, links to background information.
- False positives (optional): List of common scenarios that may produce false-positive alerts.
- MITRE ATT&CKTM (optional): Relevant MITRE framework tactics and techniques.
- Tags (optional): Words and phrases used to categorize, filter, and search the rule.
- Investigation guide (optional): Information for analysts investigating alerts created by the rule.
- Author (optional): The rule’s authors.
- License (optional): The rule’s license.
-
Elastic endpoint exceptions (optional): Adds all Elastic Endpoint Security rule exceptions to this rule (see Rule exceptions and value lists).
If you select this option, you can add Endpoint exceptions on the Rule details page. Additionally, all future exceptions added to the Elastic Endpoint Security rule also affect this rule.
- Building block (optional): Select to create a building-block rule. By default, alerts generated from a building-block rule are not displayed in the UI. See About building-block rules for more information.
-
Rule name override (optional): Select a source event field to use as the
rule name in the UI (Alerts table). This is useful for exposing, at a glance,
more information about an alert. For example, if the rule generates alerts from
Suricata, selecting
event.actionlets you see what action (Suricata category) caused the event directly in the Alerts table. -
Timestamp override (optional): Select a source event timestamp field. When selected, the rule’s query uses the selected field, instead of the default
@timestampfield, to search for alerts. This can help reduce missing alerts due to network or server outages. Specifically, if your ingest pipeline adds a timestamp when events are sent to Elasticsearch, this avoids missing alerts due to ingestion delays.
-
Click Continue.
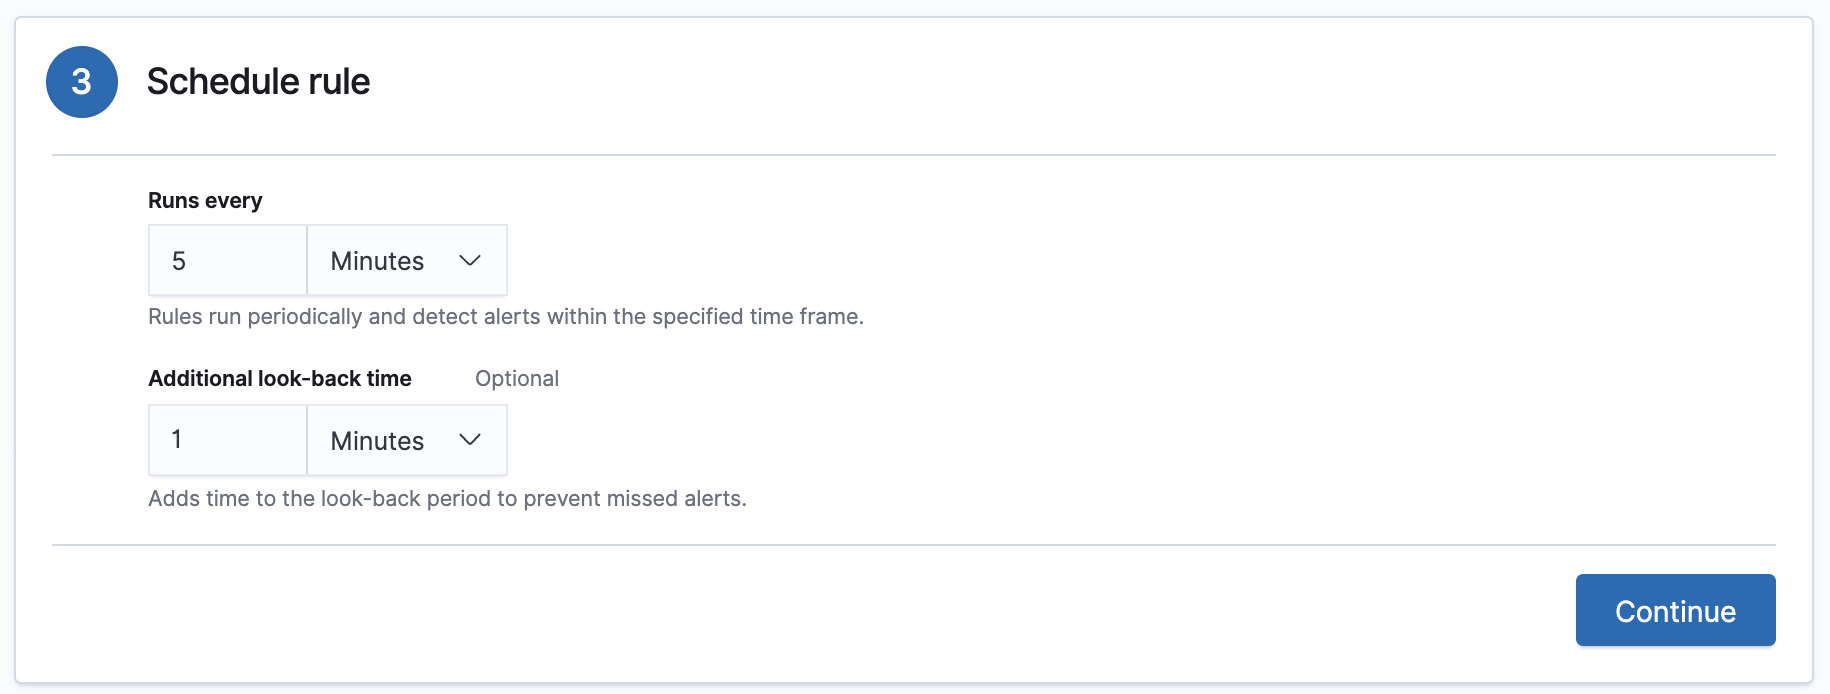
The Schedule rule pane is displayed.
- Continue with Set the rule’s schedule.
Set the rule’s schedule
edit- Select how often the rule runs.
-
Optionally, add
Additional look-back timeto the rule. When defined, the rule searches indices with the additional time.For example, if you set a rule to run every 5 minutes with an additional look-back time of 1 minute, the rule runs every 5 minutes but analyses the documents added to indices during the last 6 minutes.
It is recommended to set the
Additional look-back timeto at least 1 minute. This ensures there are no missing alerts when a rule does not run exactly at its scheduled time.The Elastic Security app performs deduplication. Duplicate alerts discovered during the
Additional look-back timeare not created. -
Click Continue.
The Rule actions pane is displayed.

-
Do one of the following:
- Continue with Set up alert notifications (optional).
- Create the rule (with or without activation).
Set up alert notifications (optional)
editUse Kibana Actions to set up notifications sent via other systems when alerts are generated.
To use Kibana Actions for alert notifications, you need the appropriate license.
-
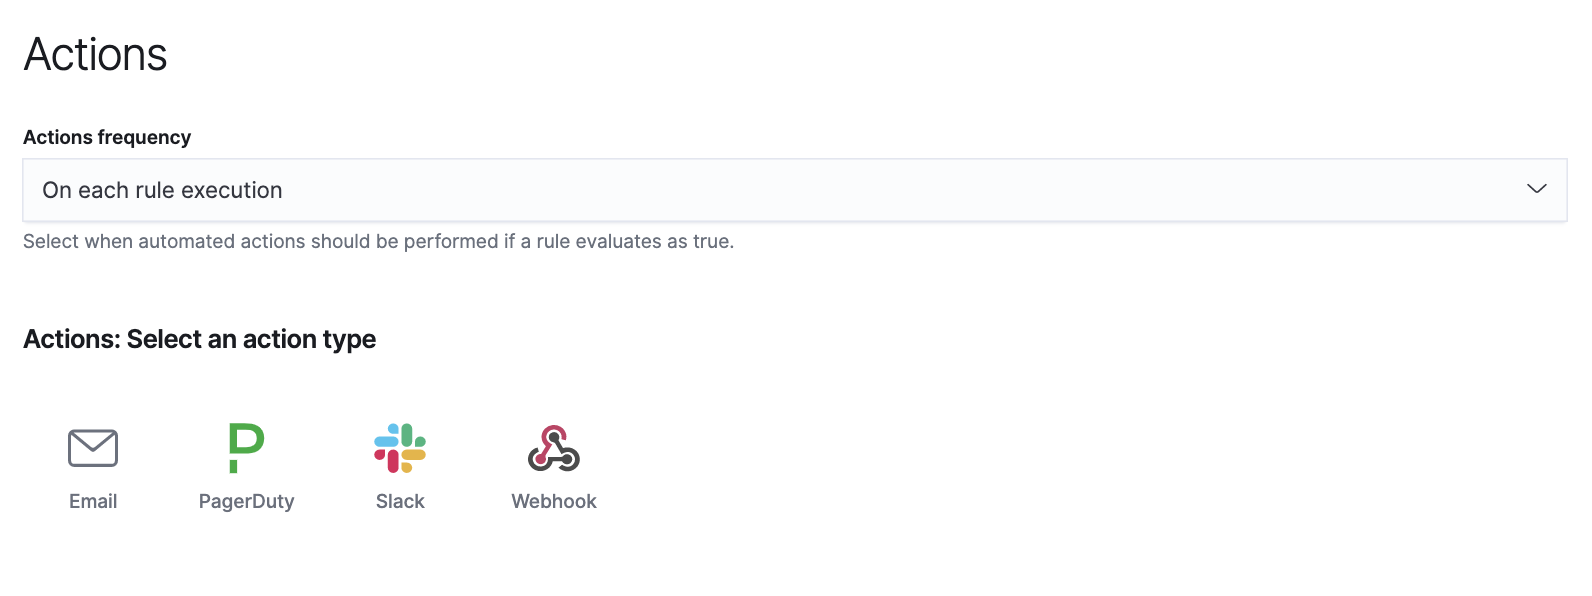
Set when to send notifications:
- On each rule execution: Sends a notification every time new alerts are generated.
- Hourly: Sends a notification every hour.
- Daily: Sends a notification every day.
-
Weekly: Sends a notification every week.
Notifications are sent only when new alerts are generated.
The available action types are displayed.
-
Select the required action type, which determines how notifications are sent (Email, PagerDuty, Slack, Webhook).
Each action type requires a connector. Connectors store the information required to send the notification from the external system. You can configure connectors while creating the rule or on the Kibana Alerts and Actions page (Management → Alerts and Actions → Connectors). For more information, see Action and connector types.
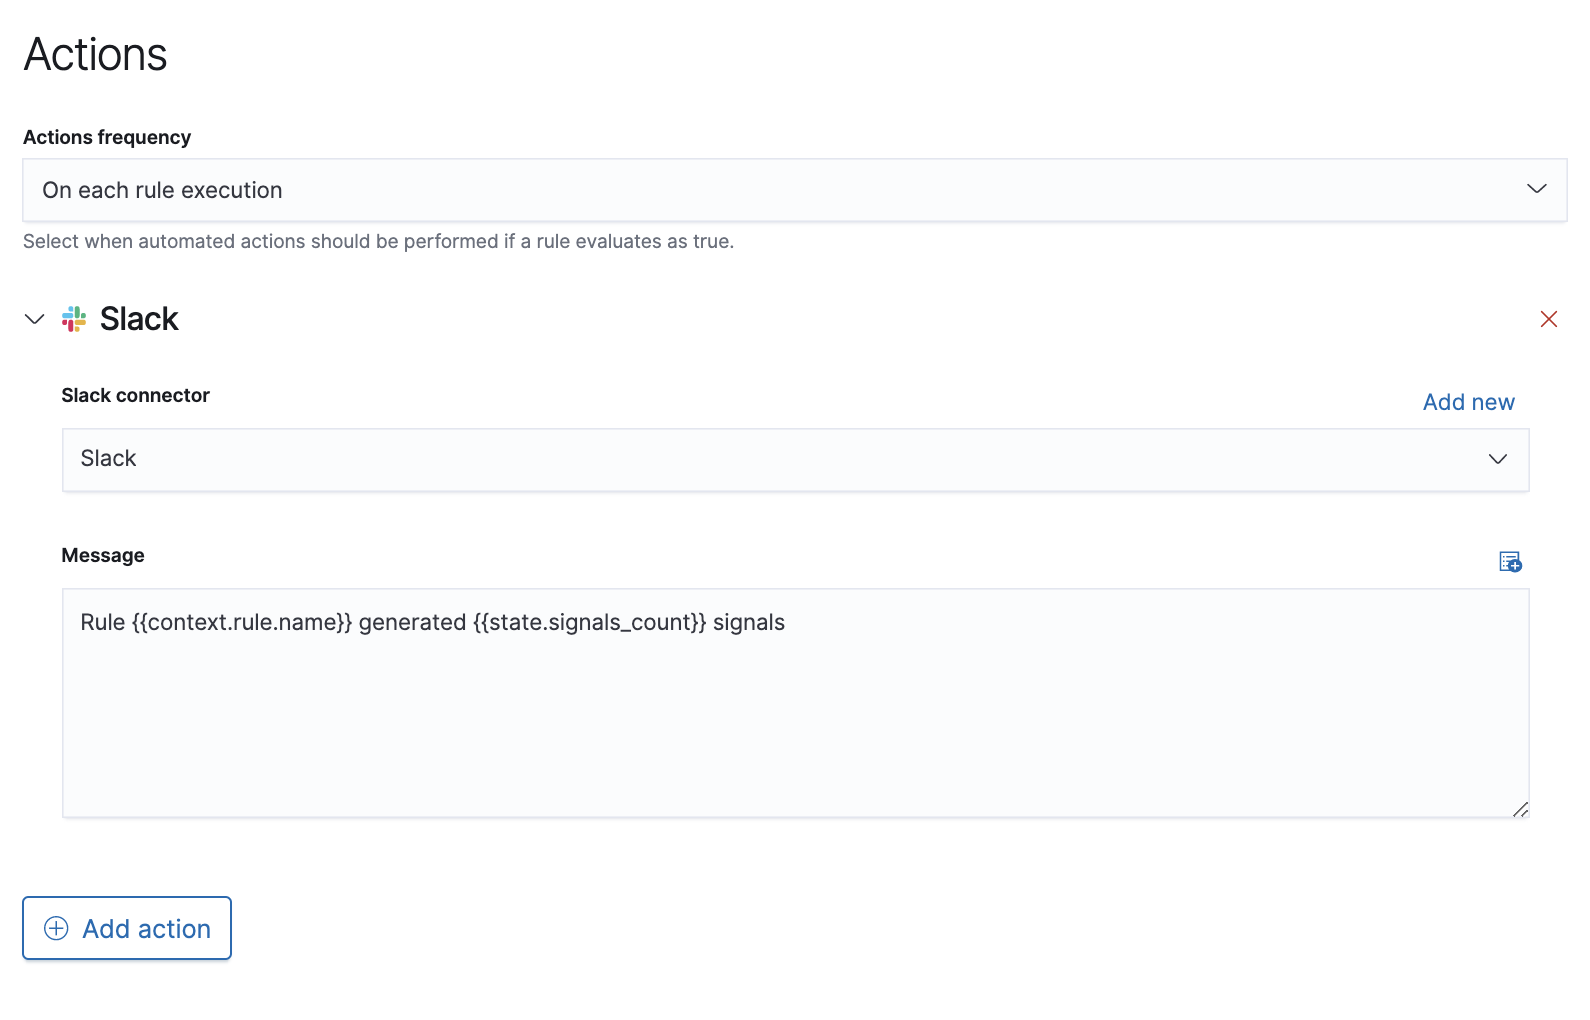
The selected action type fields are displayed (Slack example).
-
Fill in the fields for the selected action types. For all action types, click
the icon above the
Messagefield to add placeholders for rule and alert details to the notifications.
-
Fill in the fields for the selected action types. For all action types, click
the icon above the
-
Create the rule with or without activation.
When you activate a rule, it is queued and its schedule is determined by its initial run time. For example, if you activate a rule that runs every 5 minutes at 14:03 but it does not run until 14:04, it will run again at 14:09.
Alert notification placeholders
editThese placeholders can be added to rule action fields:
-
{{state.signals_count}}: Number of alerts detected -
{{{context.results_link}}}: URL to the alerts in Kibana -
{{context.rule.anomaly_threshold}}: Anomaly threshold score above which alerts are generated (machine learning rules only) -
{{context.rule.description}}: Rule description -
{{context.rule.false_positives}}: Rule false positives -
{{context.rule.filters}}: Rule filters (query rules only) -
{{context.rule.id}}: Unique rule ID returned after creating the rule -
{{context.rule.index}}: Indices rule runs on (query rules only) -
{{context.rule.language}}: Rule query language (query rules only) -
{{context.rule.machine_learning_job_id}}: ID of associated machine learning job (machine learning rules only) -
{{context.rule.max_signals}}: Maximum allowed number of alerts per rule execution -
{{context.rule.name}}: Rule name -
{{context.rule.output_index}}: Index to which alerts are written -
{{context.rule.query}}: Rule query (query rules only) -
{{context.rule.references}}: Rule references -
{{context.rule.risk_score}}: Default rule risk score -
{{context.rule.rule_id}}: Generated or user-defined rule ID that can be used as an identifier across systems -
{{context.rule.saved_id}}: Saved search ID -
{{context.rule.severity}}: Default rule severity -
{{context.rule.threat}}: Rule threat framework -
{{context.rule.threshold}}: Rule threshold values (threshold rules only) -
{{context.rule.timeline_id}}: Associated timeline ID -
{{context.rule.timeline_title}}: Associated timeline name -
{{context.rule.type}}: Rule type -
{{context.rule.version}}: Rule version
The {{context.rule.severity}} and {{context.rule.risk_score}}
placeholders contain the rule’s default values even when the Severity override
and Risk score override options are used.