Create a monitor status rule
editCreate a monitor status rule
editWithin the Uptime app, create a Monitor Status rule to receive notifications based on errors and outages.
- To access this page, go to Observability → Uptime.
- At the top of the page, click Alerts and rules → Create rule.
- Select Monitor status rule.
If you already have a query in the overview page search bar, it’s populated here.
Conditions
editYou can specify the following thresholds for your rule.
Status check |
Receive alerts when a monitor goes down a specified number of times within a time range (seconds, minutes, hours, or days). |
Availability |
Receive alerts when a monitor goes below a specified availability threshold within a time range (days, weeks, months, or years). |
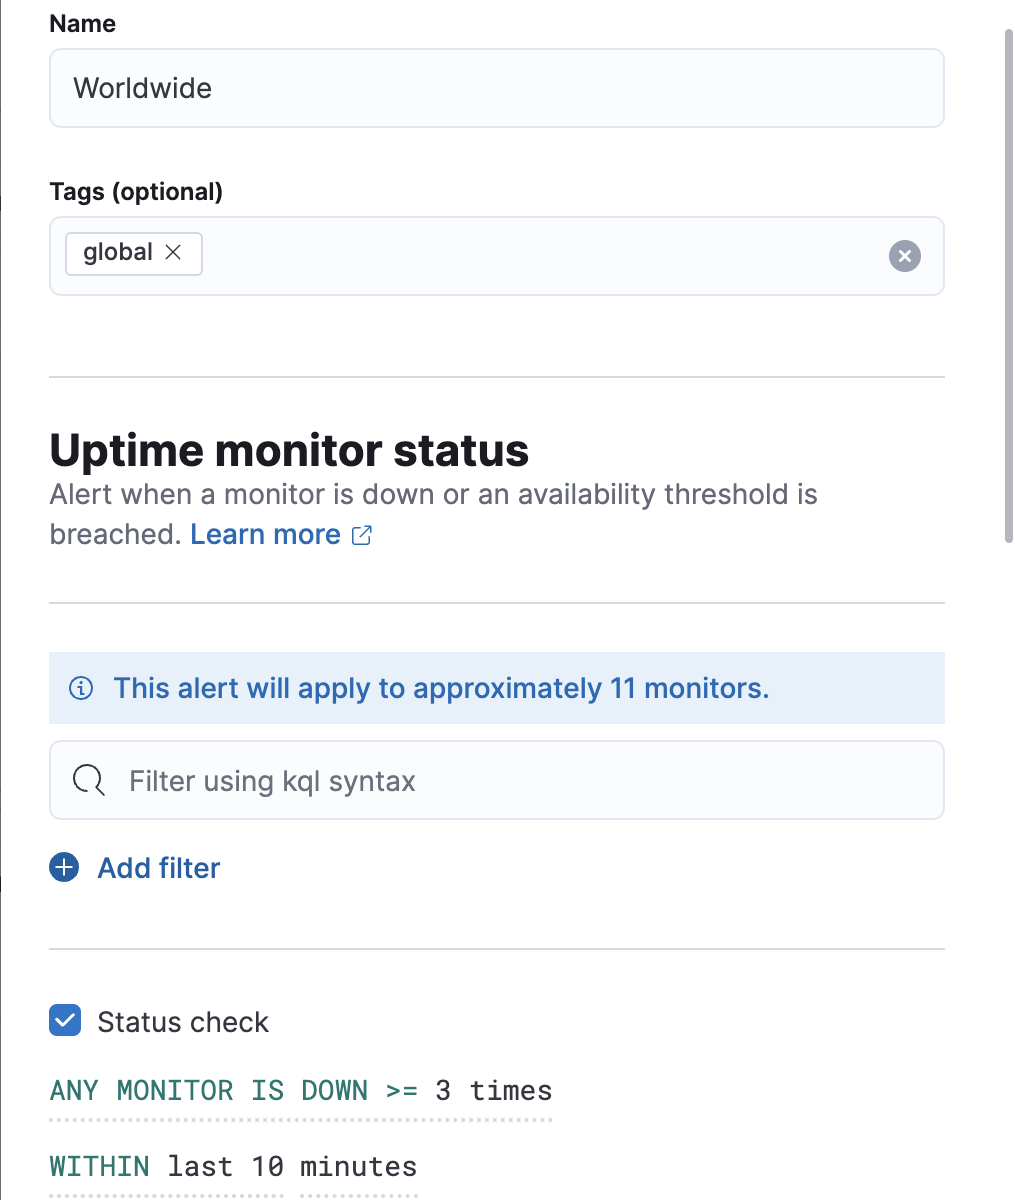
Let’s create a rule for any monitor that shows Down more than three times in 10 minutes.
This rule covers all the monitors you have running. You can use a query to specify specific monitors, and you can also have different conditions for each one.
The final step when creating a rule is to select one or more actions to take when the alert is triggered.
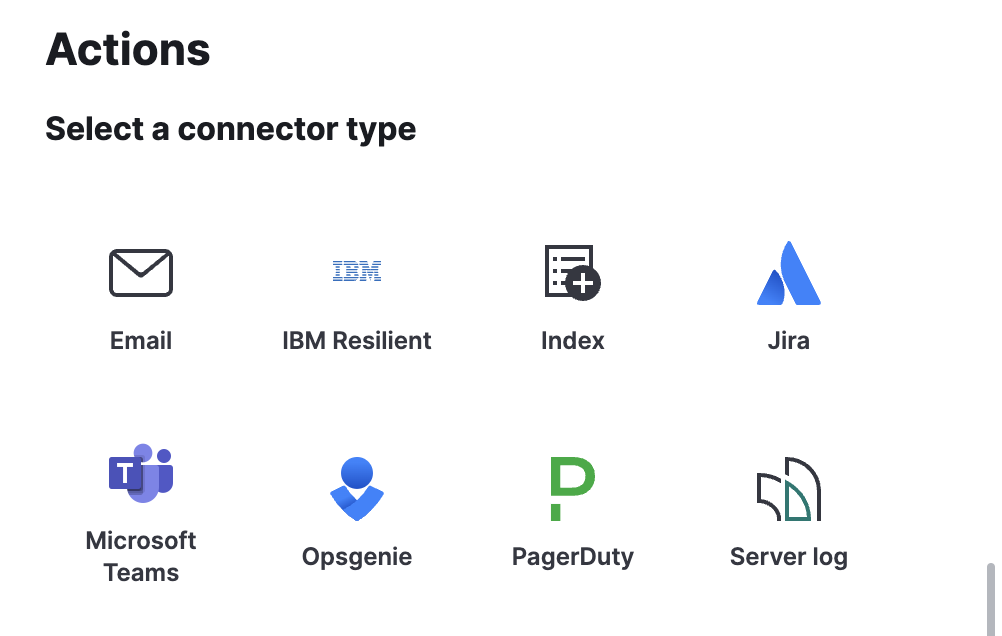
Action types
editYou can extend your rules by connecting them to actions that use the following supported built-in integrations. Actions are Kibana services or integrations with third-party systems that run as background tasks on the Kibana server when rule conditions are met.
You can configure action types on the Settings page.
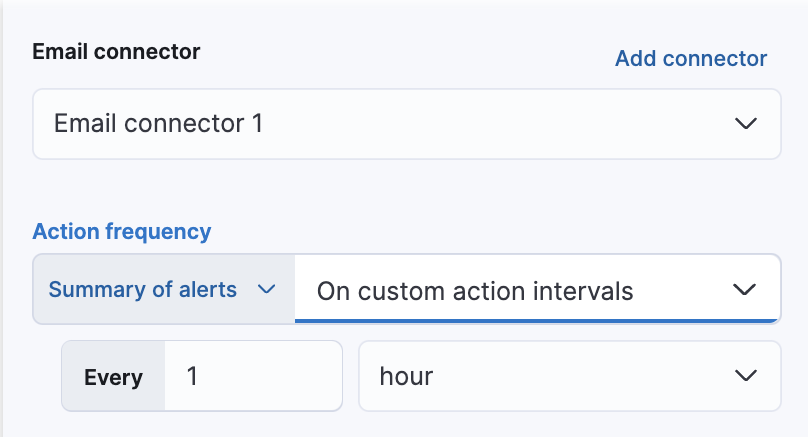
After you select a connector, you must set the action frequency. You can choose to create a summary of alerts on each check interval or on a custom interval. For example, send email notifications that summarize the new, ongoing, and recovered alerts each hour:
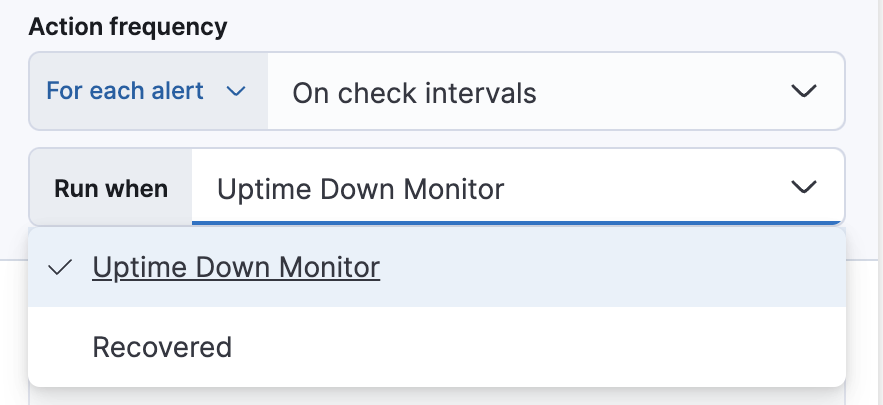
Alternatively, you can set the action frequency such that you choose how often the action runs (for example, at each check interval, only when the alert status changes, or at a custom action interval). In this case, you must also select the specific threshold condition that affects when actions run: Uptime Down Monitor or Recovered.
Action variables
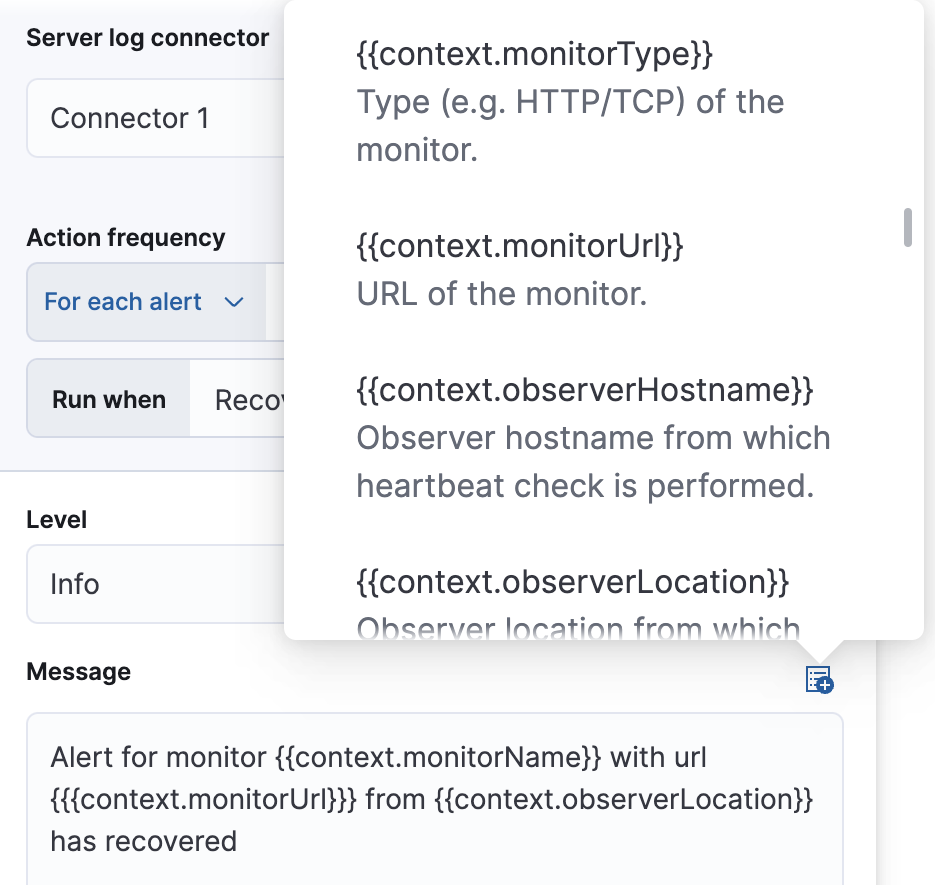
editUse the default notification message or customize it. You can add more context to the message by clicking the icon above the message text box and selecting from a list of available variables.
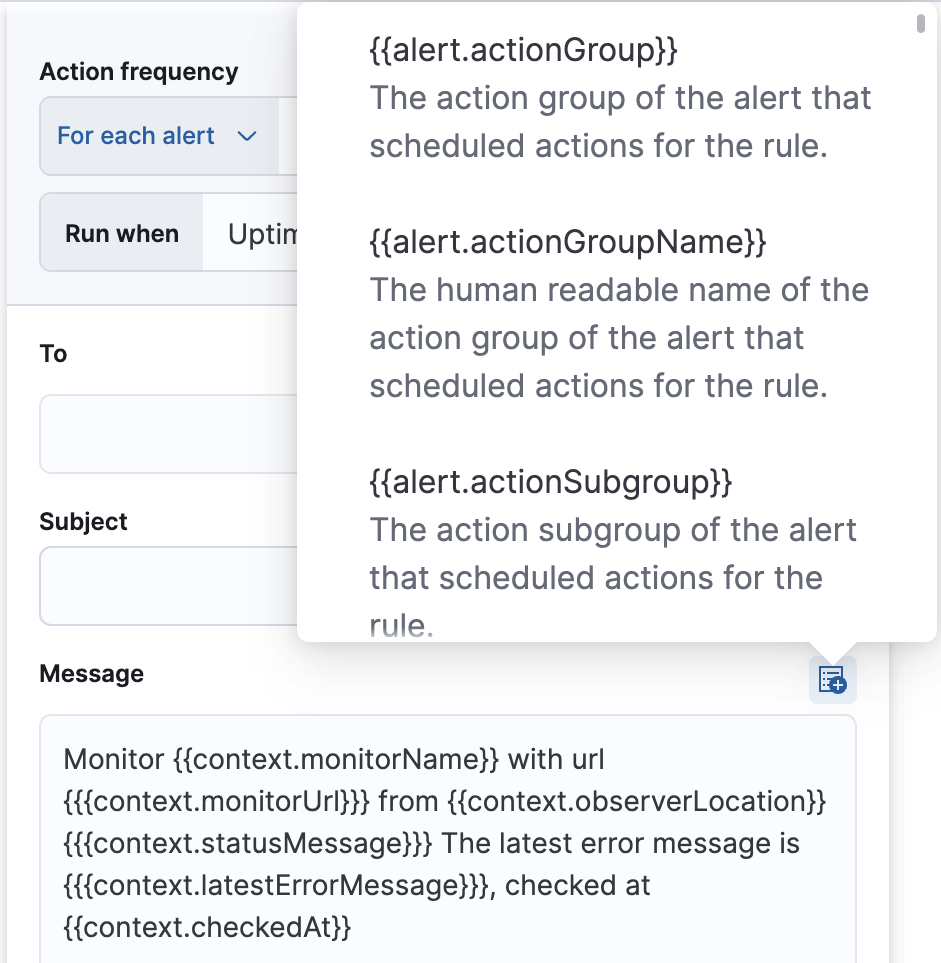
Alert recovery
editTo receive a notification when the alert recovers, select Run when Recovered. Use the default notification message or customize it. You can add more context to the message by clicking the icon above the message text box and selecting from a list of available variables.